Abstract
A cyclic depsipeptide, nobilamide I (1), along with the known peptide A-3302-B/TL-119 (2), was isolated from the saline cultivation of the marine-derived bacterium Saccharomonospora sp., strain CNQ-490. The planar structure of 1 was elucidated by interpretation of 1D and 2D NMR and MS spectroscopic data. The absolute configurations of the amino acids in 1 were assigned by using the C3 Marfey’s analysis and comparing them with those of 2 based on their biosynthetic pathways. Nobilamide I (1) decreased cell motility by inhibiting epithelial–mesenchymal transition markers in A549 (lung cancer), AGS (gastric cancer), and Caco2 (colorectal cancer) cell lines. In addition, 1 modulated the expression of the matrix metalloproteinase (MMP) family (MMP2 and MMP9) in the three cell lines.
1. Introduction
Cancer is the leading cause of death worldwide; nearly 10 million people died from cancer in 2020.1 Lung cancer is the most common cause of cancer death, and its death rate has been increasing worldwide. Colorectal cancer is the second and gastric cancer is the fourth common cause of cancer death. Early detection of cancer can increase not only the survival rate but also the chances of successful cancer treatment.2 However, effective treatments of metastatic cancer are limited, and novel therapeutics are needed.
Metastasis ensures the spreading of cancer cells from the original tumor sites to other parts of the body. It comprises the largest barrier to cancer therapy, which leads to the main cause of cancer-related deaths.3 Cancer cell motility is associated with many signaling pathways, such as epithelial-to-mesenchymal transition (EMT) and matrix metalloproteinases (MMPs). EMT enables the migration of cancer cells to invade other parts of the body and thereby plays an important role in cancer metastasis. During EMT, cells lose their polarity and become spindle-shaped due to the upregulation of N-cadherin and EMT transcription factors Snail, Slug, and Twist.4 MMPs are involved in the breakdown of some of the extracellular matrix (ECM) components.5 There are more than 20 MMPs, with each one having specific substrate requirements and structural domains. MMP-2 and MMP-9, which damage collagen and are important structural components of basement membranes, are important in metastasis. MMP inhibitors are used in cancer treatment as antimetastatic agents.6 Meanwhile, tissue inhibitors of metalloproteinases (TIMPs) are natural inhibitors of the MMPs. Therefore, suppressing the epithelial–mesenchymal transition and MMP2/9 expression processes has become an important goal in the development of anticancer therapeutics.
Marine-derived natural products are worthy pharmaceutical sources as their diverse chemical structures have provided unique biological activity features including unique targets.7 Over the last few decades, natural peptides have attracted much attention due to their specific features including a broad bioactivity spectrum and low toxicity, which makes them very promising drug candidates.8−10 According to the literature, over 60 peptide-based drugs are used in clinics, more than 400 are under clinical developments, and nearly 20 new peptides for clinical drug trials are being advanced every year.11 In particular, diverse marine organisms have proved to be an abundant source for various interesting structural peptides with potential biological activities.8,12,13 Recently, much attention has been paid to depsipeptides, which represent a significant group of peptide-lactones isolated from marine organisms.14 For example, a number of depsipeptides, including aplidine, dolastatin 15, kahalalide F, desmethoxymajusculamide C, thiocoraline, lagunamides, apratoxin A, and largazole, have been developed for treating various types of cancer or are under clinical testing to determine their potential utility as anticancer drugs.15,16 Studies have shown the advantages of using peptides as anticancer drugs compared to those in traditional treatments such as chemotherapy and radiotherapy by showing higher specificity against cancer cells.17 Depsipeptides contain the specific structural characteristics of peptides but with one or more amide groups replaced by the corresponding ester, thereby resulting in enhanced structural diversity and pharmacological activity.16
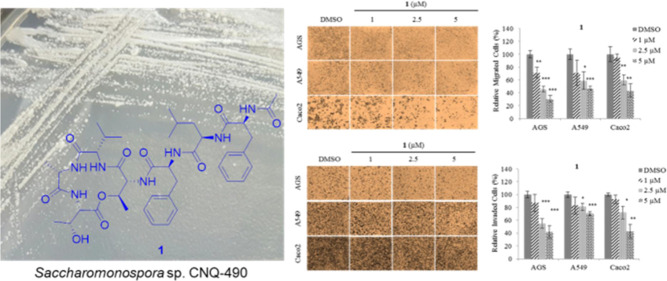
In our search for new anticancer agents from marine microorganisms, a new depsipeptide, nobilamide I (1), and the known peptide A-3302-B/TL-119 (2)18 were isolated from the marine-derived bacterium Saccharomonospora sp., strain CNQ-490 (Figure 1). Nobilamides A–H, neuroactive peptides isolated from marine bacterial strains belonging to the genus Streptomyces, inhibited the transient receptor potential vanilloid-1 (TRPV-1) channels, and A-3302-B/TL-119 (2) also had the effect on the production of long-term inhibition of TRPV1.19
Figure 1.
Structures of nobilamide I (1) and A-3302-B/TL-119 (2).
The strain CNQ-490 has been reported to possess19 biosynthetic gene clusters that indicate the potential for structurally diverse secondary metabolites.20 A unique alkaloid, lodopyridone A, was the first secondary bioactive metabolite to be isolated from this strain.21 To date, we have reported novel compounds from this strain, including lodopyridones B–C, saccharomonopyrones A–C, and saccharoquinoline.22−24 Interestingly, direct cloning and refactoring of silent gene clusters from this strain have also led to the successful isolation of taromycin A, a lipopeptide antibiotic.20 Although the isolated compounds from this strain have diverse structures and biological activities, numerous secondary metabolites recognized by their gene clusters remain undiscovered.
Herein, we report the isolation and structural elucidation of nobilamide I (1), along with analysis of 1 and 2.
2. Results and Discussion
Nobilamide I (1) was obtained as a white solid. The molecular formula of 1 was assigned as C42H55N7O10 (15 degrees of unsaturation) based on high-resolution ESI-MS data (obsd [M + H]+, m/z 822.4396, calcd [M + H]+ 822.4396). This molecular formula was confirmed by the NMR spectroscopic data (Table 1). The 1H NMR spectrum suggested that 1 is a peptide based on typical features for a peptide such as seven NH signals (δH 8.44, 8.15, 8.00, 7.88, 7.74, 7.70, and 7.64) and seven α-amino protons (δH 4.58, 4.53, 4.37, 4.28, 4.26, 3.99, and 3.87) along with one methyl singlet (δH 1.77) and seven methyl doublets (δH 1.35, 1.25, 1.01, 0.84, 0.77, 0.75, and 0.73). Furthermore, the 13C NMR spectrum of 1 showed eight amide/ester/carboxylic carbonyl carbon signals (δC 172.6, 171.8, 171.4, 171.3, 170.4, 170.0, 169.1, and 167.0) and seven α-carbon resonances (δC 61.2, 57.9, 57.1, 53.9, 53.4, 51.1, and 49.9). In addition, the HSQC spectrum of 1 showed that its structure contains 8 methyl groups, 3 methylene groups, 21 methine groups, and 10 quaternary carbons.
Table 1. NMR Spectroscopic Data for Nobilamide I (1) in DMSO-d6a.
| residue | position | nobilamide I |
|||
|---|---|---|---|---|---|
| δC | δH (J in Hz) | COSY | HMBC | ||
| L-Thr | 1 | 170.0, C | |||
| 2 | 57.1, CH | 4.37, dd (9.6, 1.8) | NH | 1, 3, 5 | |
| 3 | 67.0, CH | 4.30, m | 4, OH | ||
| 4 | 19.6, CH3 | 1.01, d (6.3) | 3 | 2, 3 | |
| NH | 7.70, d (9.6) | 2 | 5 | ||
| OH | 4.86, s | 3 | |||
| L-Ala | 5 | 172.5, C | |||
| 6 | 49.9, CH | 4.26, m | 7, NH | 5, 7 | |
| 7 | 18.2, CH3 | 1.35, d (7.4) | 6 | 5, 6 | |
| NH | 8.15, d (9.6) | 6 | |||
| L-Val | 8 | 170.4, C | |||
| 9 | 61.2, CH | 3.87, t (10.3) | 10, NH | 8, 11, 12 | |
| 10 | 28.8, CH | 1.90, m | 9, 11, 12 | 11, 12 | |
| 11 | 19.1, CH3 | 0.84, d (6.6) | 10 | 9, 10, 12 | |
| 12 | 19.0, CH3 | 0.75, d (6.6) | 10 | 9, 10, 11 | |
| NH | 7.64, d (9.3) | 9 | |||
| D-allo-Thr | 13 | 167.0, C | |||
| 14 | 57.9, CH | 3.99, dd (5.5, 1.7) | 14-NH | 13, 17 | |
| 15 | 72.8, CH | 4.50, m | 16 | 13 | |
| 16 | 16.6, CH3 | 1.25, d (6.5) | 15 | 14, 15 | |
| NH | 7.74, d (5.5) | 14 | 14, 15, 17 | ||
| L-Phe | 17 | 171.4, CO | |||
| 18 | 53.9, CH | 4.58, m | 19, NH | 17 | |
| 19α | 37.6, CH2 | 2.83, dd (10.7, 13.7) | 18, 19β | 20, 21, 25 | |
| 19β | 3.13, dd (4.6, 13.7) | 18, 19α | 20, 21, 25 | ||
| 20 | 137.1, C | ||||
| 21 | 129.1, CH | 7.19–7.24, mb | 22 | 22, 24 | |
| 22 | 127.9, CH | 7.19–7.24, mb | 21, 23 | 20, 21, 25 | |
| 23 | 126.3, CH | 7.19–7.24, mb | 22, 24 | 19, 21, 25 | |
| 24 | 127.9, CH | 7.19–7.24, mb | 23, 25 | 20, 21, 25 | |
| 25 | 129.1, CH | 7.19–7.24, mb | 24 | 22, 24 | |
| NH | 8.44, d (8.5) | 18 | 26 | ||
| D-Leu | 26 | 171.8, C | |||
| 27 | 51.1, CH | 4.28, m | 28, NH | 26, 28 | |
| 28 | 41.0, CH2 | 1.19, t (7.2) | 27, 29 | ||
| 29 | 23.8, CH | 1.29, m | 28, 30, 31 | ||
| 30 | 22.9, CH3 | 0.77, d (6.4) | 29 | 28, 29, 31 | |
| 31 | 21.7, CH3 | 0.73, d (6.4) | 29 | 28, 29, 30 | |
| NH | 8.00, d (7.5) | 27 | 32 | ||
| D-Phe | 32 | 171.3, C | |||
| 33 | 53.4, CH | 4.53, m | 34, NH | 32 | |
| 34α | 37.3, CH2 | 2.66, dd (9.5, 14.0) | 33, 34β | 35, 36, 40 | |
| 34β | 2.91, dd (3.7, 14.0) | 33, 34α | 35, 36, 40 | ||
| 35 | 137.6, C | ||||
| 36 | 129.2, CH | 7.19–7.24, mb | 37 | 37, 39 | |
| 37 | 128.0, CH | 7.19–7.24, mb | 36, 38 | 35, 36, 40 | |
| 38 | 126.1, CH | 7.18, m | 37, 39 | 33, 36, 40 | |
| 39 | 128.0, CH | 7.19–7.24, mb | 38, 40 | 35, 36, 40 | |
| 40 | 129.2, CH | 7.19–7.24, mb | 39 | 37, 39 | |
| NH | 7.88, d (8.2) | 33 | |||
| 41 | 169.1, C | ||||
| 42 | 22.4, CH3 | 1.77, s | 41 | ||
400 MHz for 1H NMR and 100 MHz for 13C NMR.
Signals were overlapping.
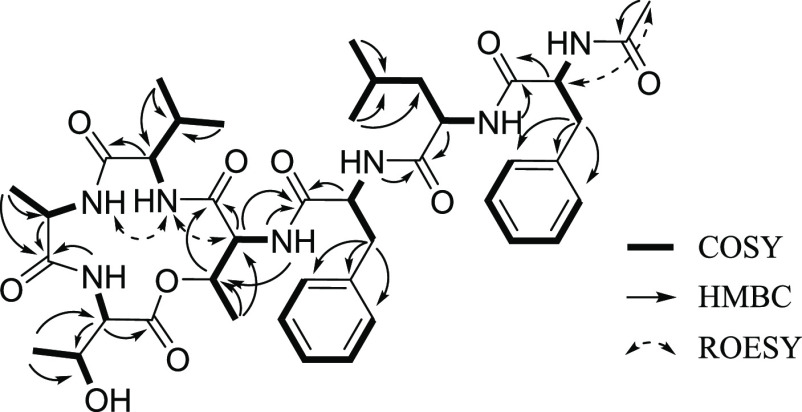
Interpretation of the COSY and HMBC spectroscopic data of 1 identified seven amino acid subunits: two threonines (Thr), one alanine (Ala), one valine (Val), one leucine (Leu), and two phenylalanines (Table 1; Figure 2). The first Thr (Thr-1) was assigned from the COSY correlations H3-16 (δH 1.25, d, J = 6.5 Hz)/H-15 (δH 4.50, m)/H-14 (δH 3.99, dd, J = 5.5, 1.7 Hz)/14-NH (δH 7.74, d, J = 5.5 Hz) combined with the long-range HMBC correlations from H3-16 to C-15 (δC 72.8)/C-14 (δC 57.9), from H-15 and H-14 to C-13 (δC 167.0), and from 14-NH (δH 7.74) to C-15. Two COSY spin systems of H-2 (δH 4.37, dd, J = 9.6, 1.8 Hz)/2-NH (δH 7.70, d, J = 9.6 Hz) and H3-4 (δH 1.01, d, J = 6.3 Hz)/H-3 (δH 4.30, m)/3-OH (δH 4.86) coupled with the HMBC correlations from H3-4 to C-3 (δC 67.0)/C-2 (δC 57.1) and from H-2 to C-1 (δC 170.0)/C-3 completed the structural analysis of the second Thr (Thr-2) moiety. Ala was assigned from the COSY correlations between H-6 (δH 4.26, m), H3-7 (δH 1.35, d, J = 7.4 Hz), and 6-NH (δH 8.15, d, J = 9.6 Hz) coupled with the long-range HMBC correlations from H3-7 to C-6 (δC 49.9) and C-5 (δC 172.5). The COSY correlations of H-9 (δH 3.87, t, J = 10.3 Hz)/H-10 (δH 1.90, m)/H3-11 (δH 0.84, d, J = 6.6 Hz)/H3-12 (δH 0.75, d, J = 6.6 Hz)/9-NH (δH 7.64, d, J = 9.3 Hz) with the long-range HMBC correlations from H3-11/H3-12 to C-10 (δC 28.8) and C-9 (δC 61.2) and from H-9 to C-8 (δC 170.4) enabled assigning of the Val moiety. Leu was identified from the COSY spin system of H3-31 (δH 0.73, d, J = 6.4 Hz)/H3-30 (δH 0.77, d, J = 6.4 Hz)/H-29 (δH 1.29, m)/H2-28 (δH 1.19, t, J = 7.2 Hz)/H-27 (δH 4.28, m)/27-NH (δH 8.00, d, J = 7.5 Hz), which was also supported by the long-range HMBC correlations from H3-31/H3-30 to C-29 (δC 23.8) and C-28 (δC 41.0) and from H-27 to C-26 (δC 171.8). The presence of eight signals assigned to 10 carbons in the typical aromatic region between 126.1 and 137.6 ppm and the HMBC correlations from H-19α (δH 2.83, dd, J = 13.7, 10.7 Hz)/H-19β (δH 3.13, dd, J = 13.7, 4.6 Hz) to C-20 (δC 137.1)/C-21 (δC 129.1)/C-25 (δC 129.1) and from H-34α (δH 2.66, dd, J = 14.0, 9.5 Hz)/H-34β (δH 2.91, dd, J = 14.0, 3.7 Hz) to C-35 (δC 136.7)/C-36 (δC 129.2)/C-40 (δC 129.2) indicate that the structure of 1 contains two Phe residues. Furthermore, the COSY correlation of two spin systems, H-19α/H-19β/H-18 (δH 4.58, m)/18-NH (δH 8.44, d, J = 8.5 Hz) and H-34α/H-34β/H-33 (δH 4.53, m)/33-NH (δH 8.00, d, J = 8.2 Hz), along with the long-range HMBC correlations from H-18 to C-17 (δC 171.4) and H-33 to C-32 (δC 171.3), supports the existence of two phenylalanines. Last, the HMBC correlation from H3-42 (δH 1.77, s) to C-41 (δC 169.1) indicates the presence of an acetyl group at the N-terminus.
Figure 2.
COSY and key HMBC and ROESY correlations for nobilamine I (1).
The amino acid linkage in 1 and an acetyl group at the N-terminus were determined based on interpretation of the long-range HMBC and ROESY correlations. The α-amino proton of Thr-1 (δH 7.70, d, J = 9.6 Hz) was observed due to its correlation with the carbonyl carbon of Ala (δC 172.5) in the HMBC spectrum. The ROESY correlation between the amide protons of Ala (δH 8.15, d, J = 9.6 Hz) and Val (δH 7.64, d, J = 9.3 Hz) infers that Ala is attached next to Val. The connection between Val and Thr-2 was revealed by the ROESY correlation between the α-amino proton of Val and H-14 in Thr-2. The linkage of C-1/O/C-15 between Thr-1 and Thr-2 was revealed by the deshielded values of chemical shifts of H-15 (δH 4.50, m) and C-15 (δC 72.8) in Thr-2. The first Phe (Phe-1) was positioned next to Thr-2, as inferred by the HMBC correlations from the amide proton of Thr-2 (δH 7.74, d, J = 5.5 Hz) to the carbonyl carbon of Phe-1, C-17 (δC 171.4). The connectivity from Phe-1 to Leu and from Leu to the second Phe (Phe-2) was established by analyzing HMBC correlations from the amide proton of Phe-1 to the carbonyl carbon of Leu (δC 171.8) and from the amide proton of Leu (δH 8.00, d, J = 7.5 Hz) to the carbonyl carbon of Phe-2 (δC 171.3). Last, the ROESY correlation between H-33 and H-42 (δH 1.77, s) confirmed the location of an acetyl group at the N-terminus.
The 1H NMR spectrum of compound 2 was very similar to that of 1 except for the presence of a quadruplet sp2 proton (δH 6.70) as well as shifting of methyl protons from H3-4 in 1 to methyl protons (δH 1.63, d, J = 6.9 Hz) in 2. When comparing the spectroscopic data for 2 with those reported in the literature, 2 was identified as the heptapeptide A-3302-B/TL-119 (2).18
Acid hydrolysis followed by chemical derivatization with Marfey’s reagent (1-fluoro-2-4-dinitrophenyl-5-l-alanine amide; l-FDAA) was performed on compound 1 to analyze the absolute configurations of its amino acid residues. LC-ESI-MS data (0.64 min, m/z 822.4396) comparison between the reaction products of 1 and authentic standards led to the identification of l-Thr, l-Ala, l-Val, d-allo-Thr, l-Phe, d-Leu, and d-Phe, (Table S1; Figure S8). However, the exact position of l-Thr/d-allo-Thr and L/d-Phe could not be determined in the C3 Marfey’s analysis. The structures of 1 and 2 possess similar amino acids (l-Ala, l-Val, d-allo-Thr, l-Phe, d-Leu, and d-Phe), and the only structural difference between the two compounds is the presence of a Z-α,β-dehydrobutyrine unit in 2 instead of l-Thr in 1. It has been previously reported that the Z-α,β-dehydrobutyrine residue is biosynthesized from l-Thr by dehydration.25 Therefore, 1 could be a biosynthetic intermediate of 2. Finally, we suggest that the sequence and configuration of 1 is l-Thr, l-Ala, l-Val, d-allo-Thr, l-Phe, d-Leu, and d-Phe (Figure 1).
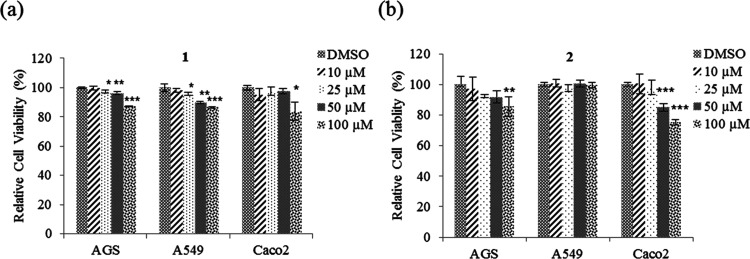
Various concentrations (10, 25, 50, and 100 μM) of compounds 1 and 2 were added to AGS, A549, and Caco2 cells to evaluate the effect of their cytotoxic and/or cytostatic activities via the methyl thiazolyl tetrazolium (MTT) assay. The cell viabilities of AGS and A549 were unaffected by treatment with 10 μM 1 but significantly decreased with 25–100 μM 1 for 48 h. In contrast, the cell viability of Caco2 was unaffected by treatment with 10–50 μM 1, whereas that of Caco2 decreased with 100 μM 1 (Figure 3a). The inhibitory activity of 2 on the viability of all three cell lines was also observed. The cell viability of AGS was unaffected by treatment with 10–50 μM but significantly decreased with 100 μM. The cell viability of Caco2 was unaffected by treatment with 10–25 μM 2 but significantly decreased with 50–100 μM for 48 h. In contrast, the cell viability of A549 was unaffected by 2 (Figure 3b). Therefore, these results indicate that 1 showed higher activity than 2 on decreasing the cell viability of A549.
Figure 3.
Cell viability assays with nobilamide I (1) and A-3302-B/TL-119 (2). (a) AGS, A549, and Caco2 cells treated with 1 in the concentration range from 10 to 100 μM for 48 h; (b) AGS, A549, and Caco2 cells treated with 2 in a concentration range from 10 to 100 μM for 48 h. Cell viability was measured by using MTT assays. Data are presented as mean ± SE, n = 3. *p < 0.05; **p < 0.01; ***p < 0.001.
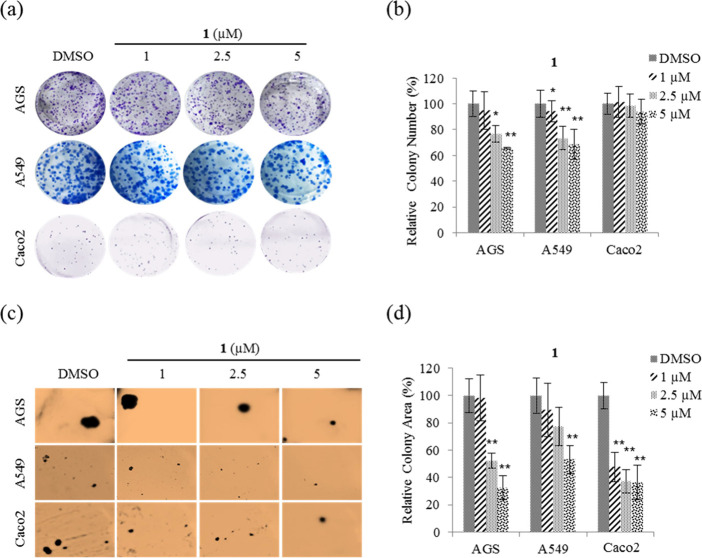
Proliferation and tumorigenicity with anchorage-independent growth are critical actions during cancer development and progression. Hence, clonogenic and soft agar colony formation assays were performed to determine whether treatment with compound 1 at nontoxic concentrations affects the proliferation and tumorigenicity, respectively, of AGS, A549, and Caco2 cells. From the results (Figure 4a), it can be seen that 1 significantly decreased the number of colonies for AGS and A549, indicating that cell proliferation was inhibited. Quantitative analysis showed that 1 inhibited the number of colonies by ∼35% at 5 μM on AGS and A549 compared with DMSO. In contrast, 1 did not inhibit Caco2 cell proliferation (Figure 4b). Therefore, these results show that cell viabilities in Figure 3 are due to cytostatic activity rather than cytotoxicity.
Figure 4.
Effect of nobilamide I (1) on the proliferation and tumorigenicity of AGS, A549, and Caco2 cells. Representative images of (a) each insertion in the clonogenic assay, (b) colony numbers in each group, and (c) each insertion in the soft agar colony formation assay, and (d) relative percentage colony area in each group. Data are presented as mean ± SD, n = 3. *p < 0.05; **p < 0.01.
Soft agar colony formation assays were performed to test whether nontoxic concentrations of 1 affected the anchorage-independent growth of AGS, A549, and Caco2. From the results (Figure 4c), it is evident that colony formation on soft agar for the three cell lines was significantly decreased by treatment with 1. Quantitative analysis shows that 1 at a concentration of 5 μM inhibited the colony formation of AGS, A549, and Caco2 cells on soft agar by ∼70, ∼50, and ∼60%, respectively, compared with DMSO (Figure 4d). These results indicate that 1 suppressed tumorigenicity in AGS, A549, and Caco2 cells.
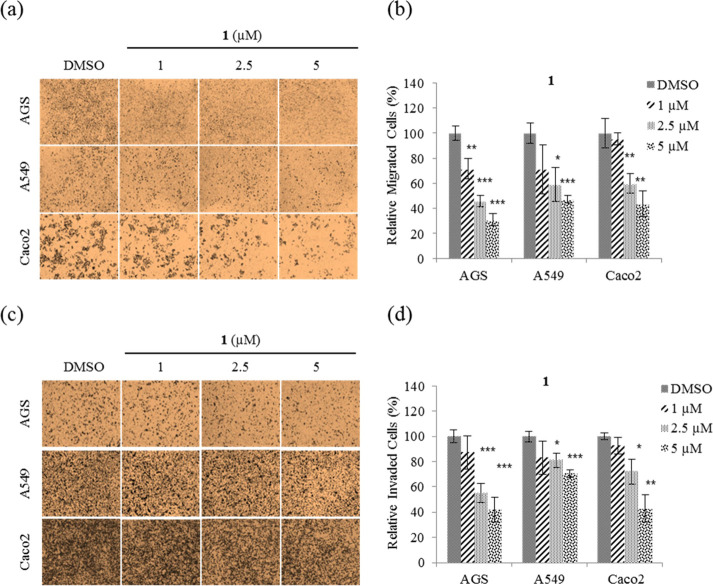
Migration and invasion play an important role during cancer metastasis.3 To determine whether 1 affects cancer cell motility, migration and invasion assays were performed using nontoxic concentrations (1, 2.5, and 5 μM) on AGS, A549, and Caco2 cells. From the results (Figure 5a), we can see that treatment with 1 significantly decreased the migration ability of all three cell lines. Quantitative analysis shows that 1 at a concentration of 5 μM inhibited migration of AGS, A549, and Caco2 cells by ∼70, ∼50, and ∼60%, respectively, compared with DMSO (Figure 5b), and inhibited invasion by ∼60, ∼30, and ∼60%, respectively (Figure 5c,d). Taken together, these results show that 1 inhibits both the cell migration and invasion ability on AGS, A549, and Caco2 cells.
Figure 5.
Inhibition of AGS, A549, and Caco2 cell motility by nobilamide I (1). (a) Representative images of each insertion in the migration assay, (b) relative percentage of migrated cells, (c) representative images of each insertion in the invasion assay, and (d) relative percentage of invaded cells. Data are presented as the mean ± SD, n = 3. *p < 0.05; **p < 0.01; ***p < 0.001.
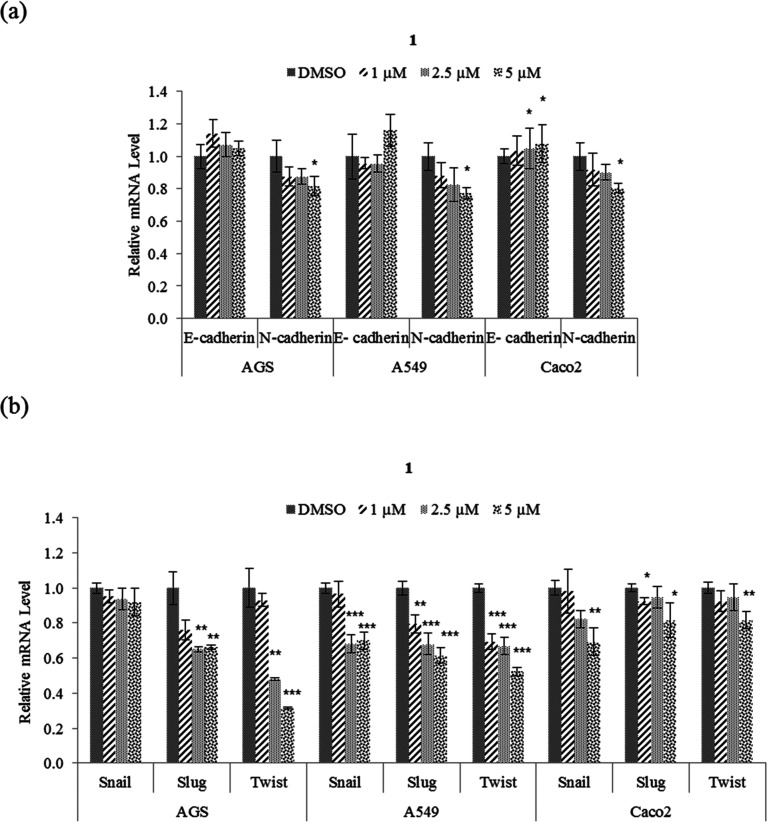
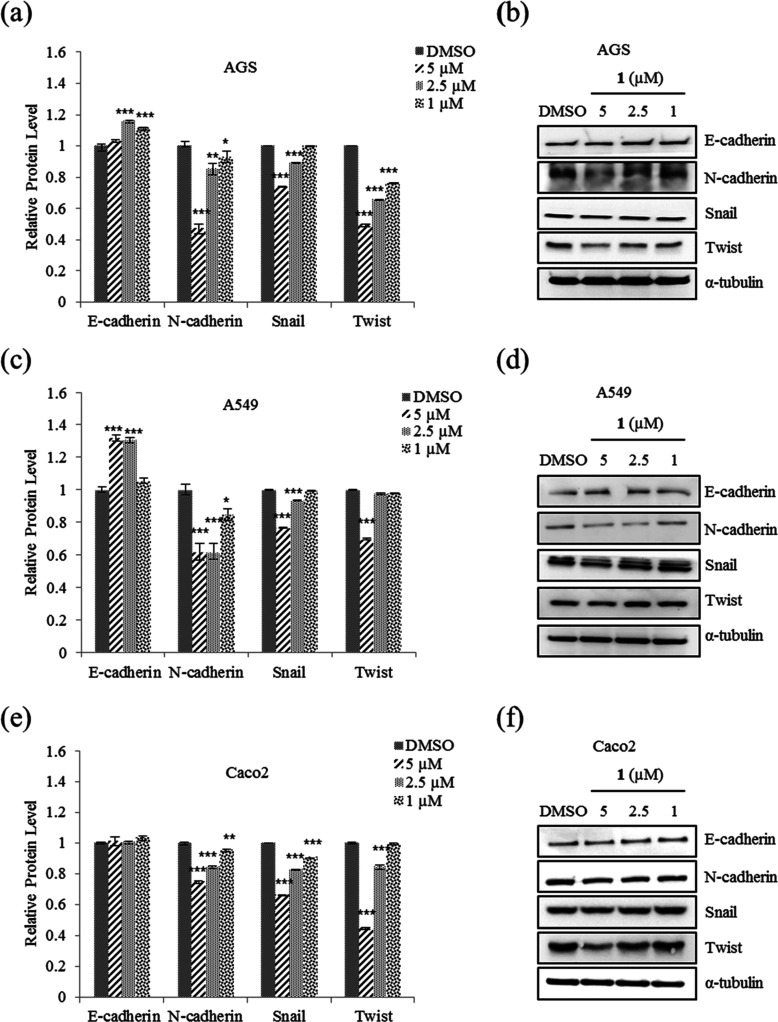
EMT plays an important role in cancer cell motility to distant organs and is thereby a key regulator of metastasis.4 To determine whether the suppression of motility and tumorigenicity in A549, AGS, and Caco2 cells in the presence of 1 involve EMT, the protein and mRNA expression levels of EMT effectors and transcription factors were examined. From the results (Figure 6a), it was observed that 5 μM 1 increased the expression of E-cadherin mRNA in Caco2 cell but not those in A549 and AGS. As shown in Figure 7, the protein level of E-cadherin in A549 and AGS increased after treatment with 1. In addition, 1 decreased the protein and mRNA expression levels of N-cadherin and EMT transcription factors Snail, Slug, and Twist in AGS, A549, and Caco2 cells (Figures 6 and 7). Taken together, these results showed that 1 modulates the expression of EMT effector N-cadherin by downregulating the transcription factors Snail, Slug, and Twist.
Figure 6.
Effect of nobilamide I (1) on the mRNA expression levels of EMT markers in A549, AGS, and Caco2 cells. Relative mRNA expression levels of (a) EMT effectors N-cadherin and E-cadherin and (b) EMT transcription factors Snail, Slug, and Twist. The mRNA levels were normalized against the housekeeping gene glyceraldehyde 3-phosphate dehydrogenase (GAPDH). Data are presented as mean ± SD, n = 3. *p < 0.05; **p < 0.01; ***p < 0.001.
Figure 7.
Effect of nobilamide I (1) on the protein levels of EMT markers in A549, AGS, and Caco2 cells. AGS: (a) relative protein levels of EMT effectors N-cadherin and E-cadherin and (b) western blot analysis of E-cadherin and N-cadherin and EMT transcription factors Snail, Slug, and Twist. A549: (c) relative protein levels and (d) western blot analysis of E-cadherin, N-cadherin, Snail, Slug, and Twist. Caco2: (e) relative protein levels and (f) western blot analysis of E-cadherin, N-cadherin, Snail, and Twist. Data are presented as mean ± SD, n = 3. *p < 0.05; **p < 0.01; ***p < 0.001.
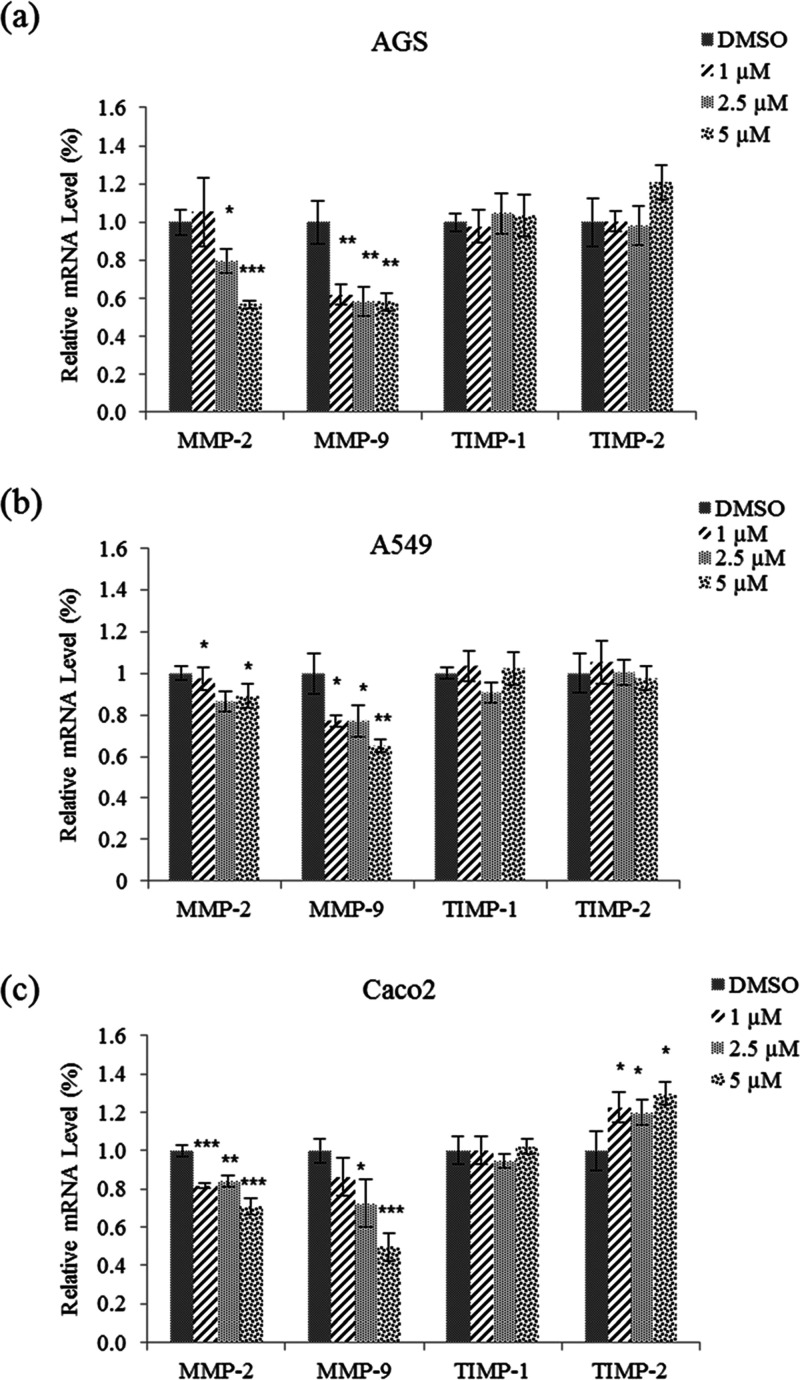
MMPs play an important role in the degradation of the ECM. MMP-2 and MMP-9 degrade type IV collagen, which enables cancer cells to migrate out of the primary tumor sites to form metastases.6 Quantitative real-time PCR (qRT-PCR) assays were performed to determine whether 1 affects the mRNA expression levels of MMP2 and MMP9 in AGS, A549, and Caco2 cells. From the results (Figure 8), it can be seen that treatment with 5 μM 1 significantly decreased the mRNA expression levels of MMP2 and MMP9 in all three cell lines.
Figure 8.
Effect of nobilamide I (1) on the mRNA expression levels of MMP2 and MMP9 in A549, AGS, and Caco2 cells. Relative mRNA expression of the MMP2, MMP9, TIMP1, and TIMP2 in (a) AGS, (b) A549, and (c) Caco2 cells. The mRNA levels were normalized against the housekeeping gene glyceraldehyde 3-phosphate dehydrogenase (GAPDH). Data are presented as mean ± SD, n = 3. *p < 0.05; **p < 0.01; ***p < 0.001.
Next, qPCR assays were conducted to measure the mRNA expression levels of TIMPs such as TIMP1 and TIMP2. As TIMPs are known to be tissue inhibitors of metallopeptidases, they are used as targets for cancer treatments with antimetastatic activity.26 Treatment with 1 did not affect the mRNA expression levels of TIMP1 and TIMP2 in the AGS and A549 cell lines. Conversely, 1 significantly increased the mRNA expression level of TIMP2 in Caco2 cells (Figure 8c). Taken together, the results show that 1 decreased the mRNA expression levels of MMP2 and MMP9 in all three cell lines but only increased the mRNA expression level of TIMP2 in Caco2 cells.
3. Conclusions
A new depsipeptide, nobilamide I (1), and known peptide A-3302-B/TL-119 (2) were isolated from the marine-derived bacterium Saccharomonospora sp. strain CNQ-490. Compound 1 is a cyclic depsipeptide containing seven amino acid units that belong to a series of cyclic or linear depsipeptides named nobilamides. The core structure of 1 is very similar to that of 2 except that the Z-α,β-dehydrobutyrine unit is replaced by an l-Thr, suggesting that 1 is an intermediate of 2 through a dehydration biosynthesis pathway. Moreover, 1 showed higher activity than 2 and modulated the protein and mRNA expression levels of EMT effectors N-cadherin and E-cadherin by downregulating the transcription factors Snail, Slug, and Twist. In addition, 1 modulated the protein and mRNA expression levels of MMP2 and MMP9 in AGS, A549, and Caco2 cells (Figure 9).
Figure 9.
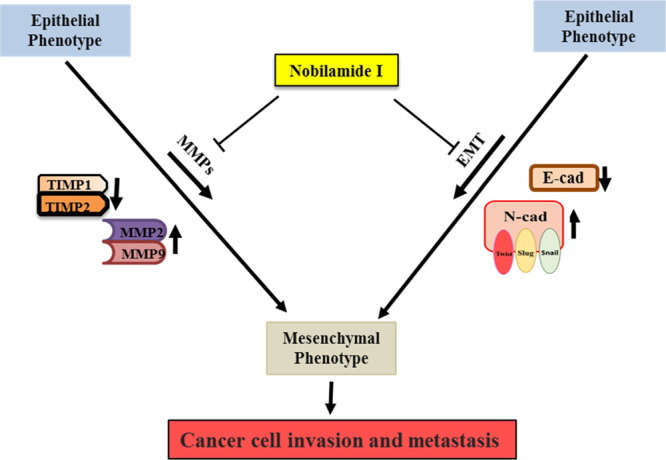
Schematic representation of the nobilamide I (1) mechanism of action. It inhibits cancer cell motility and tumorigenesis via suppressing the protein and mRNA expression of EMT effectors N-cadherin and E-cadherin by downregulating EMT transcription factors Snail, Slug, and Twist, as well as the protein and mRNA expression levels of MMP2/9.
4. Experimental Section
4.1. General Experimental Procedures
The optical rotations were measured using a Kruss optronic polarimeter P8000. IR spectra were recorded on a Perkin-Elmer 1600 FT-IR spectrometer. Nuclear magnetic resonance spectra were obtained with a Varian Inova NMR spectrometer. 1H NMR and 13C NMR were obtained at 400 and 100 MHz, respectively, in DMSO-d6. 2D NMR spectra were measured in DMSO-d6 at 500 MHz. High-resolution EI-MS spectra were performed by using a JEOL JMS-AX505WA mass spectrometer. Low-resolution mass data were measured with an Agilent Technologies 6120 quadrupole LC/MS system using a reverse-phase column (Phenomenex Luna C18 (2) 100 Å, 50 × 4.6 mm, 5 μm) at a 1.0 mL/min flow rate. Open column chromatography was performed with a C18 column (40–63 μm, ZEO prep 90) using a gradient of water (H2O) and methanol (MeOH) mixture. The HPLC separation was performed with a reverse-phase HPLC system (Phenomenex Luna C18 column (250 × 10 mm, 5 μm), flow rate of 2.0 mL/min, mixture of acetonitrile and water).
4.2. Strain Isolation and Fermentation
The actinomycete bacterium Saccharomonospora sp. strain CNQ-490 was obtained from a 45 m deep-sea sediment sample at 2 km west of the Scripps pier, La Jolla Canyon, in California. The strain was identified as a new operational taxonomic unit within the genus Saccharomonospora via a 16S rRNA sequence analysis and subsequent phylogenetic analysis. The strain CNQ-490 was cultivated in a large-scale fermentation with 30 × 2.5 L Ultra Yield Flasks (Thomson Scientific, Oceanside, CA) each containing 1 L of SYP medium (10 g/L of soluble starch, 2 g/L of yeast, 4 g/L of peptone, 10 g/L of CaCO3, 20 g/L of KBr, and 8 g/L of Fe2(SO4)3·4H2O dissolved in 1000 mL of artificial seawater) at 25 °C with shaking at 150 rpm. After a culture period of 7 days, 1 L of ethyl acetate (EtOAc) was added to each flask (adjusted to pH 7) to extract the compounds. The organic phases were combined, and the solvent was removed under vacuum to yield 4.6 g of organic extract.
4.3. Extraction and Purification
The EtOAc extract was fractionated into nine fractions using reverse-phase C18 silica flash chromatography with a stepwise gradient elution of 80% of H2O in MeOH to 100% MeOH. The 70% methanol/water fraction was subjected to preparative reverse-phase C18 high-performance liquid chromatography using isocratic conditions with 45% acetonitrile/water to produce 100 mg of a semipurified subfraction. To purify the subfraction, the material was refractionated using 42% acetonitrile/water to yield 3.0 mg of compound 1 and 5.0 mg of compound 2.
Nobilamide I (1): white solid, [α]25D-10 (c 0.75, MeOH), UV (MeOH) λmax (log ε) 200 (2.9), 220 (2.57); IR (KBr) νmax 3431, 1644 cm–1; 1H and 13C NMR data, see Table 1; HRFABMS m/z 822.4396 [M + H]+ (calcd for C42H60N7O10+, 822.4396).
A-3302-B/TL-119 (2): white solid, 1H NMR (400 MHz, DMSO-d6) 8.39 (br, 1H), 8.33 (br, 1H), 8.04 (br, 1H), 8.00 (d, J = 7.6, 1H), 7.87 (br, 1H), 7.65 (br, 1H), 7.26–7.16 (overlaid, 12H), 6.70 (q, J = 7.4, 1H), 4.55–4.49 (overlaid, 2H), 4.28 (m, 1H), 4.20 (m, 1H), 4.04 (d, J = 6.4, 1H), 3.94 (t, J = 9.7, 1H), 3.10 (dd, J = 13.4, 4.9; 2H), 2.93 (dd, J = 14.0, 4.4; 2H), 2.82 (dd, J = 13.1, 10.5; 2H), 2.67 (dd, J = 13.5, 9.1; 2H), 1.94 (m, 1H), 1.63 (d, J = 6.9, 3H), 1.32 (d, J = 7.4, 3H), 1.29 (d, J = 5.9, 3H), 0.84 (d, J = 6.9, 3H), 0.77 (d, J = 6.4, 6H), 0.73 (d, J = 6.2, 3H). LRESIMS m/z 803.43 [M + H]+.
4.3.1. C3 Marfey’s Analysis
Compound 1 (50 μg) was dissolved in 100 μL of 6 N HCl in a sealed vial and incubated at 110 °C for 30 min with stirring. The hydrolysate was dried under N2 gas, resuspended to a distilled water (100 μL), and then dried again. The hydrolysate was treated with 1 M NaHCO3 (100 μL) and 1% l-FDAA in acetone (25 μL). The reaction vial was incubated at 50 °C for 30 min. The reaction was quenched by the addition of 1 M HCl (100 μL).27 The authentic standard amino acids were also treated by using the same protocol. The reaction products were analyzed by using LC-ESI-MS with UV monitoring (340 nm) and negative ESI-MS detection using the following chromatographic method: Agilent Zorbax SB-C3 column (5 μm, 150 × 4.6 mm), 50 °C, 1 mL/min, solvent A (0.02% formic acid in H2O), solvent B (MeOH), A/B = 65:35 → 65:35 (5 min) → 50:50 (65 min) → 0:100 (70 min) → 0:100 (78 min) → 65:35 (80 min) → 65:35 (90 min).
4.3.2. Cell Culture
Human cancer cell lines A549 (lung cancer), AGS (gastric cancer), and Caco2 (colorectal cancer) were maintained in either Roswell Park Memorial Institute (RPMI) or Dulbecco’s modified Eagle’s medium (DMEM) supplemented with 10% fetal bovine serum and 1% penicillin–streptomycin solution in a humidified atmosphere of 5% CO2 at 37 °C.
4.3.3. MTT Assay
Cells (3 × 10³ cells/well) were seeded on 96-well plates, grown overnight, and then treated with 10, 25, 50, or 100 μM concentrations of compound 1 for 48 h. Once treatment was completed, the cultures were supplemented with MTT. After incubation with MTT at 37 °C, the cells were lysed with 150 μL of DMSO, and absorbance was measured spectrophotometrically at 570.28
4.3.4. Invasion Assay
This assay was conducted in transwell chambers containing polycarbonate membranes with 8 μm pores coated with 1% gelatin. Cells were plated at 2.5–3.0 × 10⁵ cells/well in RPMI or DMEM containing 0.2% bovine serum albumin (BSA) in the upper compartment of the chamber with or without compound 1. Then, 10 μg/mL fibronectin as a chemoattractant was added to the lower chamber with 600 μL of DMEM/RPMI containing 0.2% BSA. After 24 h of incubation, the invading cells were fixed using a Diff-Quik kit. Afterward, the cells in the upper chamber were mechanically removed from the membrane with a cotton swab, and the cells adhering to the underside of the filter were stained and counted under a light microscope (5 fields per chamber).28
4.3.5. Migration Assay
A549, AGS, or Caco2 cells were directly seeded without coating at a density of 2 × 10⁵ cells/well in RPMI 1640/DMEM in the upper compartment of the chamber. Then, 600 μL of RPMI 1640/DMEM was added to the lower chamber to serve as a chemotactic agent. Cells were cultured with compound 1 for 24 h. The cells in five fields per chamber were counted using a Nikon Eclipse 400 fluorescence microscope and i-Solution FL Autosoftware.29
4.3.6. Soft Agar Colony Formation Assay
AGS (3 × 10³ cells), A549 (3 × 10³ cells), or Caco2 (2.5 × 10³ cells) was suspended in 1.5 mL of soft agar (0.35% soft agar solution diluted twofold with 2 × DMEM/RPMI) and plated onto 1.5 mL of solidified agar (0.5% agarose solution diluted twofold with 2 × DMEM/RPMI) in a 12-well plate and cultured for 4 weeks. The cells were fed two times per week with cell culture media, compounds (1, 2.5, and 5 μM), or DMSO. The surface areas of the colonies in five fields per well were counted using a Nikon Eclipse 400 fluorescence microscope and i-Solution FL Auto Software.29
4.3.7. Clonogenic Assay
A549, AGS, or Caco2 were seeded at a density of 500–1000 cells/well in 2.5 mL of RPMI 1640/DMEM and incubated to encourage attachment. After 48 h, the feeder was refreshed for 14 days. The plating efficiency of the untreated cells and the survival fraction of the treated cells were then determined.30
4.3.8. qPCR
Briefly, total RNA was isolated from AGS, A549, or Caco2 cells using RNAiso Plus according to the manufacturer’s instructions. Total RNA (1 μg) from each group of treated cells was converted to cDNA using a Moloney Murine Leukemia Virus (M-MLV) Reverse Transcriptase Kit and SYBR green. CFX was used for qRT-PCR reaction and analysis.31
4.3.9. Western Blots
AGS, A549, or Caco2 cells were treated with 1, 2.5, or 5 μM concentrations of compound 1 for 24 h, after which 25 μg of extracted protein was separated by applying 12% sodium dodecyl sulfate-polyacrylamide gel electrophoresis. For each sample, bands were measured by Multi-Gauge 3.029 and normalized against that of α-tubulin. Values were expressed as arbitrary densitometric units corresponding to signal intensity.32
Acknowledgments
This work was funded by National Research Foundation of Korea Grants funded by the Korean Government (Ministry of Science and ICT) (Nos. 2021R1A4A2001251 to S.-J.N.), and by Basic Science Research Program through the National Research Foundation of Korea (NRF-2020R1C1C1007832 to H.K.) and supported by Korea Basic Science Institute (National Research Facilities and Equipment Center) grant funded by the Ministry of Education (2020R 1A 6C 101B194). Isolation of the strain was a result of financial support from the US National Cancer Institute under grant CA R37044848 (to W.F.).
Supporting Information Available
The Supporting Information is available free of charge at https://pubs.acs.org/doi/10.1021/acsomega.1c04520.
1H, 13C, COSY, HSQC, HMBC, and ROESY NMR spectra and the results of a C3 Marfey’s analysis for nobilamide I (PDF)
Author Present Address
¶ Research Institute of Cell Culture, Yeungnam University, 280, Daehak-ro, Gyeongsan-si, Gyeongsangbukdo 38541, Republic of Korea
Author Present Address
◆ Laboratories of Marine New Drugs, REDONE Seoul, 5, Gasan digital 1-ro, Geumcheon-gu, Seoul 08594, Republic of Korea
Author Contributions
T.C.L., S.P., and J.L. contributed equally to this work. T.C.L. and J.L. contributed to writing the manuscript, isolation of the compounds, and elucidation of the chemical structure. S.P. performed bioassays and wrote the manuscript. G.J.K. and H.C. calculated the ECD spectra and wrote the manuscript. H.K., E.-Y.L., and P.F.H. contributed to bacterial cultivation and collecting the spectroscopic data. I.Y. and D.-C.O. contributed to NMR analysis. H.K. was the project leader guiding bioassays. S.-J.N. was the project leader guiding the chemical analysis experiments. H.K. headed the project, provided the microbial strains, and wrote the manuscript. W.F. was the project leader for chemical analysis, contributed to the microbial strain, and contributed to writing the manuscript.
The authors declare no competing financial interest.
Supplementary Material
References
- Sung H.; Ferlay J.; Siegel R. L.; Laversanne M.; Soerjomataram I.; Jemal A.; Bray F. Global Cancer Statistics 2020: GLOBOCAN Estimates of Incidence and Mortality Worldwide for 36 Cancers in 185 Countries. Ca-Cancer J. Clin. 2021, 71, 209–249. 10.3322/caac.21660. [DOI] [PubMed] [Google Scholar]
- Schiffman J. D.; Fisher P. G.; Gibbs P. Early detection of cancer: past, present, and future. Am. Soc. Clin. Oncol. Educ. Book 2015, 35, 57–65. 10.14694/EdBook_AM.2015.35.57. [DOI] [PubMed] [Google Scholar]
- Gerashchenko T. S.; Novikov N. M.; Krakhmal N. V.; Zolotaryova S. Y.; Zavyalova M. V.; Cherdyntseva N. V.; Denisov E. V.; Perelmuter V. M. Markers of Cancer Cell Invasion: Are They Good Enough?. J. Clin. Med. 2019, 8, 1092–1109. 10.3390/jcm8081092. [DOI] [PMC free article] [PubMed] [Google Scholar]
- Loh C.-Y.; Chai J. Y.; Tang T. F.; Wong W. F.; Sethi G.; Shanmugam M. K.; Chong P. P.; Looi Y. The E-Cadherin and N-Cadherin Switch in Epithelial-to-Mesenchymal Transition: Signaling, Therapeutic Implications, and Challenges. Cell 2019, 8, 1118–1150. 10.3390/cells8101118. [DOI] [PMC free article] [PubMed] [Google Scholar]
- Wahlgren J.; Maisi P.; Sorsa T.; Sutinen M.; Tervahartiala T.; Piril E.; Teronen O.; Hietanen J.; Tjderhane L.; Salo T. Expression of MMP2, MMP9, MTI-MMP, TIMP1, and TIMP2 mRNA in valvular lesions of the heart. J. Pathol. 2001, 194, 225–231. 10.1002/path.850. [DOI] [PubMed] [Google Scholar]
- Webb A. H.; Gao B. T.; Goldsmith Z. K.; Irvine A. S.; Saleh N.; Lee R. P.; Lendermon J. B.; Bheemreddy R.; Zhang Q.; Brennan R. C.; Johnson D.; Steinle J. J.; Wilson M. W.; Morales-Tirado V. M. Inhibition of MMP-2 and MMP-9 decreases cellular migration, and angiogenesis in in vitro models of retinoblastoma. BMC Cancer 2017, 17, 434–444. 10.1186/s12885-017-3418-y. [DOI] [PMC free article] [PubMed] [Google Scholar]
- Zahran E. M.; Albohy A.; Khalil A.; Ibrahim A. H.; Ahmed H. A.; El-Hoss E. M.; Bringmann G.; Abdelmohsen U. R. Bioactivity potential of marine natural products from scleractinia-associated microbes and in silico anti-sars-cov-2 evaluation. Mar. Drugs 2020, 18, 645–671. 10.3390/md18120645. [DOI] [PMC free article] [PubMed] [Google Scholar]
- Giordano D.; Costantini M.; Coppola D.; Lauritano C.; Ianora A.; Verde C. Biotechnological applications of bioactive peptides from marine sources. Adv. Microb. Physiol. 2018, 73, 171–220. 10.1016/bs.ampbs.2018.05.002. [DOI] [PubMed] [Google Scholar]
- Gogineni V.; Hamann M. T. Marine natural product peptides with therapeutic potential: chemistry, biosynthesis, and pharmacology. Biochim. Biophys. Acta 2018, 1862, 81–196. 10.1016/j.bbagen.2017.08.014. [DOI] [PMC free article] [PubMed] [Google Scholar]
- Loffet A. Peptides as Drugs: Is There a Market?. J. Peptide Sci. 2002, 8, 1–7. 10.1002/psc.366. [DOI] [PubMed] [Google Scholar]
- Lee A. C.-L.; Harris J. L.; Khanna K. K.; Hong J. H. A comprehensive review on current advances in peptide drug development and design. Int. J. Mol. Sci. 2019, 20, 2383–2403. 10.3390/ijms20102383. [DOI] [PMC free article] [PubMed] [Google Scholar]
- Chai Q. Y.; Yang Z.; Lin H. W.; Han B. N. Alkynyl-containing peptides of marine origin: a review. Mar. Drugs 2016, 14, 216–233. 10.3390/md14110216. [DOI] [PMC free article] [PubMed] [Google Scholar]
- Agrawal S.; Acharya D.; Adholeya A.; Barrow C. J.; Deshmukh S. K. Nonribosomal Peptides from Marine Microbes and Their Antimicrobial and Anticancer Potential. Front. Pharmacol. 2017, 8, 828–853. 10.3389/fphar.2017.00828. [DOI] [PMC free article] [PubMed] [Google Scholar]
- Jimenez G. M. S.; Hernandez A. B.; Brauer J. M. E. Bioactive peptides and depsipeptides with anticancer potential: sources from marine animals. Mar. Drugs 2012, 10, 963–986. 10.3390/md10050963. [DOI] [PMC free article] [PubMed] [Google Scholar]
- Rangel M.; Santana C. J. C.; Pinheiro A.; Anjos L.; Barth J.; Júnior O. R. P.; Fontes W.; Castro M. S. Marine depsipeptides as promising pharmacotherapeutic agents. Curr. Protein Pept. Sci. 2017, 18, 72–91. 10.2174/1389203717666160526122130. [DOI] [PubMed] [Google Scholar]
- Kitagaki J.; Shi G.; Miyauchi S.; Murakami S.; Yang Y. Cyclic depsipeptides as potential cancer therapeutics. Anti-Cancer Drugs 2015, 26, 259–271. 10.1097/CAD.0000000000000183. [DOI] [PubMed] [Google Scholar]
- Negi B.; Kymar D.; Rawat D. S. Marine peptides as anticancer agents: a remedy to mankind by nature. Curr. Protein. Pept. Sci. 2017, 18, 885–904. 10.2174/1389203717666160724200849. [DOI] [PubMed] [Google Scholar]
- Kitajima Y.; Waki M.; Shoji J.; Ueno T.; Ijumiya N. Revised structure of the peptide lactone antibiotic, TL-119 and/or A-3302-B. FEBS Lett. 1990, 270, 139–142. 10.1016/0014-5793(90)81253-K. [DOI] [PubMed] [Google Scholar]
- Lin Z.; Reilly C. A.; Antemano R.; Hughen R. W.; Marett L.; Concepcion G. P.; Haygood M. G.; Olivera B. M.; Light A.; Schmidt E. W. Nobilamides A-H, long-acting transient receptor potential vanilloid-1 (TRPV1) antagonists from Mollusk-associated bacteria. J. Med. Chem. 2011, 54, 3746–3755. 10.1021/jm101621u. [DOI] [PMC free article] [PubMed] [Google Scholar]
- Yamanaka K.; Reynolds K. A.; Kersten R. D.; Ryan K. S.; Gonzalez D. J.; Nizet V.; Dorrestein P. C.; Moore B. S. Direct cloning and refactoring of a silent lipopeptide biosynthetic genecluster yields the antibiotic taromycin A. Proc. Natl. Acad. Sci. U. S. A. 2014, 111, 1957–1962. 10.1073/pnas.1319584111. [DOI] [PMC free article] [PubMed] [Google Scholar]
- Maloney K. N.; MacMillan J. B.; Kauffman C. A.; Jensen P. R.; DiPasquale A. G.; Rheingold A. L.; Fenical W. Lodopyridone, a structurally unprecedented alkaloid from a marine actinomycete. Org. Lett. 2009, 23, 5422–5424. 10.1021/ol901997k. [DOI] [PMC free article] [PubMed] [Google Scholar]
- Le C. T.; Yim C. Y.; Park S. H.; Katila N.; Yang I.; Song C. M.; Yoon Y. J.; Choi D. Y.; Choi H.; Nam S.-J.; Fenical W. Lodopyridones B and C from a marine sediment-derived bacterium Saccharomonospora sp. Bioorg. Med. Chem. Lett. 2017, 27, 3123–3126. 10.1016/j.bmcl.2017.05.035. [DOI] [PubMed] [Google Scholar]
- Yim C. Y.; Le C. T.; Lee T. G.; Yang I.; Choi H.; Kang K. Y.; Lee J. S.; Lim K. M.; Yee S. T.; Kang H.; Nam S.-J.; Fenical W. Saccharomonopyrones A-C, new α-pyrones from a marine sediment-derived bacterium Saccharomonospora sp. CNQ-490. Mar. Drugs 2017, 15, 239–246. 10.3390/md15080239. [DOI] [PMC free article] [PubMed] [Google Scholar]
- Le C. T.; Lee E. J.; Lee J.; Hong A.; Yim C. Y.; Yang I.; Choi H.; Chin J.; Cho S. J.; Ko J.; Hwang H.; Nam S.-J.; Fenical W. Saccharoquinoline, a cytotoxic alkaloidal meroterpenoid from marine-derived bacterium Saccharomonospora sp. Mar. Drugs 2019, 17, 98–105. 10.3390/md17020098. [DOI] [PMC free article] [PubMed] [Google Scholar]
- Goto Y.; Okesli A.; van der Donk W. A. Mechanistic studies of Ser/Thr dehydration catalyzed by a member of the LanL lanthionine synthetase Family. Biochemistry 2011, 50, 891–898. 10.1021/bi101750r. [DOI] [PMC free article] [PubMed] [Google Scholar]
- Cabral-Pacheco G. A.; Garza-Veloz I.; Rosa C. C.-D.; Ramirez-Acuna J. M.; Perez-Romero B. A.; Guerrero-Rodriguez J. F.; Martinez-Avila N.; Martinez-Fierro M. L. The Roles of Matrix Metalloproteinases and Their Inhibitors in Human Diseases. Int. J. Mol. Sci. 2020, 21, 9739–9793. 10.3390/ijms21249739. [DOI] [PMC free article] [PubMed] [Google Scholar]
- Vijayasarathy S.; Prasad P.; Fremlin L. J.; Ratnayake R.; Salim A. A.; Khalil Z.; Capon R. J. C3 and 2D C3 Marfey’s methods for amino acid analysis in natural products. J. Nat. Prod. 2016, 79, 421–427. 10.1021/acs.jnatprod.5b01125. [DOI] [PubMed] [Google Scholar]
- Kim S.; Lee C. W.; Park S. Y.; Asolkar R. N.; Kim H.; Kim G. J.; Oh S. J.; Kim Y.; Lee E. Y.; Oh D. C.; Yang I.; Paik M. J.; Choi H.; Kim H.; Nam S.-J.; Fenical W. Acremonamide, a cyclic pentadepsipeptide with wound-healing properties isolated from a maine-derived fungus of the genus Acremonium. J. Nat. Prod. 2021, 2249. 10.1021/acs.jnatprod.1c00305. [DOI] [PubMed] [Google Scholar]
- Lee J.; Gamage C. D. B.; Kim G. J.; Hillman P. F.; Lee C.; Lee E. Y.; Choi H.; Kim H.; Nam S.-J.; Fenical W. Androsamide, a cyclic tetrapeptide from a marine Nocardiopsis sp., suppresses motility of colorectal cancer cells. J. Nat. Prod. 2020, 83, 3166–3172. 10.1021/acs.jnatprod.0c00815. [DOI] [PubMed] [Google Scholar]
- Nguyen T. T.; Yoon S.; Yang Y.; Lee H. B.; Oh S.; Jeong M. H.; Kim J. J.; Yee S. T.; Crisan F.; Moon C.; Lee K. Y.; Kim K. K.; Hur J. S.; Kim H. Lichen secondary metabolites in flavocetraria cucullata exhibit anti-cancer effects on human cancer cells through the induction of apoptosis and suppression of tumorigenic potentials. PLoS One 2014, 9, 1–14. 10.1371/journal.pone.0111575. [DOI] [PMC free article] [PubMed] [Google Scholar]
- Tas I.; Varli M.; Son Y.; Han J.; Kwak D.; Yang Y.; Zhou R.; Gamage C. D. B.; Pulat S.; Park S. Y.; Yu Y. H.; Moon K. S.; Lee K. H.; Ha H. H.; Hur J. S.; Kim H. Physciosporin suppresses mitochondrial respiration, aerobic glycolysis, and tumorigenesis in breast cancer. Phytomedicine 2021, 91, 153674–153686. 10.1016/j.phymed.2021.153674. [DOI] [PubMed] [Google Scholar]
- Yang Y.; Bae W. K.; Lee J. Y.; Choi Y. J.; Lee K. H.; Park M. S.; Yu Y. H.; Park S. Y.; Zhou R.; Tas I.; Gamage C.; Paik M. J.; Lee J. H.; Chung I. J.; Kim K. K.; Hur J. S.; Kim S. K.; Ha H. H.; Kim H. Potassium usnate, a water-soluble usnic aicd salt, shows enhanced bioavailability and inhibits invasion and metastasis in colorectal cancer. Sci. Rep. 2018, 8, 16234–16244. 10.1038/s41598-018-34709-9. [DOI] [PMC free article] [PubMed] [Google Scholar]
Associated Data
This section collects any data citations, data availability statements, or supplementary materials included in this article.


