

Abstract

Recently, the application of novel nanomaterials, especially magnetic nanomaterials in the development of latent fingerprints (LFP), has become the hot focus for forensic scientists and criminal investigators. As a type of recyclable, environment-friendly material, Fe3O4 nanoparticles achieve a wonderful effect in visualization of LFP. We first report the synthesis and encapsulation of nano-Fe3O4 through “facile coprecipitation”, (3-mercaptopropyl)triethoxysilane was covalently embedded into Fe3O4 nanoparticles, and the Fe3O4 core was encapsulated by the nanosilver to prepare novel magnetic nanomaterials (P-MNP@Ag) with the core–shell configuration. For comparison, the magnetic nanomaterials (S-MNP@Ag) were prepared by surface modification. Their composition, structure, and properties were characterized by SEM, TEM, XRD, IR, XPS, and VSM. Compared with commercially available gold powder, silver powder, bare magnetic powder, and prepared S-MNP@Ag, the development effect of LFP on different objects by using P-MNP@Ag had better performance, which presented the advantages of low background interference, high sensitivity, and clear secondary details in LFP. In the crime scenes of some influential cases, P-MNP@Ag had been applied to the visualization of LFP. The biometric identification of criminal suspects was confirmed through fingerprint comparison, which was highly affirmed by the public security department.
1. Introduction
Whenever a finger touches an object, materials on the protuberant ridges get transferred to the surface and create a fingerprint. Since the late 19th century, fingerprints have become indispensable in forensic investigations for biometric identification of individual suspects, which are regarded as the “the first evidence” in forensic science.1,2 However, in most cases, the fingerprints are invisible to the naked eye, and therefore, these latent fingerprints (LFP) are required to be developed to make them visible. Based on the visualization and analysis of LFP, not only fingerprint matching can be performed to find criminal suspects, but also the explosives and residues, drugs and their metabolites, and genetic biological information (DNA, gender, and blood type) left by the fingerprints can be obtained.3,4 Owing to the reasons above, the health status, eating habits, occupational characteristics, living environment, and other living information of the survivors, as well as the activity information before the left fingerprints, can be obtained.5,6 Therefore, the analysis of LFP is important for confirming the identity of the people involved in the case, detecting clues, and obtaining court evidence. After more than a hundred years of development, the LFP have been developed into a comprehensive application of chemistry, physics, biology, immunology, and other disciplines.7−11
Since the discovery of silver nitrate solution by French doctor Aubert in 1877,12 after more than 100 years of exploration by forensic scientists and criminal investigators, the visualization methods and techniques have been developed for LFP detection with time. These methods and techniques can be divided into the following five categories: (1) traditional techniques include iodine fumigation, silver nitrate, powder, small particle suspension reagent (SPR), vacuum coating method (VMD), tetramethylbenzidine, solution dyeing, α-ethyl cyanoacrylate (502), DFO, and nindione/ninhydrin;13,14 (2) novel materials include nanomaterials, fluorescent materials, and novel chemical fumigation;15,16 (3) spectral imaging and mass spectrometry include infrared spectroscopy imaging, Raman spectroscopy imaging, and mass spectrometry imaging;17−20 (4) electrochemical technology includes electrochromic method, scanning electrochemical microscopy, and electrochemical surface plasmon resonance spectroscopy;21−23 (5) biotechnology includes scanning Kelvin probe, immunofluorescence labeling, and aptamer-based reagent.24,25
Compared with other methods and techniques, the powder method is widely used in the criminal technology department because of its incomparable advantages such as simple preparation, convenient carrying, and low cost. Based on the specific properties of nanomaterials,26 magnetic nanomaterials have unique properties and advantages in terms of microscopic morphology, optical properties, magnetic properties, and biocompatibility. Magnetic nanomaterials have been widely applied in the visualization of LFP, which can be used as carriers for labeling, doping, and immunological binding (such as antibody–antigen) for fluorescence labeling, magnetic immobilization, and genetic information amplification (PCR), so as to detect and analyze trace evidence such as human metabolites, drugs, poisons and their metabolites, explosives, and residues in fingerprint residues. Compared with other methods and techniques, the application of magnetic nanomaterials has three advantages to develop LFP: (1) The first one is recyclability. The magnetic nanomaterials have strong magnetism. Under the action of a magnetic brush or external magnetic field, the excess reagents can be recycled and utilized, which can prevent the formation of aerosols caused by small particles from dispersing in the air, causing the secondary damage to the health of criminal investigators. (2) The second one is low DNA toxicity. The visualization of LFP at crime scenes can not only provide fingerprints but also provide biological information of the criminal suspect. Trace amounts of contact DNA can be successfully extracted after LFP were developed by magnetic nanomaterials, and then the gender and genetic information are analyzed. (3) The last one is high sensitivity. Benefiting from the small particle size, magnetic nanomaterials can clearly reflect the details of the fingerprint mastoid lines and the characteristics of sweat pores with a small amount.
In recent years, the magnetic nanomaterials have been widely used in the field of developing LFP at crime scenes and have achieved satisfactory results. There are quite a few reports on the development of LEP by magnetic nanomaterials.16,27−33 However, the usual reagents used to develop LFP are bare Fe3O4 nanoparticles, magnetic small particle suspension (SPR), magnetically doped nanomaterials, or surface-modified Fe3O4, which have the disadvantages of complicated preparation and low sensitivity. For this, we report first the synthesis of the novel nanomaterials P-MNP@Ag through “facile coprecipitation”. Meanwhile, the magnetic nanomaterials (S-MNP@Ag) were also prepared by surface modification for comparison.
2. Experimental Section
2.1. Materials and Equipment
FeCl3·6H2O (AR, 99.0%; Aladdin), FeCl2·4H2O (AR, 99.0%; Aladdin), acetate (AR, >99.7%, Aladdin), sodium citrate tribasic dihydrate (99.0%, Aladdin), AgNO3 (AR, >99.8%, Aladdin), NaBH4 (AR, >97%, Kemiou), (3-mercaptopropyl)triethoxysilane (AR, >96.0%, Sigma), ethanol (AR, 97%, Aladdin), real silver (≤500 nm, 99.9%, Aladdin), real gold (60–120 nm, 99.5%, Aladdin), hydrochloric acid, silver nitrate, sodium hydroxide, ammonia, and other reagents were purchased from Chengdu Kelon Chemical Reagent Factory. All water used was distilled water. A thermostatic magnetic stirrer (FA5L), thermostatic water bath (HH-S2, Zhengzhou Greatwall), centrifuge (TG16-WS, 21000 r/min, Hunan Xiangyi), electric thermostatic drying oven (DGH-9123A, Shanghai Jinghong), electronic balance (JT3800, Shanghai Jingtian), circulating water vacuum pump (SHB-III, Gongyi Yuhua), ultrasonic cleaner (KQ-250B, 250 W, 40 Hz, Jiangsu Kunshan), rotary evaporator (LOOYE ZX-218, Shanghai Yarong), etc., were used.
2.2. Characterizations
For scanning electron microscopy (Japan Hitachi, SU8020, 30 kV), the samples were placed on the sample table about 10–15 cm away from the evaporation source in vacuum. The plating should be uniform and observed under the microscope after spraying gold (10 kV, 60 s). For transmission electron microscopy (FEI Talos F200x), the samples were dispersed in ethanol and ultrasonicated for 10 min, then a small amount of liquid was absorbed by a rubber dropper and dropped on the duplex copper net, and the prepared samples were detected. For X-ray diffraction (Bruker D8 ADVANCE), the testing conditions for all samples were as follows: Co target; wavelength (1.79026 Å); tube current: 40 mA; tube voltage: 35 kV; scanning range: 5–90°; scanning speed: 6°/min. For infrared spectroscopy (US Nicolet iS10), the experimental samples and KBr were mixed and ground uniformly at a ratio of 1:100, 100 mg of the mixed sample was taken for tableting, and the blank KBr tablet was used as the reference collection background, which was tested at room temperature (number of scanning: 32 times). For X-ray photoelectron spectroscopy (American Thermoelectric, Thermo Escalab 250XI), the testing conditions for all samples were as follows: Al Ka (hv = 1486.6 eV); power: 150 W; beam spot: 650 μm; voltage: 14.8 kV; current: 1.6 A; charge correction using pollution carbon for correction: C1s = 284.8 eV; Ep (a constant analyzer pass energy) pass energy narrow sweep: 20 eV; wide sweep: 100 eV; vacuum degree: 1 × 10⁻¹⁰ mba. For vibrating sample magnetometry (USA, Quantum Design, SQUID-VSM, MPMS-3), the magnetization curves of the samples were measured by a vibrating sample magnetometer at room temperature (magnetic field range: ±1 T).
The experimental objects and tools are as follows: a single-lens reflex camera (Canon, 600D, used to collect LFP), a stage for visualizing fingerprints, a marker pen, three magnetic brushes, two hair brushes, magnetic powders S-MNP@Ag and P-MNP@Ag, commercially available gold powder, silver powder, and magnetic powder. Permeable objects: two sheets of paper (A4) in the same batch and two sheets of artificial leather of the same materials. Nonpermeable objects: two pieces of plastic and metal pieces of the same materials. A label was made in the stamping area of each material for later use.
2.3. Synthesis of S-MNP@Ag by Surface Modification
2.3.1. Synthesis of Nanosilver
In a three-necked round-bottom flask equipped with a condensing condenser, 1.7 mL of 1% (w/v) AgNO3 was added with 100 mL of water and heated to 120 °C for 15 min. Two milliliters of 1% (w/v) sodium citrate solution was added to the reaction solution. The solution was kept refluxing for 1 h under mechanical stirring and then cooled to room temperature for later use.34
2.3.2. Synthesis of Fe3O4
FeCl3·6H2O (2.365 g), FeCl2·4H2O (1.043 g), and distilled water (56 mL) were added into a 100 mL three-necked flask to obtain a uniform solution under stirring. After adding 2.5 mL of ammonia dropwise, a large amount of black gel appeared quickly and the reaction solution became viscous. When pH = 6.5, the isoelectric point of Fe3O4 appeared. After 15 min, the remaining 1 mL of ammonia was added dropwise to the solution until pH = 9.0 and the solution underwent continuous stirring for 30 min. After aging at 80 °C for 0.5 h, the black product was obtained after the centrifugation (10,000 r/min, 3 min) and washed with ethanol (3 × 5 mL). Finally, the dried Fe3O4 was collected after drying under vacuum at 30 °C, then ground into fine particles, and stored in a transparent sealed bag.
2.3.3. Synthesis of S-MNP
Fe3O4 (25 mg) and distilled water (36 mL, 0.83 mg/mL) were sequentially added to a 100 mL flask and ultrasonicated for 2 h. Then, 0.125 mL of (3-mercaptopropyl)triethoxysilane (MPTES) was dispersed in 5 mL of ethanol, 0.3 mL of acetate (25%) was added, and the solution was ultrasonicated in an ice water bath for 0.5 h. Afterward, the above solution was slowly added dropwise to the Fe3O4 solution and ultrasonicated in an ice water bath for 2 h. After the reaction was quenched, it was centrifuged (10,000 r/min, 3 min) and washed with ethanol (3 × 5 mL). Finally, the dried product (S-MNP) was collected after drying under vacuum at 30 °C, then ground into fine particles, and stored in a transparent sealed bag.
2.3.4. Synthesis of S-MNP@Ag
S-MNP (25 mg) was dispersed in 5 mL of distilled water, ultrasonicated for 0.5 h, and slowly added dropwise to 25 mL of nanosilver solution; after 0.5 h, 2 mL of NaBH4 (0.05 mol/L) was added and ultrasonicated for 2 h. After the reaction was quenched, it was centrifuged (3 min) and washed with ethanol (3 × 5 mL). Finally, the dried product (S-MNP@Ag) was collected after drying under vacuum at 30 °C, then ground into fine particles, and stored in a transparent sealed bag.
2.4. Synthesis of P-MNP@Ag by Facile Coprecipitation
2.4.1. Synthesis of P-MNP-0.13
NH3·H2O (0.56 mL) was drawn with a pipette in a 5 mL reaction flask, 0.13 mL MPTES was slowly added dropwise, and the solution was stirred for 0.5 h. FeCl3·6H2O (0.378 g) and FeCl2·4H2O (0.167 g) were weighed respectively into a 100 mL three-necked flask and stirred evenly until complete dissolution in 8 mL of distilled water. The hydrolyzed MPTES was quickly added dropwise to a three-necked flask until pH = 9.0, and the solution underwent continuous stirring for 30 min. After aging at 80 °C for 0.5 h, the black product was obtained after the centrifugation (10,000 r/min, 3 min) and washed with ethanol (3 × 5 mL). Finally, the dried product (P-MNP-0.13) was collected after drying under vacuum at 30 °C, then ground into fine particles, and stored in a transparent sealed bag. The added amount of MPTES was only changed to 0.043, 0.13, 0.36, and 1.08 mL, and the corresponding magnetic nanoparticles were synthesized: P-MNP-0.043, P-MNP-0.13, P-MNP-0.36, and P-MNP-1.08, respectively.
2.4.2. Synthesis of P-MNP@Ag
P-MNP-0.13 (25 mg) was dispersed in 5 mL of distilled water, ultrasonicated for 0.5 h, and slowly added dropwise to 25 mL of nanosilver solution; after 0.5 h, 2 mL of NaBH4 (0.05 mol/L) was added and ultrasonicated for 2 h. After the reaction was quenched, it was centrifuged (10,000 r/min, 3 min) and washed with ethanol (3 × 5 mL). Finally, the dried product (P-MNP@Ag) was collected after drying under vacuum at 30 °C, then ground into fine particles, and stored in a transparent sealed bag.
3. Results and Discussion
3.1. SEM Analysis
Based on surface modification, the monomer of MPTES was hydrolyzed under acidic conditions and then reacted with Fe3O4 under the guidance of a citrate ion to form Fe3O4 loaded with organosilane (S-MNP). Nanosilver could be directly and evenly loaded on its outer surface through in situ reduction based on the abundant sulfhydryl on the Fe3O4 surface. Figure 1a shows the SEM image of Fe3O4 with a particle size of about 120–150 nm that had a clean and smooth surface, where it could be seen that Fe3O4 nanoparticles had good dispersion and uniform particle size, the layer thickness of which was increased after sulfhydryl functionalization to obtain magnetic composite particles (S-MNP@Ag) (as described in Figure 1b).
Figure 1.

SEM of magnetic nanomaterials Fe3O4 (a), S-MNP@Ag (b), P-MNP-0.13 (c), and P-MNP@Ag (d).
Based on “facile coprecipitation”, the monomer of MPTES was hydrolyzed in concentrated ammonia water and then coprecipitated with Fe2+ and Fe3+ particles to form P-MNP-0.13 (Figure 1c). Subsequently, the nanosilver could be directly and evenly loaded on its outer surface through in situ reduction in a specific reaction system by means of the abundant sulfhydryl on the Fe3O4 surface and the specific reaction system. According to the experiments, P-MNP@Ag (see Figure 1d) could be obtained after wrapping P-MNP-0.13 with nanosilver (see Figure 1c), and the loading process has no effect on the morphology of the particles with the loading of silver ions.
3.2. TEM Analysis
Figure 2a shows the TEM image of bare Fe3O4 nanoparticles with a particle size of about 120–150 nm and smooth surface. It can be seen that Fe3O4 nanoparticles had good dispersion and uniform particle size. After hydrolyzed silicone coating and nanosilver loading, the magnetic nanoparticles P-MNP@Ag were obtained with a layer thickness of about 5 nm (see Figure 2b), but this loading process had no effect on the morphology and dispersion of nanoparticles. Figure 2c,d shows that the dispersion of magnetic nanoparticles (P-MNP-0.13 and P-MNP@Ag) was good. The initial particle size was 15 nm. After loading the nanosilver particles, the particle size of P-MNP@Ag increased by about 2 nm.
Figure 2.

TEM of magnetic nanomaterials Fe3O4 (a), S-MNP@Ag (b), P-MNP-0.13 (c), and P-MNP@Ag (d).
The core–shell structure of P-MNP@Ag was further confirmed by STEM analysis (see Figure 3a–f). Scanning mapping analysis of the element surface showed that blue and green dots (see Figure 3c,d) representing iron and oxygen elements were concentrated in the center with smooth edges, which indicates that Fe3O4 was mainly distributed in the nucleus. The purple dots (see Figure 3e), which represent sulfur, showed the presence of a sulfhydryl-functionalized silicone layer. Cyan dots (see Figure 3f), which represent the silver element, had a higher distribution density around the particles than in the center, so it was determined that the silver element is mainly distributed in the shell. The results of the above discussion showed that a type of core–shell particle with Fe3O4 as the core and the silicone layer as the shell loaded with Ag particles were successfully prepared.
Figure 3.
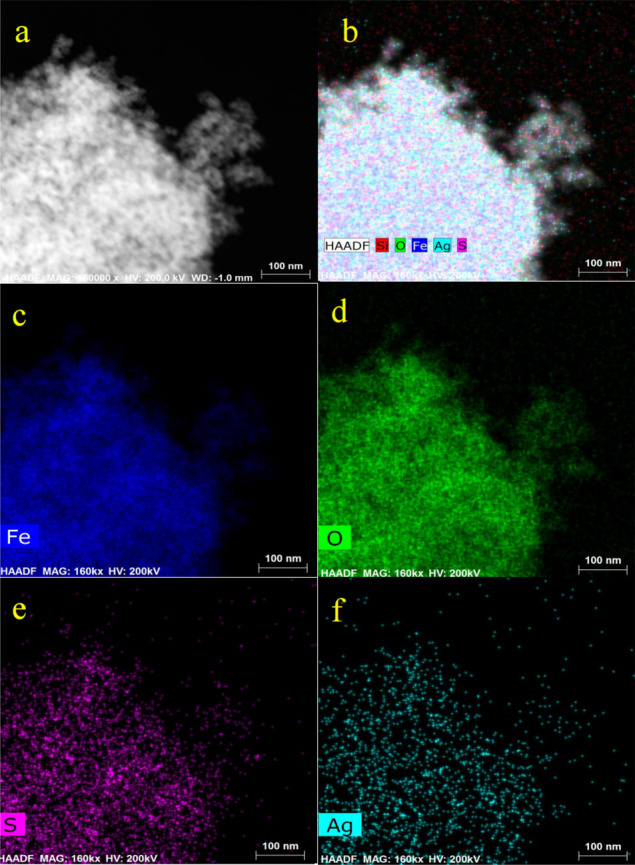
STEM images of magnetic nanomaterials P-MNP@Ag (a), scanning mapping of Fe, O, S, Ag, and Si elements (b), and scanning mapping of Fe elements (c), O elements (d), S elements (e), and Ag elements (f). Scale bars are 100 nm.
3.3. XRD Analysis
Figure 4 shows the high-angle X-ray diffraction of Fe3O4 nanoparticles, Ag, S-MNP, S-MNP@Ag, P-MNP-0.13, and P-MNP@Ag. Corresponding to the crystal faces of Fe3O4, {220, d = 3.44 Å}, {311, d = 2.94 Å}, {400, d = 2.44 Å}, {422, d = 1.99 Å}, {511, d = 1.87 Å}, {440, d = 1.72 Å}, and {533, d = 1.48 Å}, X-ray diffraction of Fe3O4 (2θ = 21.3°, 35.1°, 41.5°, 50.6°, 63.2°, 67.3°, and 74.4°) has seven typical peaks, which was basically consistent with the JDPS of the trans cubic spinel structure of standard Fe3O4. The single phase and sharp peak shape indicate perfect crystallization.35 There are four typical peaks at 2θ = 38.3°, 44.5°, 64.6°, and 77.6° in the X-ray diffraction of silver corresponding to four crystal faces, {111}, {200}, {220}, and {311}. Only when 2θ = 44.5° in the XRD of S-MNP@Ag and P-MNP@Ag, the corresponding peak {200} was more obvious, indicating that their surface was coated with nanosilver, but the amount was much less than Fe3O4 particles. This result was consistent with the measurement of XPS.
Figure 4.

High-angle X-ray diffraction of magnetic nanomaterials (Fe3O4, Ag, S-MNP, S-MNP@Ag, P-MNP-0.13, and P-MNP@Ag).
These characteristic peaks also reflected the preparation on S-MNP and S-MNP@Ag by surface modification, and MPTES only interacted with the surface of Fe3O4 nanoparticles but did not affect the lattice structures. P-MNP and P-MNP@Ag prepared by “facile coprecipitation” basically matched the characteristic diffraction peaks of Fe3O4. However, P-MNP and P-MNP@Ag showed characteristic peaks (220, 311, 400, 511, and 440) with a relatively broad range and weakened intensity, indicating that they have similar inverse spinel structures.
The diffraction absorption peaks of P-MNP-0.043, P-MNP-0.13, P-MNP-0.36, and P-MNP-1.08 are described in Figure 5. Some characteristic diffraction peaks (220, 400, and 511) of P-MNP-1.08 disappeared with the addition of MPTES from 0.043 mg to 1.08 mg; meanwhile, the relative intensity of all absorption peaks was significantly weakened. The participation of MPTES through the interactions of covalent bonds led to the enhancement of the amorphous nature of P-MNP-1.08. According to XRD, the excessive amount of MPTES was added, the magnetic crystal structure would be severely damaged, and the saturation magnetic susceptibility of the magnetic nanomaterials would be reduced.
Figure 5.

High-angle X-ray diffraction of magnetic nanomaterials (P-MNP-0.043, P-MNP-0.13, P-MNP-0.36, and P-MNP-1.08).
3.4. Infrared Spectroscopy (IR) Analysis
The functional groups of substances could be analyzed by infrared spectroscopy, confirming whether Fe3O4 has completed sulfhydrylization. It could be observed that the broad and large absorption peak at 3421 cm–1 was attributed to the stretching vibration of the S–H bond of MPTES after hydrolysis (Figure 6), 2922 cm–1 was attributed to the methylene C–H bond, 1623 cm–1 was the absorption peak of S–H bond bending vibration, and 570 cm–1 was the absorption peak of Fe–O bond stretching vibration in the Fe3O4 crystal. Compared with Fe3O4 particles, the infrared spectroscopy of all magnetic nanomaterials prepared by surface modification (S-MNP and S-MNP@Ag) and facile coprecipitation (P-MNP-0.13 and P-MNP@Ag) all had absorption peaks at 3421, 2922, and 1623 cm–1, which indicated that these samples were successfully sulfhydrylized.
Figure 6.

IR of magnetic nanomaterials (Fe3O4, S-MNP, S-MNP@Ag, P-MNP-0.13, and P-MNP@Ag).
The infrared spectroscopy of magnetic nanomaterials (P-MNP-0.043,P-MNP-0.13, P-MNP-0.36, and P-MNP-1.08) had the same absorption peaks at 3421, 2922, and 1623 cm–1, which showed that these samples were successfully sulfhydrylized (see Figure 7). However, the intensity of the 570 cm–1 absorption peak decreased, as the amount of MPTES increased. It showed that the continuous addition of MPTES in the preparation process of “facile coprecipitation” weakened the formation of the Fe–O bond in the crystals. The addition of 0.13 mL of MPTES was optimal by the comprehensive consideration of silver loading and magnetism.
Figure 7.
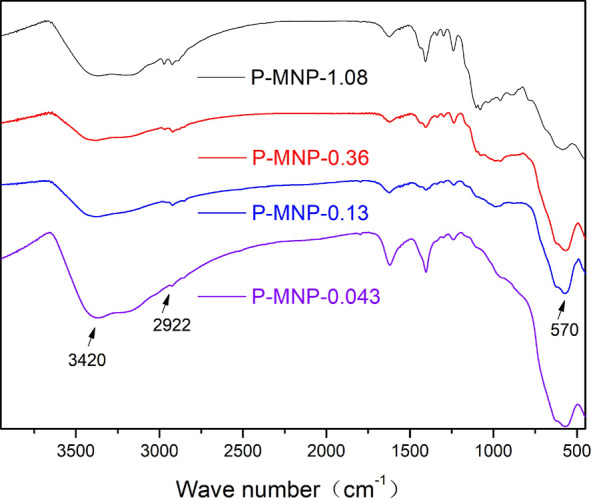
IR of magnetic nanomaterials (P-MNP-0.043, P-MNP-0.13, P-MNP-0.36, and P-MNP-1.08).
3.5. XPS Analysis
The surface composition of the prepared magnetic nanomaterials was analyzed by XPS, and the relevant results are shown in Figure 8 and Table 1. For S-MNP and S-MNP@Ag prepared by surface modification or P-MNP-0.13 and P-MNP@Ag prepared by facile coprecipitation, Fe2p could also be observed from the enlarged view of Fe2p, which was consistent with the standard of Fe3O4 (Fe2p: 710.4 eV). It indicated that the core structure of these nanomaterials has not changed. The Fe2p value could be obtained from the partially enlarged view of Fe2p in Figure 8.
Figure 8.

XPS of magnetic nanomaterials (Fe3O4, S-MNP, S-MNP@Ag, P-MNP-0.13, and P-MNP@Ag).
Table 1. Elemental Content Distribution (XPS) of Magnetic Nanomaterials.
| atomic
% |
|||||
|---|---|---|---|---|---|
| element | Fe3O4 | S-MNP | P-MNP-0.13 | S-MNP@Ag | P-MNP@Ag |
| Si2p | 2.83 | 6.56 | 5.52 | 3.43 | 8.45 |
| S2p | 0.61 | 4.79 | 2.86 | 0.99 | 6.08 |
| C1s | 36.93 | 29.66 | 23.31 | 55.05 | 27.15 |
| Ag3d | 0.45 | 1.28 | |||
| O1s | 40.58 | 42.6 | 44.95 | 33.09 | 42.64 |
| Fe2p | 19.04 | 16.4 | 23.36 | 6.99 | 14.4 |
After sulfhydrylization with MPTES, the XPS of the samples (S-MNP, S-MNP@Ag, P-MNP-0.13, and P-MNP@Ag) showed S2p (163.3 eV) and Si2p (102.4 eV) peaks, which were consistent with the standard binding energy of alkane sulfhydryl S2p (reference value: 163.8 eV) and siloxane Si2p (reference value: 102.0 eV), indicating that Fe3O4 particles had been encapsulated by sulfhydryl groups.36 The XPS of S-MNP@Ag and P-MNP@Ag showed Ag3d (368.2 eV) peaks, which confirmed that the two types of magnetic particles successfully covered a layer of silver particles after sulfhydrylization. In addition, the intensity of the Fe2p absorption peak (710.7 eV) in the XPS of the sulfhydrylized magnetic nanoparticles was weaker than that of the Fe3O4 particles because the surface of the magnetic particles was sulfhydrylized to form spherical silver particles. The particle size of S-MNP@Ag and P-MNP@Ag was increased after being wrapped by silver particles, which was consistent with the results of SEM (see Figure 1). Compared with S-MNP@Ag, the XPS of P-MNP@Ag had weaker absorption peaks at S2p (163.3 eV) and S2s (227.3 eV), and the content was lower, which is caused by the decomposition of the S element.
The element content distribution of magnetic nanomaterials Fe3O4, S-MNP, S-MNP@Ag, P-MNP-0.13, and P-MNP@Ag is shown in Table 1. The data processed from XPS could be seen as follows: (1) After successful sulfhydrylization, the sulfur contents of S-MNP and P-MNP-0.13 were 4.79 and 2.86%, respectively. (2) After S-MNP and P-MNP-0.13 were wrapped by silver particles, S-MNP@Ag and P-MNP@Ag had silver contents of 0.45 and 1.28%, respectively. It was proved that the silver particles were successfully encapsulated on S-MNP and P-MNP-0.13 by binding sulfhydryl groups.
3.6. VSM Analysis
The samples (P-MNP@Ag, P-MNP-0.043, P-MNP-0.13, P-MNP-0.36, and P-MNP-1.08) were superparamagnetic particles with high permeability, low coercivity, and zero remanence, while the other samples (Fe3O4, S-MNP, and S-MNP@Ag) still had a small amount of remanence (see Figures 9 and 10 and Table 2). After sulfhydrylization and silver coating, the saturation magnetic susceptibility (Ms) values of S-MNP@Ag (prepared by surface modification) and P-MNP@Ag (facile coprecipitation) were decreased from 82.2 and 49.4 emu/g to 77.4 and 39.5 emu/g, respectively. Obviously, the latter declined more especially. Even so, the magnetism of P-MNP@Ag was still strong enough to realize the rapid recovery of magnetic particles under the external magnet adsorption (see Figure 11).
Figure 9.

Magnetization curves of magnetic nanomaterials (Fe3O4, S-MNP, S-MNP@Ag, P-MNP-0.13, and P-MNP@Ag).
Figure 10.

Magnetization curves of magnetic nanomaterials (P-MNP-0.043, P-MNP-0.13, P-MNP-0.36, and P-MNP-1.08).
Table 2. Saturation Magnetic Susceptibility (Ms) of Different Magnetic Materials.
| material | Fe3O4 | S-MNP | S-MNP@Ag | P-MNP@Ag | P-MNP-0.043 | P-MNP-0.13 | P-MNP-0.36 | P-MNP-1.08 |
|---|---|---|---|---|---|---|---|---|
| Ms | 82.2 | 78.9 | 77.4 | 39.5 | 56.8 | 49.4 | 43.6 | 10.3 |
Figure 11.

Dispersion of magnetic nanoparticles (P-MNP@Ag) without a magnetic field (a) and under an external magnet (b).
The saturation magnetic susceptibility of the magnetic nanomaterials (56.8, 49.4, 43.6, and 10.3 emu/g) decreased gradually with the increase in the amount of MPTES. Taking into account the MPTES loading capacity and high saturation magnetic susceptibility of the magnetic materials, the optimal addition amount of MPTES was 0.13 mL, which was also confirmed by the XRD characterization.
3.7. Application of Magnetic Nanomaterials
3.7.1. Simulated Imprinting of LFP
Not only the temperature and humidity of the environment should be considered but the proper particle size, loose and dry characteristics, strong adhesion, proper specific gravity and penetration, and certain contrast between the color and the background of powders should also be considered when latent fingerprints (LFP) were developed by the magnetic nanomaterial. Meanwhile, it was necessary to analyze the characteristics (such as the remaining time of LFP and the amount and nature of the medium substance in the formation of LFP) to achieve the best visualization effect. The different objects were designed to test the performance, sensitivity, and universality of the magnetic nanomaterial. In general, there are two types of objects of LFP in the experiment that often appeared in crime scenes as follows: (1) permeable objects such as various paper (filter paper, weighing paper, and copy paper), artificial leather, etc.; (2) nonpermeable objects such as metal (doorknobs, railings, and enclosures of domestic appliances), ceramics (bowls and water cups), plastic (beverage bottles and wash basins), etc.
After washing hands and drying them naturally, the volunteer lightly touched his foreheads with fingers and then printed fingerprints on various objects (metal, plastic, paper, and leather) with appropriate strength, and these objects were stored properly at room temperature (20 °C). It should be noted that all LFP of objects were collected from the same volunteer, and the printing pressure was kept even and consistent to avoid the impact of the printing process on visualizing fingerprints. After printing, the LFP on the surface of various objects were visualized by the powders, and the digital camera was used to photograph and fix the visualizing fingerprints (see Figure 12).
Figure 12.

Schematic of the LFP detection step.
3.7.2. Visualizing Effect of Magnetic Nanomaterials on LFP
In the experiment, the commercially available bare magnetic powder, silver, gold, real silver, and real gold were commonly used at crime scenes by the police and the magnetic nanomaterials S-MNP@Ag and P-MNP@Ag were selected as comparison to detect their fingerprint effects.
Twenty-five milligrams of bare magnetic powders, S-MNP@Ag, and P-MNP@Ag was weighed respectively. They are completely adsorbed on the magnetic brush, and then even pressure was applied to the labels of paper, transparent plastic, and metal plate with slow brushing to make the powders uniformly cover the LFP. Twenty-five milligrams of silver, gold, real silver, and real gold was weighed respectively, the brush was gently rotated on the powder until it adhered to the brush, and then the LFP of objects were developed after slow brushing. All the excess powders were recovered when clear fingerprints were visualized (see Figures 13–15).
Figure 13.

Comparison of visualization of LFP of magnetic nanomaterials (P-MNP@Ag (a), S-MNP@Ag (b), silver (c), gold (d), real silver (e), and real gold (f)) on paper.
Figure 15.

Comparison of visualization of LFP of magnetic nanomaterials (P-MNP@Ag (a), S-MNP@Ag (b), silver (c), gold (d), real silver (e) and real gold (f)) on metal.
Figure 14.

Comparison of visualization of LFP of magnetic nanomaterials (P-MNP@Ag (a), S-MNP@Ag (b), silver (c), gold (d), real silver (e), and real gold (f)) on plastic.
From three sets of visualization of LFP as above, the magnetic nanoparticles (P-MNP@Ag and S-MNP@Ag) had a better development effect than other powders on plastic and paper. Due to the large particles of S-MNP@Ag, the nanoparticles were excessively accumulated in some small furrows, resulting in the visualization of LFP by S-MNP@Ag being partially blurred. Compared with S-MNP@Ag, gold powder, silver powder, P-MNP@Ag, real silver, and real gold had clearer development of LFP on metal. Also, it showed excellent results on a smooth metal plate such as thick fingerprints, smooth detailed lines, obvious secondary fingerprint details, and stability.
The bare magnetic powder is not effective in developing LFP on leather owing to the large micropores of leather. Surprisingly, the development effect of P-MNP@Ag and S-MNP@Ag was better than that of the bare magnetic powder, as shown in Figure 16. The experimental results showed that the nanoparticles were excessively accumulated in some small furrows due to the large particles of S-MNP@Ag, resulting in the visualization of LFP by S-MNP@Ag being partially blurred. Thus, the development effect was still not as good as P-MNP@Ag.
Figure 16.

Comparison of visualization of LFP of magnetic nanomaterials (P-MNP@Ag (a), S-MNP@Ag (b), and magnetic powder (c)) on leather.
3.7.3. Analysis of the Effect Level of Magnetic Nanomaterials
Herein, the development effect and sensitivity were quantified to evaluate the identification value of LFP by magnetic nanomaterials. Generally, the development effect of LFP on objects was much worse than that of gold powder and silver powder due to the small specific surface area and weak surface adsorption of commercially available bare magnetic powders.
It could be seen from Figures 13–16 and Table 3 the comparison chart of the effect of LFP developed by P-MNP@Ag, S-MNP@Ag, silver, gold, real silver, and real gold. It can be clearly found that the magnetic nanoparticles (P-MNP@Ag, S-MNP@Ag, real silver, and real gold) had a better visualization of LFP on permeable objects (paper and leather) or nonpermeable objects (plastic and metal) with a clear texture, smooth lines, and obvious minutiae characteristics than the gold and silver powders. Simultaneously, P-MNP@Ag performs better than S-MNP@Ag to develop LFP on plastic and leather.
Table 3. Effect of LFP Developed by Different Powders on Obvious Objectsa.
| powder |
||||
|---|---|---|---|---|
| object | P-MNP@Ag | S-MNP@Ag | silver powder | gold powder |
| metal | +++ | +++ | +++ | +++ |
| paper | +++ | +++ | + | ++ |
| plastic | +++ | ++ | + | ++ |
| leather | ++ | ++ | + | + |
The development effect is divided into five levels: “++++”, too thick to have an appraisal value; “+++”, excellent and with an appraisal value; “++”, qualified but with an appraisal value; “+”, developing LFP and no appraisal value; “–”, unable to develop LFP.
From Table 4, the novel magnetic nanomaterials P-MNP@Ag only consume 25 mg to clearly develop LFP with an appraisal value and high sensitivity on permeable objects (paper and leather) and nonpermeable objects (plastic and metal) to improve the efficiency of the investigation. More importantly, the excess powder could be recovered through the magnetic brush with true environmental friendliness to avoid harm to the health of investigators. Thus, it could be seen that P-MNP@Ag had the advantages of good dispersion, uniform adhesion, clear texture of the visualization of LFP, environmental protection, and recyclability.
Table 4. Effect of LFP Developed by Different Dosage of P-MNP@Ag on Obvious Objects.
| amount |
||||
|---|---|---|---|---|
| object | 5 mg | 25 mg | 125 mg | 625 mg |
| metal | ++ | +++ | +++ | ++++ |
| paper | ++ | +++ | ++++ | ++++ |
| plastic | ++ | +++ | +++ | ++++ |
| leather | ++ | ++ | +++ | ++++ |
A three-level trace level was used to quantify the sensitivity of LFP detection. The clear visibility of the deposited LFP was facilitated to acquire level 1 (whorl ridge pattern), level 2 (information on core, bifurcation, delta, bridge, hook, termination, island, short ridge, and crossover), and level 3 (information on sweat pores and scar) information (Figure 17). It provided clear, long-lasting, well-resolved ridge patterns on glass slides, which are very essential for individual identification in dealing forensic crimes.
Figure 17.

Images of LFP with P-MNP@Ag under sunlight illumination showing the following: (A) primary level details (a–d); (B) secondary level details (minutiae): (1) core, (2) bifurcation, (3) delta, (4) bridge, (5) hook, (6) termination, (7) island, (8) short ridge, and (9) crossover; (C) tertiary level details: (10) sweat pores and (11) scar.
Usually, the gold powder, silver powder, and magnetic powder mentioned in the article are often used by the police in developing LFP, but the composition of “gold powder” is not gold particles but alloy powder made of copper, zinc, tin, and antimony. The composition of “silver powder” is not silver but aluminum particles. Gold powder and silver powder are suitable for developing LFP on smooth and impermeable surfaces. However, the adhesion of magnetic powder to LFP is weaker than that of “gold powder” and “silver powder”, but it overcomes the shortcomings that ordinary powders are easy to fly and paste to the bottom of LFP. When used with a magnetic brush, it is safer and more environmentally friendly than “gold powder” and “silver powder”. The real silver particles, which are wrapped on the surface of Fe3O4, are easier to adsorb with the surface of objects when compared with them. As a novel type of bifunctional nanomaterial, the merits of using P-MNP@Ag are not only environmental friendliness and recyclability but also strong adsorption on the surface of objects, which avoids pasting to the bottom of LFP and improves the sensitivity of LFP analysis. It leads to the finding that the performance of MNP@Ag is better than that of conventional materials. In addition, compared of real gold and silver nanoparticles, the application cost of MNP@Ag is cheaper.
3.8. The Visualization of LFP at Crime Scenes
P-MNP@Ag had an excellent development effect of LFP on different objects (permeability and impermeability). It was not only used to develop the simulated LFP but also provided to the police to develop LFP at crime scenes. Compared with other commercially available powders, P-MNP@Ag presented the advantages of low background interference, high sensitivity, and clear secondary details in LFP at crime scenes, which can meet the requirements of the police criminal investigators for developing LFP. The fingerprint evidence obtained by novel nanomaterials could greatly shorten the detection time and play a positive role in the case closure. Thus, the research of this paper was highly praised by the Criminal Technology Division of Zhengzhou Railway Public Security Bureau and the Criminal Technology Detachment of Luoyang Railway Public Security Division.
4. Conclusions
In this study, novel magnetic nanomaterials P-MNP@Ag with a core–shell configuration were prepared by “facile coprecipitation”, while S-MNP@Ag was prepared by surface modification for comparison. The composition, structure, and properties of the above materials were characterized by SEM, TEM, XRD, IR, XPS, and VSM. P-MNP@Ag was a novel type of superparamagnetic particle with a trans cubic spinel structure, high magnetic permeability, low coercivity, and zero remanence. It had the advantages of small size, good dispersibility, strong adsorption capacity, strong magnetism, and recyclability. Compared with commercially available silver, gold, bare magnetic powder, real silver, real gold, and prepared S-MNP@Ag, the development effect of LFP on objects by using P-MNP@Ag had better performance: uniform addition and no fuzzy fingerprint lines caused by powder accumulation, which presented the advantages of low background interference, high sensitivity, and clear secondary details in LFP. In the crime scenes of some influential cases, the novel magnetic nanomaterials P-MNP@Ag had been applied to the visualization of LFP, and the identification of criminal suspects was confirmed through fingerprint comparison, which was highly affirmed by the public security department and had a good prospect for practical application.
Acknowledgments
This work is financially supported by National Natural Science Foundation of China (no. 21805208), Science and Technology Department of Henan Province (nos. 17210221012 and 182102210118), and Key Scientific Research Project of Colleges and Universities in Henan Province (nos. 22A620003 and 20A520033).
The authors declare no competing financial interest.
References
- Van Dam A.; Van Beek F. T.; Aalders M. C. G.; Van Leeuwen T. G.; Lambrechts S. A. G. Techniques that acquire donor profiling information from fingermarks—A review. Sci. Justice. 2015, 2, 143–154. 10.1016/j.scijus.2015.12.002. [DOI] [PubMed] [Google Scholar]
- Hazarika P.; Russell D. A. Advances in fingerprint analysis. Angew. Chem., Int. Ed. 2012, 51, 3524–3531. 10.1002/anie.201104313. [DOI] [PubMed] [Google Scholar]
- Dong X.; Niu X.; Zhang Z.; Wei J.; Xiong H. Red Fluorescent carbon dot powder for accurate latent fingerprint identification using an artificial intelligence program. ACS Appl. Mater. Interfaces 2020, 12, 29549–29555. 10.1021/acsami.0c01972. [DOI] [PubMed] [Google Scholar]
- Leggett R.; Lee-Smith E. E.; Jickells S. M.; Russell D. A. “Intelligent” fingerprinting: Simultaneous identification of drug metabolites and individuals by using antibody-functionalized nanoparticles. Angew. Chem., Int. Ed. 2007, 22, 4100–4103. 10.1002/anie.200700217. [DOI] [PubMed] [Google Scholar]
- Hazarika P.; Jickells S. M.; Wolff K.; Russell D. A. Imaging of latent fingerprints through the detection of drugs and metabolites. Angew. Chem., Int. Ed. 2008, 47, 10167–10170. 10.1002/anie.200804348. [DOI] [PubMed] [Google Scholar]
- Wolfbeis O. S. Nanoparticle-enhanced fluorescence imaging of latent fingerprints reveals drug abuse. Angew. Chem., Int. Ed. 2009, 13, 2268–2269. 10.1002/anie.200805765. [DOI] [PubMed] [Google Scholar]
- Alcaraz-Fossoul J. D.; Li S. Evaluation of an inkless method for fingerprint recordings using hand sanitizer gel on thermal paper. Forensic Sci Int. 2021, 323, 110787–110795. 10.1016/j.forsciint.2021.110787. [DOI] [PubMed] [Google Scholar]
- Bradshaw R.; Bleay S.; Clench M. R. Direct detection of blood in fingermarks by MALDI-MS profiling and Imaging. Sci. Justice. 2014, 2, 110–117. 10.1016/j.scijus.2013.12.004. [DOI] [PubMed] [Google Scholar]
- Peng D.; He S.; Zhang Y.; Yao L.; Nie W.; Liao Z.; Cai W.; Ye X. Blue light-induced rare-earth free phosphors for the highly sensitive and selective imaging of latent fingerprints based on enhanced hydrophobic interaction. J. Materiomics. 2021, xxx. 10.1016/j.jmat.2021.03.005. [DOI] [Google Scholar]
- Saif M.; Shebl M.; Nabeel A. I.; Shokry R.; Hafez H.; Mbarek A.; Damak K.; Maalej R.; Abdel-Mottaleb M. S. A. Novel non-toxic and red luminescent sensor based on Eu3+:Y2Ti2O7/SiO2 nano-powder for latent fingerprint detection. Sens. Actuators, B 2015, 220, 162–170. 10.1016/j.snb.2015.05.040. [DOI] [Google Scholar]
- Jenie A. S. N.; Krismastuti F. S. H.; Ningrum Y. P.; Kristiani A.; Yuniati M. D.; Astuti W.; Petrus H. T. B. M. Geothermal silica-based fluorescent nanoparticles for the visualization of latent fingerprints. Mater. Express. 2020, 2, 258–266. 10.1166/mex.2020.1551. [DOI] [Google Scholar]
- Ma A.Fingerprint techniques; Chilton Book Co: New York, 1971, 1–75. [Google Scholar]
- Fan Z.; Zhang C.; Chen J.; Ma R. Nondestructive, and Simple Visualization of Latent Blood Fingerprints Based on Covalent Bonding Between the Fluorescent Conjugated Polymer and Proteins in Blood. ACS Appl. Mater. Interfaces 2021, 13, 15621–15632. [DOI] [PubMed] [Google Scholar]
- Sodhi G. S.; Kaur J. Powder method for detecting latent fingerprints: a review. Forensic Sci. Int. 2001, 3, 172–176. 10.1016/S0379-0738(00)00465-5. [DOI] [PubMed] [Google Scholar]
- Downham R. P.; Sears V. G.; Hussey L.; Chu B. S.; Jones B. J. Fingermark visualisation with iron oxide powder suspension: the variable effectiveness of iron (II/III) oxide powders, and Tween® 20 as an alternative to TritonTM X-100. Forensic Sci. Int. 2018, 292, 190–203. 10.1016/j.forsciint.2018.09.012. [DOI] [PubMed] [Google Scholar]
- Yang Y.; Liu R.; Cui Q.; Xu W.; Peng R.; Wang J.; Li L. Red-emissive conjugated oligomer/silica hybrid nanoparticles with high affinity and application for latent fingerprint detection. Colloids Surf., A 2019, 565, 118–130. 10.1016/j.colsurfa.2019.01.009. [DOI] [Google Scholar]
- Ronnie Ng P. H.; Walker S.; Tahtouh M.; Reedy B. Detection of illicit substances in fingerprints by infrared spectral imaging. Anal. Bioanal. Chem. 2009, 394, 2039–2048. 10.1007/s00216-009-2806-9. [DOI] [PubMed] [Google Scholar]
- Song W.; Mao Z.; Liu X.; Lu Y.; Li Z.; Zhao B.; Lu L. Detection of protein deposition within latent fingerprints by surface-enhanced Raman spectroscopy imaging. Nanoscale 2012, 7, 2333–2338. 10.1039/C2NR12030E. [DOI] [PubMed] [Google Scholar]
- Ifa D. R.; Manicke N. E.; Dill A. L.; Cooks R. G. Latent fingerprint chemical imaging by mass spectrometry. Science 2008, 321, 805. 10.1126/science.1157199. [DOI] [PubMed] [Google Scholar]
- Li K.; Qin W.; Li F.; Zhao X.; Jiang B.; Wang K.; Deng S.; Fan C.; Li D. Nanoplasmonic Imaging of Latent Fingerprints and Identification of Cocaine. Angew. Chem., Int. Ed. 2013, 44, 11542–11545. 10.1002/ange.201305980. [DOI] [PubMed] [Google Scholar]
- Xu L.; Li Y.; Wu S.; Liu X.; Su B. Imaging Latent Fingerprints by Electrochemiluminescence. Angew. Chem., Int. Ed. 2012, 51, 8068–8072. 10.1002/anie.201203815. [DOI] [PubMed] [Google Scholar]
- Zhang M.; Girault H. H. SECM for imaging and detection of latent fifingerprints. Analyst 2009, 134, 25–30. 10.1039/B815336A. [DOI] [PubMed] [Google Scholar]
- Shan X.; Patel U.; Wang S.; Iglesias R.; Tao N. Imaging local electrochemical current via surface plasmon resonance. Science 2010, 5971, 1363–1366. 10.1126/science.1186476. [DOI] [PubMed] [Google Scholar]
- Arivalagan S.; Panja S. K.; Nandi G. C. Applications of Carbon Dots (CDs) in Latent Fingerprints Imaging. Chem. – Asian J. 2021, 16, 1057–1072. 10.1002/asia.202100119. [DOI] [PubMed] [Google Scholar]
- Wood M.; Maynard P.; Spindler X.; Lennard C.; Roux C. Visualization of Latent Fingermarks Using an Aptamer-Based Reagent. Angew. Chem., Int. Ed. 2012, 49, 12272–12274. 10.1002/ange.201207394. [DOI] [PubMed] [Google Scholar]
- Mulvaney P. Surface plasmon spectroscopy of nanosized metal particles. Langmuir 1996, 12, 788–800. 10.1021/la9502711. [DOI] [Google Scholar]
- Shilpa C. J.; Basavaraj R. B.; Darshan G. P.; Premkumar H. B.; Sharma S. C.; Nagabhushana H. New insights into the rapid deposition and visualization of latent fingerprints: Cyan light emitting GdAlO3:Ce3+ nano fluorescent probe. J. Photochem. Photobiol., A 2019, 376, 288–304. 10.1016/j.jphotochem.2019.02.027. [DOI] [Google Scholar]
- Jung H. S.; Cho K. J.; Ryu S. J.; Takagi Y.; Roche P. A.; Neuman K. C. Biocompatible fluorescent nanodiamonds as multifunctional optical probes for latent fingerprint detection. ACS Appl. Mater. Interfaces 2020, 12, 6641–6650. 10.1021/acsami.9b19245. [DOI] [PMC free article] [PubMed] [Google Scholar]
- Moret S.; Scott E.; Barone A.; Liang K.; Lennard C.; Roux C.; Spindler X. Metal-organic frameworks for fingermark detection-A feasibility study. Forensic Sci. Int. 2018, 291, 83–93. 10.1016/j.forsciint.2018.08.005. [DOI] [PubMed] [Google Scholar]
- Wang Z.; Jiang X.; Liu W.; Huang X. A rapid and operator-safe powder approach for latent fingerprint detection using hydrophilic Fe3O4@SiO2-CdTe nanoparticles. Sci. China: Chem. 2019, 7, 889–896. [Google Scholar]
- Prabakaran E.; Pillay K. Nanomaterials for latent fingerprint detection: a review. J Mater Res Technol. 2021, 12, 1856–1885. 10.1016/j.jmrt.2021.03.110. [DOI] [Google Scholar]
- Huang R.; Liu R. Efficient in situ growth of platinum nanoclusters on the surface of Fe3O4 for the detection of latent fingermarks. J. Mater. Sci. 2017, 23, 13455–13465. 10.1007/s10853-017-1475-x. [DOI] [Google Scholar]
- Mobaraki A.; Hosseinzadeh Z.; Yavari I. Lipophilic magnetic nanocomposite of Fe3O4@SiO2@Me for efficient visualization of latent fingerprints on various surfaces. J. Iran. Chem. Soc. 2019, 16, 1601–1610. 10.1007/s13738-019-01636-z. [DOI] [Google Scholar]
- Wan Y.; Guo Z.; Jiang X.; Fang K.; Lu X.; Zhang Y.; Gu N. Quasi-spherical silver nanoparticles: Aqueous synthesis and size control by the seed-mediated Lee–Meisel method. J. Colloid Interface Sci. 2013, 39, 263–268. 10.1016/j.jcis.2012.12.037. [DOI] [PubMed] [Google Scholar]
- Wan J.; Ding L.; Wu T.; Ma X.; Tang Q. Facile one-pot fabrication of magnetic nanoparticles (MNPs)-supported organocatalysts using phosphonate as an anchor point through direct co-precipitation method. RSC Adv. 2014, 4, 38323–38333. 10.1039/C4RA04720F. [DOI] [Google Scholar]
- He Q.; Wu W.; Yang Y.; Zhang J.; Wang J. Q. Preparation and Characterization of Surface Thiolated Magnetite Nanoparticles. Fine Chem. Intermediates. 2007, 37, 63–67. [Google Scholar]