Abstract
Background
Mining gene regulatory network (GRN) is an important avenue for addressing cancer mechanism. Mutations in cancer genome perturb GRN and cause a rewiring in an orchestrated network. Hence, the exploration of gene regulatory network rewiring is significant to discover potential biomarkers and indicators for discriminating cancer phenotypes.
Results
Here, we propose a new bioinformatics method of identifying biomarkers based on network rewiring in different states. It firstly reconstructs GRN in different phenotypic conditions from gene expression data with a priori background network. We employ the algorithm based on path consistency algorithm and conditional mutual information to delete false-positive regulatory interactions between independent nodes/genes or not closely related gene pairs. And then a differential gene regulatory network (D-GRN) is constructed from the rewiring parts in the two phenotype-specific GRNs. Community detection technique is then applied for D-GRN to detect functional modules. Finally, we apply logistic regression classifier with recursive feature elimination to select biomarker genes in each module individually. The extracted feature genes result in a gene set of biomarkers with impressing ability to distinguish normal samples from controls. We verify the identified biomarkers in external independent validation datasets. For a proof-of-concept study, we apply the framework to identify diagnostic biomarkers of breast cancer. The identified biomarkers obtain a maximum AUC of 0.985 in the internal sample classification experiments. And these biomarkers achieve a maximum AUC of 0.989 in the external validations.
Conclusion
In conclusion, network rewiring reveals significant differences between different phenotypes, which indicating cancer dysfunctional mechanisms. With the development of sequencing technology, the amount and quality of gene expression data become available. Condition-specific gene regulatory networks that are close to the real regulations in different states will be established. Revealing the network rewiring will greatly benefit the discovery of biomarkers or signatures for phenotypes. D-GRN is a general method to meet this demand of deciphering the high-throughput data for biomarker discovery. It is also easy to be extended for identifying biomarkers of other complex diseases beyond breast cancer.
Keywords: Biomarker discovery, Gene regulatory network, Network rewiring, Feature selection, Breast cancer
Background
Gene regulatory network (GRN) is a model that characterizes the complex relationship between genes in a cell [1]. In a GRN, nodes represent genes and edges describe the regulatory relationships among them. From a physical perspective, the interactions between genes are through their products like proteins and RNAs. The weight of edge describes the direction and strength of an interaction. The alternation or mutation of one gene may affect the activity of many other genes through the network [2, 3].
Cancer is recognized as a complex disease caused by gene mutations, which will perturb the normal interactions among genes and lead to the disorder of connection mode or strength [4–6]. In other words, gene mutations cause perturbation and rewiring of GRNs [7, 8]. The rewired interactions generate changes in normal biological processes and that is crucial for cancerogenesis. Thus, the investigation of the rewiring GRN is significant in discovering potential biomarkers of indicating certain phenotypic states.
Breast cancer is the most commonly diagnosed cancer and the second leading cause of cancer death in women worldwide [9, 10]. Biomarkers play important roles in its early diagnosis and prognostic evaluation [11–13]. Nowadays, the accurate identification of biomarkers for breast cancer early detection is still very challenging. There are some biomarkers that have been validated like BRCA1 and HER2 [14]. However, new biomarkers and their combinations are still urgently needed to quantify the treatment effects with classical clinical prognostic factors. They also indicate the potential risks and pathogenesis of breast cancer [15, 16].
With the development of high-throughput sequencing technologies, an increasing amount of gene expression data become available. Various methods have been developed to find efficient biomarkers from high-throughput data [17–20]. For instance, the methods construct a dynamic network model and perform a multi-omics data integration for biomarker discovery [21]. However, there are few methods to solve this problem from the perspective of network rewiring, which indicates the dysfunctional mechanism of cancer.
In this paper, we propose a framework to identify potential biomarkers of breast cancer based on network rewiring. The disease and normal GRN are reconstructed from gene expression data with a reliable background GRN. CMI-PC (conditional mutual information-based path consistency) algorithm is employed to delete false positive interactions between independent genes or pairs that are not connected closely in a specific condition from the integrative background network. Comparing the GRNs in the two phenotypic conditions, a differential GRN, called D-GRN, containing the rewired nodes with differential regulations will be extracted. In D-GRN, we detect the community structures which are intensively connected nodes in the form of subnetwork modules. Finally, we apply logistic regression with recursive feature elimination (LR-RFE) to select biomarkers in each module respectively. We use cross-validations to find the optimal number of biomarkers individually. The maximum AUC in these module-based biomarkers achieves 0.985 in the internal validation. The selected biomarkers are also verified in external independent datasets and they achieve the maximum AUC value of 0.989 in classification.
Results
In this work, the proposed biomarker discovery framework focuses on the rewiring gene network between disease and normal conditions. Condition-specific GRNs are reconstructed through the integration of prior knowledge of an integrative background network and phenotypic gene expression data. CMI-PC algorithm is employed to remove redundant regulatory interactions from the background network. D-GRN is extracted from the two specified networks in two different states. We detect the communities in the D-GRN. And then machine learning method is applied to find the best feature combination in classification experiments. The selected features are more likely to be potential biomarkers. Here, we apply our framework to breast cancer and identify potential network-based module biomarkers.
Network rewiring
The reconstructed normal GRN has 430 edges (regulations) and 198 nodes (genes), while the disease GRN has 301 edges and 137 nodes. There are 71 same genes and 115 common edges between them. We merge the same nodes that have different connections and their neighbors to construct a D-GRN which contains 509 regulations and 238 genes.
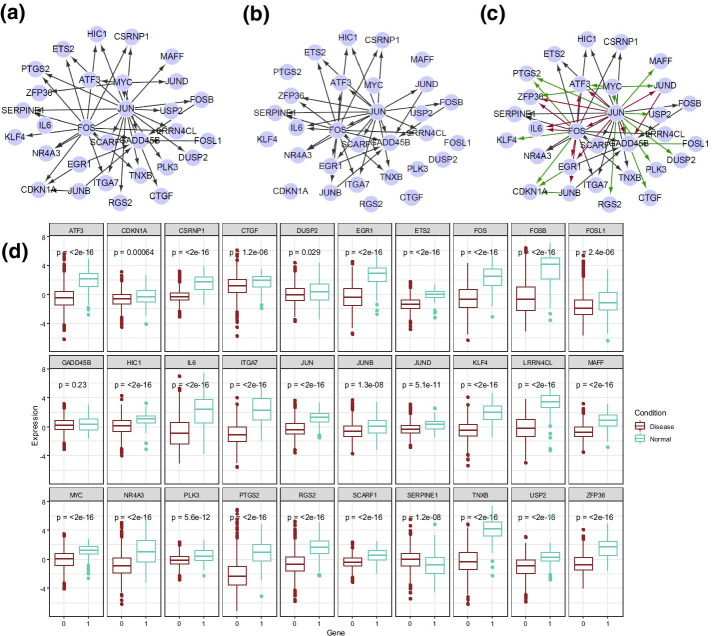
After community detection, the D-GRN has been divided into 5 modules (in the next section). To illustrate the network rewiring in normal and disease states, Fig. 1a, b show the Module 4’s gene regulatory interactions in normal condition and disease condition respectively. Figure 1c illustrates this part of D-GRN, including 30 nodes. Black, green and red lines represent edges in common, only in the normal network and only in the disease network respectively. Figure 1d shows the gene expression boxplot details in the normal and disease conditions and P values of difference. It can be easily observed that most nodes have significantly different gene expressions between the two conditions. Interestingly, few genes are not differentially expressed, but the regulatory interactions rewire in the two conditions. Instead of the node-centric difference, D-GRN identifies the edge-centric difference between the two phenotypes, i.e., normal and cancer state by the rewiring gene regulations.
Fig. 1.
Network rewiring and gene expression analysis of an identified module (Module 4). a Regulatory interactions in normal condition. b Regulatory interactions in disease condition. c D-GRN. d Gene expression profiles in normal and disease
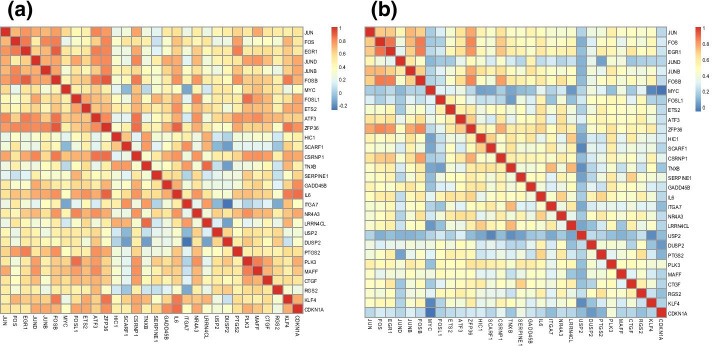
To further demonstrate the perturbations in the two GRNs, Fig. 2a, b present the heatmaps of Pearson’s correlation coefficient (PCC) between genes in normal and disease conditions. Obviously, there is a marked difference between them and it proves the effectiveness of our identification of the rewiring GRN across two conditions.
Fig. 2.
Correlation between genes in Module 4. a Normal condition. b Cancer condition
Detected communities
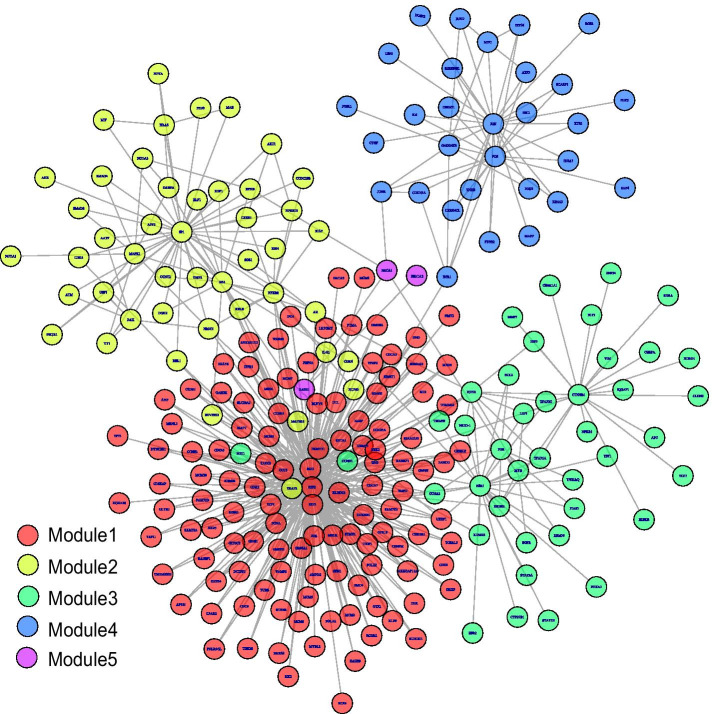
The community detection results in D-GRN are shown in Fig. 3. Different colors correspond to different modules. The 5 modules include 118, 46, 41, 30, and 3 members of genes individually. The global D-GRN is then divided into five functional blocks in the form of network-based modules. These subnetworks provide a pool of module biomarker candidates. To remove the redundant genes in the five detected modules, we perform feature selection for discovering biomarker gene sets respectively.
Fig. 3.
Community detection result in D-GRN
Breast cancer biomarkers identification and validation
Table 1 lists the selected genes in each module after logistic regression with recursive feature elimination (LR-REF) with tenfold cross-validations. F1-scores in classification experiments are also shown. Due to the number of genes in each module is diverse and some specific genes may have better discrimination abilities, there is a fluctuation of F1-score in the five modules. However, all of them are over 0.86, which means they perform well in the classification of distinguishing disease samples from controls. Figure 4 shows the receiver operating characteristic (ROC) curves of the selected biomarkers underlying the five modules in the internal validation dataset. The highest area under the ROC curve (AUC) value achieves 0.985, and the lowest reaches 0.923.
Table 1.
Five module biomarkers after LR-RFE selection
| Module | Biomarker genes | F1-score |
|---|---|---|
| 1 | KLF9 UHRF1 CDC25A CCNE1 CDK2 CCNE2 TUBB TAF11 POLE2 PKMYT1 KLHDC1 CDC45 ZBTB4 UBE2S CDKN2C NEK2 TOMM40 TACC3 GPR19 TCEAL5 FUS SIK2 AP1S1 SHB HS6ST1 TP73 GATA3 HOXA10 CD3EAP SLC20A1 XKR5 SOX4 | 0.93 |
| 2 | NFKB2 NFYA NR3C1 MAZ BAX TNIP2 DGKZ PIK3R1 IL4I1 | 0.92 |
| 3 | KDM4B STAT5B BCL2 TRIM59 | 0.96 |
| 4 | TNXB MAFF CTGF KLF4 JUN | 0.86 |
| 5 | BRCA1 RAD51 | 0.86 |
Fig. 4.
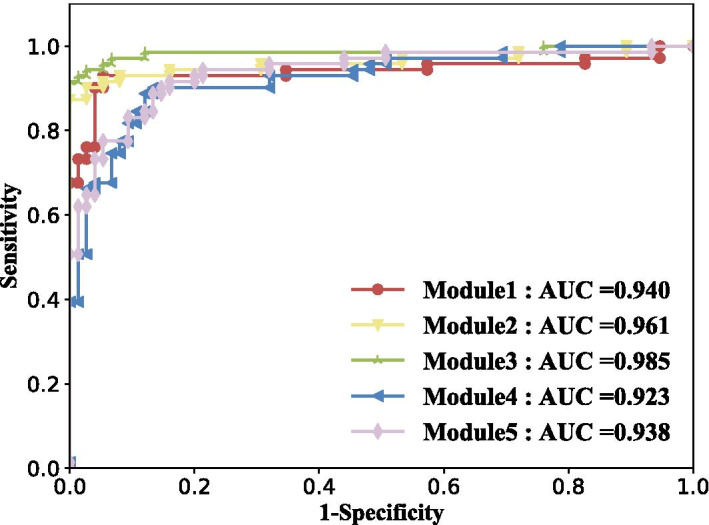
Classification performance of identified biomarkers in internal validation data
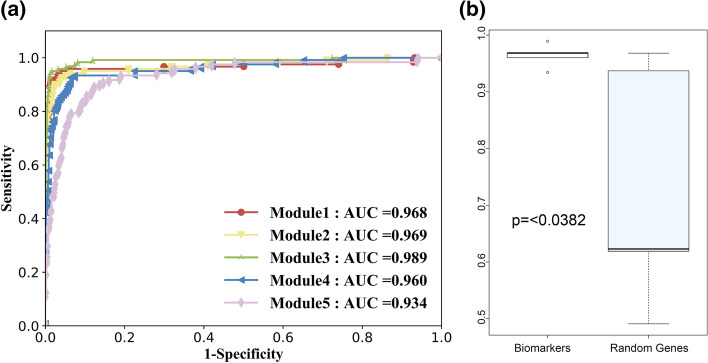
For validating of our finding module biomarkers, we perform the classification experiments in the external independent dataset GSE42568, which contains 104 disease samples and 17 controls. Figure 5a demonstrates the ROC curves of each selected gene sets in the independent validation data. As shown, the 5 gene modules all perform well in the classifications. The highest AUC value achieves 0.989, and the lowest AUC value reaches 0.934. In addition, Fig. 5b shows the diverse ability of classification in module biomarkers and in the corresponding random gene sets with the same size. The P-value is 0.0382, indicating a significant difference for them in classification. The results provide evidence that they are potential molecular markers for diagnosing breast cancer.
Fig. 5.
Classification performance of identified biomarkers and random genes in the independent validation data. a ROC curves of module biomarkers. b Comparison of the classification ability between module biomarkers and equal amount of random genes
To further demonstrate the dysfunctions of selected biomarkers, we employ network ontology analysis (NOA) [22] to perform gene ontology (GO) enrichment analysis on the rewired regulatory network across normal and disease states. Table 2 lists the enriched functions in the discovered biomarkers. As shown, some important cancerous dysregulations related ‘metabolic process’, ‘cell cycle’, ‘cell proliferation’ and ‘lymphocyte differentiation’ are significantly enriched. They are consistent with the prior knowledge of breast cancer pathogenesis during occurrence and development [23]. In turn, the functional analysis also provides evidence for the effectiveness of our proposed biomarker discovery method via network rewiring.
Table 2.
The enriched GO biological processes of identified biomarkers in D-GRN
| GO term | Description | Adjusted P-value | Biomarker |
|---|---|---|---|
| GO:0031323 | Regulation of cellular metabolic process | 1.90E−30 | NFKB2, DGKZ, JUN, KLF9, RAD51, UHRF1, CDC25A, CCNE1, CDK2, CCNE2, TAF11, PKMYT1, ZBTB4, UBE2S, CDKN2C, KDM4B, BCL2, TCEAL5, NFYA, NR3C1, MAZ, MAFF, CTGF, KLF4, STAT5B, TP73, GATA3, HOXA10, SOX4, BRCA1 |
| GO:0060255 | Regulation of macromolecule metabolic process | 7.40E−29 | NFKB2, BAX, JUN, KLF9, RAD51, UHRF1, CCNE1, CDK2, TAF11, ZBTB4, UBE2S, KDM4B, BCL2, TCEAL5, NFYA, NR3C1, MAZ, MAFF, CTGF, KLF4, STAT5B, TP73, GATA3, HOXA10, SOX4, BRCA1 |
| GO:0051171 | Regulation of nitrogen compound metabolic process | 4.00E−26 | NFKB2, JUN, KLF9, RAD51, UHRF1, CCNE1, CDK2, TAF11, ZBTB4, KDM4B, TCEAL5, NFYA, NR3C1, MAZ, MAFF, KLF4, STAT5B, TP73, GATA3, HOXA10, SOX4, BRCA1 |
| GO:0051726 | Regulation of cell cycle | 3.30E−24 | DGKZ, JUN, CDC25A, CDK2, CCNE2, PKMYT1, CDKN2C, NEK2, TACC3, BCL2, CTGF, STAT5B, TP73, BRCA1 |
| GO:0019219 | Regulation of nucleobase, nucleoside, nucleotide and nucleic acid metabolic process | 8.80E−24 | NFKB2, JUN, KLF9, RAD51, UHRF1, CCNE1, CDK2, TAF11, ZBTB4, KDM4B, TCEAL5, NFYA, NR3C1, MAZ, MAFF, KLF4, STAT5B, TP73, GATA3, HOXA10, SOX4, BRCA1 |
| GO:0010604 | Positive Regulation of macromolecule metabolic process | 1.10E−23 | JUN, RAD51, CCNE1, CDK2, TAF11, UBE2S, BCL2, NFYA, CTGF, STAT5B, TP73, SOX4, BRCA1 |
| GO:0051173 | Positive regulation of nitrogen compound metabolic process | 2.10E−23 | JUN, RAD51, CCNE1, CDK2, TAF11, NFYA, STAT5B, TP73, SOX4, BRCA1 |
| GO:0009893 | Positive regulation of metabolic process | 2.40E−23 | JUN, RAD51, CCNE1, CDK2, TAF11, UBE2S, BCL2, NFYA, CTGF, STAT5B, TP73, SOX4, BRCA1 |
| GO:0006357 | Regulation of Transcription from RNA polymerase II promoter | 1.00E−16 | JUN, KLF9, UHRF1, NFYA, STAT5B, BRCA1 |
| GO:0042127 | Regulation of cell proliferation | 1.20E−16 | JUN, CDK2, CDKN2C, BCL2, CTGF, KLF4, STAT5B, SOX4, BRCA1 |
| GO:0048545 | Response to steroid hormone stimulus | 5.60E−15 | CCNE1, BCL2, CTGF, STAT5B, GATA3, BRCA1 |
| GO:0051716 | Cellular response to stimulus | 1.70E−11 | DGKZ, JUN, RAD51, UHRF1, CCNE1, POLE2, BCL2, PIK3R1, STAT5B, TP73, BRCA1 |
| GO:0010941 | Regulation of cell death | 5.10E−10 | BAX, JUN, TUBB, CDKN2C, BCL2, CTGF, STAT5B, TP73, SOX4, BRCA1 |
| GO:0043067 | Regulation of programmed cell death | 1.70E−09 | BAX, JUN, TUBB, CDKN2C, BCL2, CTGF, STAT5B, TP73, SOX4, BRCA1 |
| GO:0042325 | Regulation of Phosphorylation | 6.80E−09 | DGKZ, JUN, CDC25A, CCNE2, PKMYT1, CDKN2C, BCL2, CTGF, TP73 |
| GO:0007346 | Regulation of mitotic cell cycle | 7.00E−09 | DGKZ, CDK2, PKMYT1, NEK2, BCL2, STAT5B |
| GO:0051094 | Positive regulation of developmental process | 1.20E−08 | BAX, JUN, CCNE1, BCL2, STAT5B |
| GO:0006974 | Response to DNA damage stimulus | 5.20E−07 | DGKZ, RAD51, UHRF1, POLE2, TP73, BRCA1 |
| GO:0000075 | Cell cycle checkpoint | 2.00E−06 | DGKZ, CCNE2, BRCA1 |
| GO:0045786 | Negative regulation of cell cycle | 2.60E−06 | DGKZ, CDKN2C, BCL2, TP73 |
| GO:0030522 | Intracellular receptor mediated signaling pathway | 2.90E−06 | KLF9, CCNE1, BRCA1 |
| GO:0048729 | Tissue morphogenesis | 4.00E−05 | BCL2 |
| GO:0030217 | T cell differentiation | 8.10E−05 | BCL2, STAT5B, SOX4 |
| GO:0002009 | Morphogenesis of an epithelium | 1.50E−04 | BCL2 |
| GO:0030098 | Lymphocyte differentiation | 8.90E−04 | BCL2, STAT5B, SOX4 |
Discussion
Identification of biomarkers for complex diseases such as cancer is of paramount importance in treatment, diagnosis and prognosis. Although numerous methods have been proposed to characterize biomarkers, few are from the perspective of regulatory network rewiring. GRN is one important strategy for revealing the disease mechanism from a systematic perspective. The investigation of cancer mutation and perturbation through GRN rewiring is of significance for addressing the underlying causal regulations responding to phenotypic transition. In this paper, we proposed a novel framework for identifying biomarkers based on network rewiring. Disease and normal condition-specific GRNs have been reconstructed from gene expression data with a priori background network respectively. The gene regulatory interactions changed between them illustrated the results of disease mutation and perturbation. D-GRN is extracted and modules in it are detected sequentially. LR-RFE is employed to find diagnostic biomarkers from modules. And cross-validation is used to set optimal number of biomarkers in each module.
Here, we applied the proposed framework D-GRN for identifying biomarkers of breast cancer. The integrative background network based on prior knowledge and condition-specific gene expression data have been used to construct normal and disease GRNs. We have to admit that there is limitation on missing nodes and edges, which is also expected to be as complete as possible. Totally, a D-GRN including 509 edges and 238 nodes have been extracted. Five potential biomarker gene sets in the form of subnetwork modules have been identified and they performed well in the classification of disease/normal samples in both internal and external validation datasets.
The focus of this work is to provide a computational pipeline for cancer biomarker discovery. In our framework, we select optimal genes serving as biomarkers in the network modules by machine learning. The rewired regulations as well as the weights or coefficients on these regulations have not been fully considered in biomarker discovery. The rewiring edges and patterns are expected to be embedded in the future discovery of biomarkers. In this work, another potential limitation is that the rewiring mechanism and gene dysfunction across different phenotypes have not been included in our feature selection. The genetic and epigenetic factors need be integrated together for addressing the causality of these identified gene regulatory rewiring. These will provide more valuable information for detecting more precise biomarkers for breast cancer.
Conclusion
In conclusion, network rewiring reveals significant information about cancer mechanisms. With the development of high-throughput technology, the amount of high quality gene expression data will keep arising. Condition-specific networks that are close to the real gene network will be established. The rewiring network components will be more clearly revealed, which will greatly benefit the discovery of biomarkers or signatures for breast cancer diagnosis. Obviously, our proposed strategy is rather general and it can be used to discovering biomarkers for other complex diseases.
Methods
Data sources and pre-processing
The RNA-seq gene expression data are downloaded from the TCGA data portal that includes 1097 patients with BRCA (breast invasive carcinoma) and 112 normal controls. The dataset provides gene expression values in the form of mean-centered number for 17,924 genes in all samples. In this study, 60% samples are used for training and testing purpose. We call them as internal training datasets. The remaining 40% samples are used for internal validation. We also download an independent dataset from NCBI GEO database (ID: GSE42568) for validating the identified biomarkers. It has 104 cancer samples and 17 controls. They are called external independent validation data.
The integrative human GRN is downloaded from our RegNetwork knowledgebase [24]. RegNetwork is a comprehensive repository for GRN by collecting the documented gene regulations from more than 20 databases and the predicted gene regulations by aligning transcription factor binding sites. Here, we use a new version of it containing 151,215 regulations in 19,719 genes.
Framework
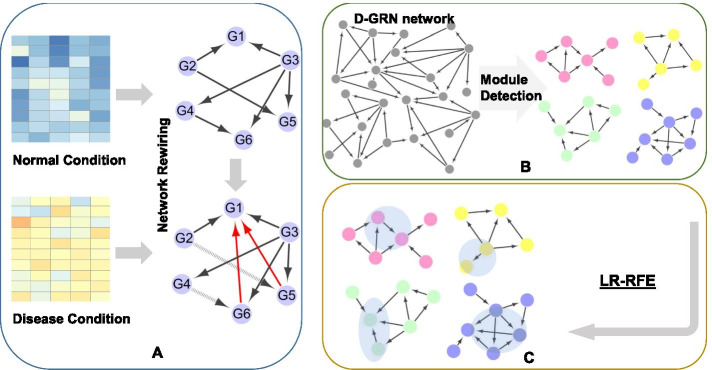
Figure 6 shows the framework of biomarker identification. It mainly contains three steps. First, as shown in Fig. 6a, it acquires the background of GRN through our prior knowledge about gene regulations in humans. It is a non-specific regulatory network with many redundant gene regulations. Gene expression data in normal and disease samples are used to evaluate the prior gene–gene interactions in specific phenotypes and eliminate redundant ones in the background GRN. Second, by comparing the normal and disease specific GRNs reconstructed from gene expression data, we can clearly identify the rewiring network sections across the two phenotypic states. A differential GRN called D-GRN can be extracted by comparing them. Community detection algorithm is then employed to find closely-connected nodes in the form of modules as shown in Fig. 6b. Third, we apply a logistic regression with recursive feature elimination (LR-RFE) approach to find biomarker genes as shown in Fig. 6c.
Fig. 6.
The framework of biomarker discovery based on network rewiring. a Reconstruct the disease and normal GRNs respectively by integrating prior background network and gene expression data. b Extract the rewiring regulations and establish a D-GRN. Module detection is implemented to find closely-connected nodes in D-GRN. c Identify biomarkers in each module through LR-RFE
Gene regulatory network rewiring
Determining GRN is an important avenue for revealing disease mechanisms. In this study, disease GRN and normal GRN are reconstructed respectively based on the corresponding gene expression profiling data on a background network. The prior network is deposited in RegNetwork, a knowledge-based genome-wide regulatory network database by integrating amount of data resources [24].
Numerous methods have been developed to reconstruct GRN from gene expression profile [25, 26]. Here, we particularly concern about the regulatory connection changes between disease and normal states. So we apply CMI-PC method to reconstruct the disease and normal GRNs [27–29]. Mutual information (MI) is a measure of the mutual dependence between the two variables. It is increasingly popular in GRN reconstruction for the ability to measure non-linear dependency [30, 31]. Conditional mutual information (CMI) in gene pairs is the expected value of the mutual information of two interest genes given the joint regulation by other genes [32]. MI is a special case of zero-order CMI. The MI of variables X and Y, CMI of variables X and Y given Z are calculated by a widely-used estimation method [33] as
| 1 |
| 2 |
The approach partitions the supports of X, Y, Z into bins with finite size, where the marginal, joint, and conditional probability mass functions are denoted by p with the appropriate subscripts. , and means the integral over the bin i.
Similar to MI, a higher CMI value indicates a closer relationship between the variables X and Y given variable(s) Z. Path consistency (PC) algorithm is used to remove the edges from the background network based on CMI values. The process is, for an adjacent gene pair X and Y, first, calculate MI (0-order CMI). If the value is low or zero, delete the edge between them. Next, select the adjacent gene Z of them and compute first-order CMI I(X,Y|Z) and repeat the step to delete edges that are independent or not strongly connected until no edge that can be deleted. The procedure will continue until there is no higher order CMI. The threshold values for deletion are the same in the two different conditions.
In this way, we obtain two specific GRNs in disease and normal samples respectively. The different interaction between genes shows the rewiring raised by the disease effects. We extract the rewiring parts and construct a D-GRN. In detail, we find the same genes with different connections and add their adjacent genes. Then we connect them based on the normal and disease GRNs.
Community detection
The communities in D-GRN are imperative in the understanding of the functional module about the difference between normal and disease conditions. We apply a fast greedy detection algorithm [34] in the D-GRN to identify the closely-connected gene modules. This algorithm can be briefly described as follows: assuming every independent node in the network is a module. And then it merges modules to make the evaluation standard Modularity (Q) increase most until all nodes are involved in one module. Finally, a tree graph will appear with leaves representing gene nodes. Modules can be divided by different tree levels. The most reliable dividing corresponds to the maximum modularity. Modularity (Q) can be described as:
| 3 |
| 4 |
where eij is the ratio of numbers of edges connected module i and module j to total edges.
Biomarker discovery based on LR-RFE
Biomarkers should be able to effectively distinguish disease from normal samples [17, 35]. The detected network-based gene communities provide a pool of module biomarker candidates. To select better biomarkers in each module, we employ RFE with cross-validations based on logistic regression [36] classifier. Compared to other machine learning methods, LR is easier to implement, interpret, and also is a very efficient classification algorithm [37]. Because of its mathematical interpretability, it has a wide range of applications in the field of biomedicine [38]. The logistic regression can be considered as follows
| 5 |
where denotes the p-dimensional gene expression vector. yi is a corresponding binary variable. θ is the vector of the coefficients.
For over-fitting problem, we choose L2 regularization techniques to avoid, which is defined as
| 6 |
where λ is a positive tuning parameter used to balance the loss term and penalty term.
RFE law is in the process of continuously training the model [39]. Each time the training is completed, the specified number of low-importance features are deleted. Then new features are trained again. The importance of features is obtained again, and unimportant characteristics are deleted until the number of characteristics meets the predefined settings. In this paper, we delete one gene each time and through cross-validation to find the optimal number of features. If reducing the features will cause a performance loss, then no features will be removed. The selected biomarkers are further verified in the validation datasets.
Acknowledgements
We would like to thank editors and anonymous reviewers for their constructive comments. Thanks are also due to Lingyu Li and Haixia Shang for their assistance in this project.
About this supplement
This article has been published as part of BMC Bioinformatics Volume 22 Supplement 12 2021: Explainable AI methods in biomedical data science. The full contents of the supplement are available at https://bmcbioinformatics.biomedcentral.com/articles/supplements/volume-22-supplement-12.
Abbreviations
- GRN
Gene regulatory network
- D-GRN
Differential gene regulatory network
- CMI-PC
Conditional mutual information-based path consistency
- LR-RFE
Logistic regression with recursive feature elimination
- PCC
Pearson’s correlation coefficient
- ROC
Receiver operating characteristic
- AUC
Area under the ROC curve
- NOA
Network ontology analysis
- GO
Gene ontology
- BRCA
Breast invasive carcinoma
- MI
Mutual information
- CMI
Conditional mutual information
- PC
Path consistency
- Q
Modularity
Authors' contributions
YJW carried out the experiments, wrote the program and drafted the manuscript. ZPL proposed the idea, coordinated this study and revised the manuscript. Both authors read and approved the final manuscript.
Funding
This work was partially supported by National Key Research and Development Program of China (No. 2020YFA0712402); National Natural Science Foundation of China (NSFC) (61973190 and 61572287); Natural Science Foundation of Shandong Province of China (ZR2020ZD25) and Shandong Provincial Key Research and Development Program (Major Scientific and Technological Innovation Project, 2019JZZY010423); the Program of Qilu Young Scholars of Shandong University. Publication costs are funded by National Key Research and Development Program and NSFC. The funding bodies had no role in the design of the study, collection, the interpretation of data and in writing the manuscript.
Availability of data and materials
The results published here are based in part upon data generated by the TCGA Research Network (http://cancergenome.nih.gov/).
Declarations
Ethics approval and consent to participate
Not applicable.
Consent for publication
Not applicable.
Competing interests
The authors declare no competing interests.
Footnotes
Publisher's Note
Springer Nature remains neutral with regard to jurisdictional claims in published maps and institutional affiliations.
Contributor Information
Yijuan Wang, Email: wangyijuan@mail.sdu.edu.cn.
Zhi-Ping Liu, Email: zpliu@sdu.edu.cn.
References
- 1.Mccarthy MI, Abecasis GAR, Cardon LR, Goldstein DB, Little J, Ioannidis JPA, Hirschhorn JN. Genome-wide association studies for complex traits: consensus, uncertainty and challenges. Nat Rev Genet. 2008;9(5):356–369. doi: 10.1038/nrg2344. [DOI] [PubMed] [Google Scholar]
- 2.Watson P, Lynch HT. Cancer risk in mismatch repair gene mutation carriers. Fam Cancer. 2001;1(1):57–60. doi: 10.1023/A:1011590617833. [DOI] [PubMed] [Google Scholar]
- 3.Liu J, Feng C, Kong X, Xu Y. Dual graph-Laplacian PCA: a closed-form solution for bi-clustering to find “Checkerboard” structures on gene expression data. IEEE Access. 2019;7:151329–151338. doi: 10.1109/ACCESS.2019.2941227. [DOI] [Google Scholar]
- 4.Creixell P, Schoof EM, Simpson CD, Longden J, Miller CJ, Lou HJ, Perryman L, Cox TR, Zivanovic N, Palmeri A. Kinome-wide decoding of network-attacking mutations rewiring cancer signaling. Cell. 2015;163(1):202–217. doi: 10.1016/j.cell.2015.08.056. [DOI] [PMC free article] [PubMed] [Google Scholar]
- 5.Greenman C, Stephens P, Smith R, Dalgliesh GL, Hunter C, Bignell G, Davies H, Teague J, Butler A, Stevens C, et al. Patterns of somatic mutation in human cancer genomes. Nature. 2007;446(7132):153–158. doi: 10.1038/nature05610. [DOI] [PMC free article] [PubMed] [Google Scholar]
- 6.Billmann M, Chaudhary V, ElMaghraby MF, Fischer B, Boutros M. Widespread rewiring of genetic networks upon cancer signaling pathway activation. Cell Syst. 2018;6(1):52–64. doi: 10.1016/j.cels.2017.10.015. [DOI] [PMC free article] [PubMed] [Google Scholar]
- 7.Bandyopadhyay S, Mehta M, Kuo D, Sung MK, Chuang R, Jaehnig EJ, Bodenmiller B, Licon K, Copeland W, Shales M, et al. Rewiring of genetic networks in response to DNA damage. Science. 2010;330(6009):1385–1389. doi: 10.1126/science.1195618. [DOI] [PMC free article] [PubMed] [Google Scholar]
- 8.Shang H, Liu ZP. Prioritizing type 2 diabetes genes by weighted pagerank on bilayer heterogeneous networks. IEEE/ACM Trans Comput Biol Bioinform. 2021;18(1):336–346. doi: 10.1109/TCBB.2019.2917190. [DOI] [PubMed] [Google Scholar]
- 9.Bray F, Ferlay J, Soerjomataram I, Siegel RL, Torre LA, Jemal A. Global cancer statistics 2018: GLOBOCAN estimates of incidence and mortality worldwide for 36 cancers in 185 countries. CA Cancer J Clin. 2018;68(6):394–424. doi: 10.3322/caac.21492. [DOI] [PubMed] [Google Scholar]
- 10.DeSantis CE, Ma J, Gaudet MM, Newman LA, Miller KD, Goding Sauer A, Jemal A, Siegel RL. Breast cancer statistics, 2019. CA Cancer J Clin. 2019;69(6):438–451. doi: 10.3322/caac.21583. [DOI] [PubMed] [Google Scholar]
- 11.Waks AG, Winer EP. Breast cancer treatment: a review. J Am Med Assoc. 2019;321(3):288–300. doi: 10.1001/jama.2018.19323. [DOI] [PubMed] [Google Scholar]
- 12.Sun YS, Zhao Z, Yang ZN, Xu F, Lu HJ, Zhu ZY, Shi W, Jiang J, Yao PP, Zhu HP. Risk factors and preventions of breast cancer. Int J Biol Sci. 2017;13(11):1387. doi: 10.7150/ijbs.21635. [DOI] [PMC free article] [PubMed] [Google Scholar]
- 13.Kwa M, Makris A, Esteva FJ. Clinical utility of gene-expression signatures in early stage breast cancer. Nat Rev Clin Oncol. 2017;14(10):595–610. doi: 10.1038/nrclinonc.2017.74. [DOI] [PubMed] [Google Scholar]
- 14.Weigel MT, Dowsett M. Current and emerging biomarkers in breast cancer: prognosis and prediction. Endocrine Relat Cancer. 2010;17(4):R245–R262. doi: 10.1677/ERC-10-0136. [DOI] [PubMed] [Google Scholar]
- 15.Michailidou K, Lindström S, Dennis J, Beesley J, Hui S, Kar S, Lemaçon A, Soucy P, Glubb D, Rostamianfar A. Association analysis identifies 65 new breast cancer risk loci. Nature. 2017;551(7678):92. doi: 10.1038/nature24284. [DOI] [PMC free article] [PubMed] [Google Scholar]
- 16.Veronesi U, Boyle P, Goldhirsch A, Orecchia R, Viale G. Breast cancer. The Lancet. 2005;365(9472):1727–1741. doi: 10.1016/S0140-6736(05)66546-4. [DOI] [PubMed] [Google Scholar]
- 17.Abeel T, Helleputte T, Van de Peer Y, Dupont P, Saeys Y. Robust biomarker identification for cancer diagnosis with ensemble feature selection methods. Bioinformatics. 2010;26(3):392–98. [DOI] [PubMed]
- 18.Smolinska A, Blanchet L, Buydens LMC, Wijmenga SS. NMR and pattern recognition methods in metabolomics: from data acquisition to biomarker discovery: a review. Anal Chim Acta. 2012;750:82–97. doi: 10.1016/j.aca.2012.05.049. [DOI] [PubMed] [Google Scholar]
- 19.Feng CM, Xu Y, Hou MX, Dai LY, Shang JL. PCA via joint graph Laplacian and sparse constraint: identification of differentially expressed genes and sample clustering on gene expression data. BMC Bioinform. 2019;20(Suppl 22):716. doi: 10.1186/s12859-019-3229-z. [DOI] [PMC free article] [PubMed] [Google Scholar]
- 20.Liu ZP. Identifying network-based biomarkers of complex diseases from high-throughput data. Biomark Med. 2016;10(6):633–650. doi: 10.2217/bmm-2015-0035. [DOI] [PubMed] [Google Scholar]
- 21.Zhou W, Sailani MR, Contrepois K, Zhou Y, Ahadi S, Leopold SR, Zhang MJ, Rao V, Avina M, Mishra T. Longitudinal multi-omics of host–microbe dynamics in prediabetes. Nature. 2019;569(7758):663–671. doi: 10.1038/s41586-019-1236-x. [DOI] [PMC free article] [PubMed] [Google Scholar]
- 22.Wang J, Huang Q, Liu ZP, Wang Y, Wu LY, Chen L, Zhang XS. NOA: a novel network ontology analysis method. Nucleic Acids Res. 2011;39(13):e87. doi: 10.1093/nar/gkr251. [DOI] [PMC free article] [PubMed] [Google Scholar]
- 23.Zhang BH, Yang J, Jiang L, Lyu T, Kong L-X, Tan YF, Li B, Zhu YF, Xi AY, Xu XJG. Development and validation of a 14-gene signature for prognosis prediction in hepatocellular carcinoma. Genomics. 2020;112(4):2763–2771. doi: 10.1016/j.ygeno.2020.03.013. [DOI] [PubMed] [Google Scholar]
- 24.Liu ZP, Wu C, Miao H, Wu H. RegNetwork: an integrated database of transcriptional and post-transcriptional regulatory networks in human and mouse. Database. 2015;2015:bav095. doi: 10.1093/database/bav095. [DOI] [PMC free article] [PubMed] [Google Scholar]
- 25.Tian D, Gu Q, Ma J. Identifying gene regulatory network rewiring using latent differential graphical models. Nucleic Acids Res. 2016;44(17):e140. doi: 10.1093/nar/gkw581. [DOI] [PMC free article] [PubMed] [Google Scholar]
- 26.Dong C, Chu X, Wang Y, Wang Y, Jin L, Shi T, Huang W, Li Y. Exploration of gene-gene interaction effects using entropy-based methods. Eur J Hum Genet. 2008;16(2):229–235. doi: 10.1038/sj.ejhg.5201921. [DOI] [PubMed] [Google Scholar]
- 27.Xiao F, Gao L, Ye Y, Hu Y, He R. Inferring gene regulatory networks using conditional regulation pattern to guide candidate genes. PLoS ONE. 2016;11(5):e0154953. doi: 10.1371/journal.pone.0154953. [DOI] [PMC free article] [PubMed] [Google Scholar]
- 28.Kalisch M, Bühlman P. Estimating high-dimensional directed acyclic graphs with the PC-algorithm. J Mach Learn Res. 2012;8(2):613–636. [Google Scholar]
- 29.Zhang X, Zhao XM, He K, Lu L, Cao Y, Liu J, Hao JK, Liu ZP, Chen L. Inferring gene regulatory networks from gene expression data by path consistency algorithm based on conditional mutual information. Bioinformatics. 2012;28(1):98–104. doi: 10.1093/bioinformatics/btr626. [DOI] [PubMed] [Google Scholar]
- 30.Helena B, Joan-Josep G-C, Alfonso B, Montserrat V, Manuel SJ, Pere C, Alexandre P. MISS: a non-linear methodology based on mutual information for genetic association studies in both population and sib-pairs analysis. Bioinformatics. 2010;15:1811–1818. doi: 10.1093/bioinformatics/btq273. [DOI] [PubMed] [Google Scholar]
- 31.Butte AJ, Kohane IS. Mutual information relevance networks: Functional genomic clustering using pairwise entropy measurements. Pac Symp Biocomput Pac Symp Biocomput. 2000;5:418–429. doi: 10.1142/9789814447331_0040. [DOI] [PubMed] [Google Scholar]
- 32.Wang K, Saito M, Bisikirska BC, Alvarez MJ, Lim WK, Rajbhandari P, Shen Q, Nemenman I, Basso K, Margolin AA, et al. Genome-wide identification of post-translational modulators of transcription factor activity in human B cells. Nat Biotechnol. 2009;27(9):829–837. doi: 10.1038/nbt.1563. [DOI] [PMC free article] [PubMed] [Google Scholar]
- 33.Shang H, Liu ZP: Prioritizing Congenital Heart Disease Genes from Transcriptone and Interactome via PageRank. In: 2018 IEEE 8th annual international conference on CYBER technology in automation, control, and intelligent systems (CYBER); 2018. pp. 424–9.
- 34.Newman ME. Fast algorithm for detecting community structure in networks. Phys Rev E. 2004;69(6):066133. doi: 10.1103/PhysRevE.69.066133. [DOI] [PubMed] [Google Scholar]
- 35.Ilyin SE, Belkowski SM, Plata-Salamán CR. Biomarker discovery and validation: technologies and integrative approaches. Trends Biotechnol. 2004;22(8):411–416. doi: 10.1016/j.tibtech.2004.06.005. [DOI] [PubMed] [Google Scholar]
- 36.Brandes U. On variants of shortest-path betweenness centrality and their generic computation. Soc Netw. 2008;30(2):136–145. doi: 10.1016/j.socnet.2007.11.001. [DOI] [Google Scholar]
- 37.Hosmer Jr DW, Lemeshow S, Sturdivant RX: Applied logistic regression, vol. 398: Wiley; 2013.
- 38.Chan YH. Biostatistics 305. Multinomial logistic regression. Singap Med J. 2005;46(6):259. [PubMed] [Google Scholar]
- 39.Granitto PM, Furlanello C, Biasioli F, Gasperi F. Recursive feature elimination with random forest for PTR-MS analysis of agroindustrial products. Chemom Intell Lab Syst. 2006;83(2):83–90. doi: 10.1016/j.chemolab.2006.01.007. [DOI] [Google Scholar]
Associated Data
This section collects any data citations, data availability statements, or supplementary materials included in this article.
Data Availability Statement
The results published here are based in part upon data generated by the TCGA Research Network (http://cancergenome.nih.gov/).


