Abstract
Human immunodeficiency virus type 1 viral load results were compared for paired samples collected in plastic and glass Vacutainer tubes, using both standard (n = 60) and ultrasensitive (n = 66) assays. The results showed a strong correlation (P < 0.0001), and plastic tubes can be substituted for glass tubes.
Monitoring the response to antiretroviral drugs by periodic quantification of human immunodeficiency virus type 1 (HIV-1) in peripheral blood has become essential to the management of HIV-infected patients (5). Many of these blood samples contain high titers of HIV-1 and, in many cases, drug-resistant virus (1, 2). Standard blood collection tubes are made of glass, which can break, causing injury to the health care worker. A recent incident in our laboratory, in which a glass Vacutainer tube shattered while the cap was being removed and cut the hand of a technologist, led us to investigate the use of plastic collection tubes. Before converting to plastic collection tubes, we wanted to be certain that the change would not adversely affect the quantitation of HIV-1. The results are presented in this report.
Paired blood samples from HIV-infected patients were collected in both plastic and glass EDTA-containing Vacutainer tubes (Becton Dickinson, Franklin Lakes, N.J.) and submitted to the Clinical Virology Laboratory, Yale New Haven Hospital, for quantitation of HIV. Samples were tested by the AMPLICOR HIV-1 MONITOR test (Roche Diagnostics, Branchburg, N.J.) using either the standard or the ultrasensitive specimen-processing procedures, as requested by the patients' physicians. In total, 60 specimens were tested by the standard test and 66 were tested by the ultrasensitive assay.
Plasma was separated by centrifugation within 6 h of sample collection, as is standard laboratory practice, and then frozen at −70°C for several days to several weeks until the test was performed. Matched sample pairs, collected in plastic and glass, were processed in parallel and tested in the same test run. The assay was performed according to the manufacturer's instructions. Positive results within the linear range of the assays were given as log10 copies per milliliter of plasma. Positive results below the linear range were given as HIV detected at <2.6 log10 units (<400 copies/ml) for the standard assay and HIV detected at <1.7 log10 units (<50 copies/ml) for the ultrasensitive assay. Specimens giving optical density (OD) readings of <0.20 were reported as not detected.
When both paired samples gave results within the linear range, when both were outside the linear range, or when both were “not detected,” comparisons were straightforward. The distribution of results is shown in Table 1. For 8 specimens tested by the standard assay and 13 specimens tested by the ultrasensitive assay, the results from the pairs fell into different categories. These results are shown in Table 2.
TABLE 1.
Comparison of HIV-1 PCR results for paired blood samples collected in plastic and glass Vacutainer tubes
| Assay | Total no. tested | No. with both results negative | No. with both results positive and:
|
Other resultsb | ||
|---|---|---|---|---|---|---|
| Within linear rangea | Above linear range | Below linear range | ||||
| Standard | 60 | 7 | 43 | 1 | 1 | 8 |
| Ultrasensitive | 66 | 13 | 22 | 2 | 16 | 13 |
Linear range, 2.6 to 5.88 log10 units for standard assay and 1.7 to 4.8 log10 units for ultrasensitive assay.
Results of pairs split between different categories.
TABLE 2.
Results from paired glass and plastic tubes when one result could not be quantified
| Assay | Specimen code | AMPLICOR HIV-1 MONITOR result (log10)a
|
|
|---|---|---|---|
| Glass tubes | Plastic tubes | ||
| Standard | A | <2.6 | NDb |
| B | 2.63 | ND | |
| C | <2.6 | 2.86 | |
| D | <2.6 | 2.66 | |
| E | 2.96 | <2.6 | |
| F | ND | 2.68 | |
| G | ND | <2.6 | |
| H | 5.87 | >5.88 | |
| Ultrasensitive | A | 1.81 | <1.7 |
| B | <1.7 | 1.86 | |
| C | <1.7 | ND | |
| D | <1.7 | ND | |
| E | <1.7 | ND | |
| F | <1.7 | ND | |
| G | <1.7 | ND | |
| H | <1.7 | ND | |
| I | <1.7 | ND | |
| J | <1.7 | ND | |
| K | <1.7 | ND | |
| L | ND | <1.7 | |
| M | ND | <1.7 | |
<2.6 log10 units = <400 copies/ml; <1.7 log10 units = <50 copies/ml.
ND, not detected.
For the 43 sample pairs that fell within the linear range for the standard assay, 41 of 43 results differed by ≤0.3 log10 unit and 42 of 43 results differed by ≤0.5 log10 unit. The median difference between the sample pairs was 0.10 log10 unit (range, 0.01 to 0.59 log10 unit). For the 22 sample pairs that fell within the linear range for the ultrasensitive assay, 21 of 22 differed by ≤0.3 log10 unit and all 22 differed by <0.5 log10 unit. The median difference was 0.15 log10 unit (range, 0.01 to 0.43 log10 unit). In these 65 sample pairs, higher viral load results were observed with similar frequencies in glass (n = 31) and plastic (n = 34) tubes.
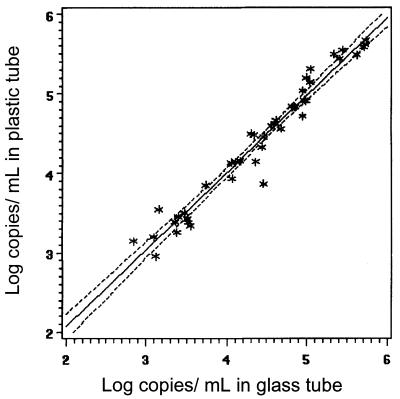
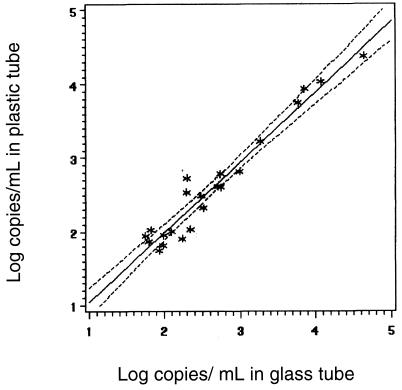
Results from paired plastic and glass tubes that fell within the linear range of the assay were compared by rank correlation of log10 values. The correlation between viral load results from plastic and glass collection tubes is shown for the standard HIV-1 PCR assay in Fig. 1 (regression equation, plastic tube [log10] = 0.125241 + 0.971775 × glass tube). The correlation for the ultrasensitive assay is shown in Fig. 2 (regression equation, plastic tube [log 10] = 0.101818 + 0.950395 × glass tube). The Pearson correlation (r) was 0.97837 (P < 0.0001) for the standard PCR (n = 43) and 0.97254 (P < 0.0001) for the ultrasensitive procedure (n = 22).
FIG. 1.
Comparison of standard HIV-1 PCR assay results within the linear range (n = 43) from paired samples collected in plastic and glass tubes (r = 0.97837) (regression equation, plastic tube [log10] = 0.125241 + 0.971775 × glass tube).
FIG. 2.
Comparison of ultrasensitive HIV-1 PCR assay results within the linear range (n = 22) from paired samples collected in plastic and glass tubes (r = 0.97254) (regression equation, plastic tube [log10] = 0.101818 + 0.950395 × glass tube).
Thus, the HIV-1 viral load results obtained from blood collected in plastic Vacutainer tubes showed excellent correlation with those obtained from blood collected in glass tubes. For 65 sample pairs with results quantifiable within the linear ranges of the assays, 62 pairs had differences of ≤0.3 log10 unit and 64 had differences of <0.5 log10 unit, differences which are generally considered clinically insignificant and within the inherent variability of the assays. For nine specimens, virus was not detectable by the ultrasensitive PCR assay in the sample collected in plastic, while a positive signal was detected at <50 copies (<1.7 log10 units) for the paired sample collected in glass. The converse occurred for two samples. A negative result is generated from an OD value of 0.200 for an undiluted sample, while a positive result below the linear range often results from OD values of 0.201 to 0.250. These are very slight differences. Some signals obtained at low levels may even be false-positive results (3, 4, 6). Furthermore, reproducibility data provided by the kit manufacturer indicate 95% confidence limits of ±0.68 log10 unit for the ultrasensitive procedure when the RNA level is 50 copies/ml and ±0.76 log10 unit for the standard procedure when the RNA level is 500 copies/ml (package insert). Thus, the differences observed between the samples collected in plastic and glass tubes fell within the confidence limits of the assay.
Preventing blood exposure is the primary means of preventing occupationally acquired HIV and hepatitis infections (1). Any measures that can be readily put into place to reduce hazards of HIV and hepatitis B and C virus infections to health care workers should be implemented. From the point of view of safety of the health care worker, plastic tubes are preferred. While plastic tubes are more expensive than glass to purchase, savings can be obtained from the lower disposal costs of plastic, as well as from reduced injuries, antiviral prophylaxis and infections in workers. To our knowledge, ours is the only direct study confirming that plastic Vacutainer tubes are a satisfactory substitute for glass in HIV-1 viral load testing.
Acknowledgments
We acknowledge Roche Diagnostics for providing test kits and Maria Hernandez for her assistance in summarizing the data.
REFERENCES
- 1.Centers for Disease Control and Prevention. Public Health Service guidelines for the management of health-care worker exposures to HIV and recommendations for postexposure prophylaxis. Morb Mortal Wkly Rep. 1998;47:1–33. [PubMed] [Google Scholar]
- 2.Centers for Disease Control and Prevention. Report of the NIH Panel to Define Principles of Therapy of HIV Infection and guidelines for the use of antiretroviral agents in HIV-infected adults and adolescents. Morb Mortal Wkly Rep. 1998;47(RR-5):1–82. [PubMed] [Google Scholar]
- 3.College of American Pathologists Proficiency Testing Program. Nucleic acid amplification survey 1997 set, ID-B. Chicago, Ill: College of American Pathologists; 1997. [Google Scholar]
- 4.College of American Pathologists Proficiency Testing Program. Viral load survey set, HIV/HV2-C. Chicago, Ill: College of American Pathologists; 1998. [Google Scholar]
- 5.O'Brien W A, Hartigan P M, Daar E S, Simberkoff M S, Hamilton J D. Changes in plasma HIV RNA levels and CD4+ lymphocyte counts predict both response to antiretroviral therapy and therapeutic failure. Ann Intern Med. 1997;126:939–945. doi: 10.7326/0003-4819-126-12-199706150-00002. [DOI] [PubMed] [Google Scholar]
- 6.Rich J D, Merriman N A, Mylonakis E, Greenough T C, Flanigan T P, Brady B J, Carpenter C C J. Misdiagnosis of HIV infection by HIV-1 plasma viral load testing: a case series. Ann Intern Med. 1999;130:37–39. doi: 10.7326/0003-4819-130-1-199901050-00007. [DOI] [PubMed] [Google Scholar]


