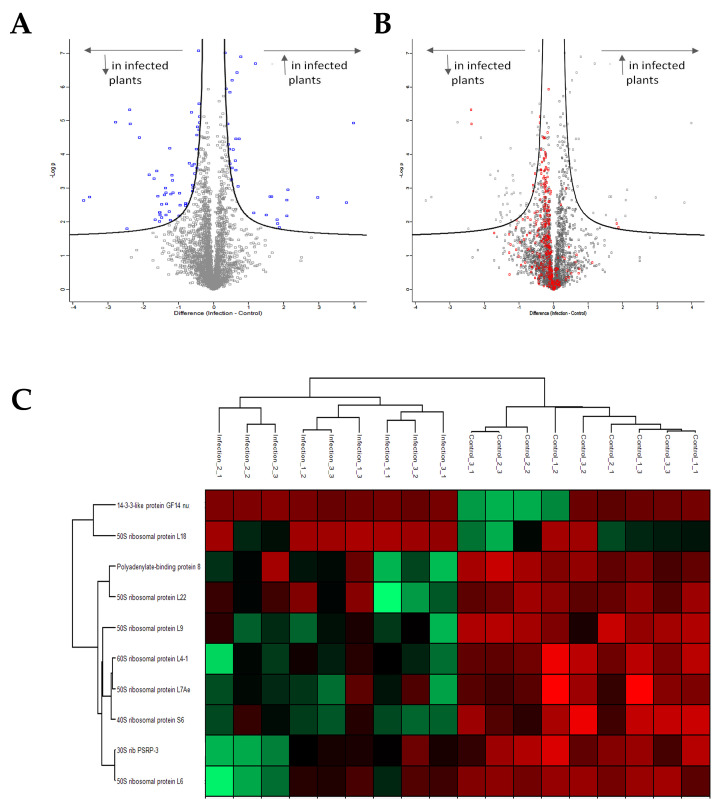
Figure 7.
MS analysis. (A) Volcano plot showing all proteins affected in PSTVd-infected N. benthamiana plants. In total, 85 proteins were shown to be statistically affected. (B) Volcano plot showing proteins related to the translation mechanism affected upon PSTVd infection of N. benthamiana plants. (C) Heat map of proteins related to translation statistically affected by the infection of PSTVd. All graphs were created using the Perseus 1.6.10.43 software [52]. More details in Table S5.

