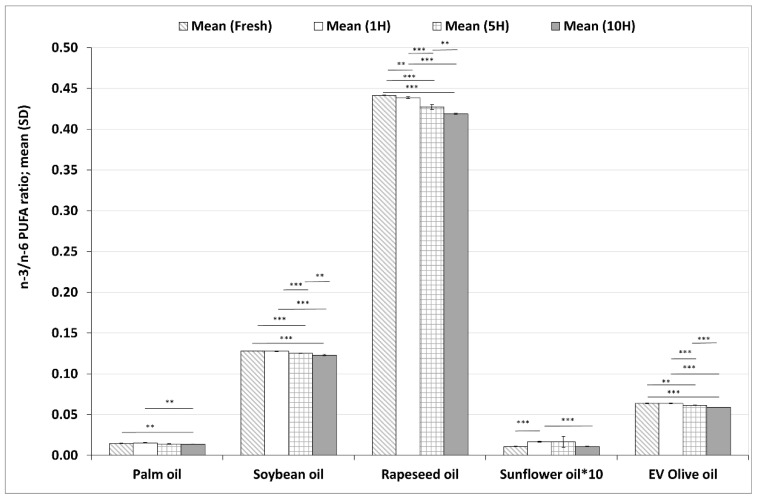
Figure 5.
Changes in the n–3/n–6 PUFA ratios in five different plant-based oils in fresh samples and after one (1H), five (5H) and ten heating sequences (10H). Data for sunflower oil are shown at 10× magnification for better visibility. Each column shows the mean (SD) data of six different chromatograms. Asterisks denote statistically significant differences between the different time points in the same oil; *: 0.01 ≤ p < 0.05; **: 0.001 ≤ p < 0.01; ***: p < 0.001. EV olive oil: extra virgin olive oil.

