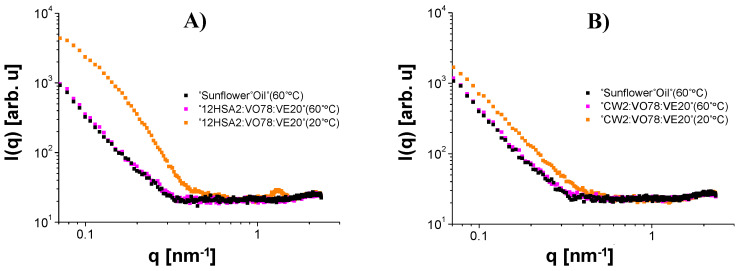
Figure 7.
Comparison between the SAXS curves of sunflower oil at °C, the major component of the organogels presented in this manuscript, and the samples containing 12HSA (A) and CW (B), at and °C. In this example, the curves collected at °C are almost perfectly overlapped. This fact makes some of the treated curves presented in Figure 5 and Figure 6 very noisy in all q values. For the other curves, like the ones collected at °C, only their high q regions are noisy.

