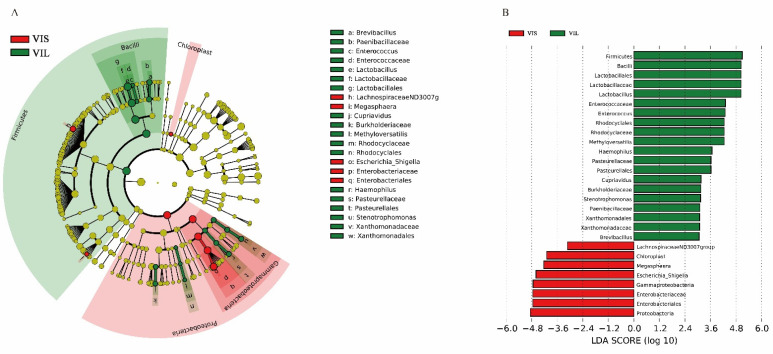
Figure 5.
Analysis of different abundant bacterial taxa using LEfSe. (A) The evolutionary branching diagram. The circle from inside to outside represents the classification level from phylum to species, and the dot (yellow: no significant difference, other colors: significant difference) represents a classification at this level. (B) The histogram of LDA value distribution and the length of the histogram represents the impact of different species.

