

Abstract
The timing of abiotic stress elicitors on wood formation largely affects xylem traits that determine xylem efficiency and vulnerability. Nonetheless, seasonal variability of elevated CO2 (eCO2) effects on tree functioning under drought remains largely unknown. To address this knowledge gap, 1-year-old aspen (Populus tremula L.) trees were grown under ambient (±445 ppm) and elevated (±700 ppm) CO2 and exposed to an early (spring/summer 2019) or late (summer/autumn 2018) season drought event. Stomatal conductance and stem shrinkage were monitored in vivo as xylem water potential decreased. Additional trees were harvested for characterization of wood anatomical traits and to determine vulnerability and desorption curves via bench dehydration. The abundance of narrow vessels decreased under eCO2 only during the early season. At this time, xylem vulnerability to embolism formation and hydraulic capacitance during severe drought increased under eCO2. Contrastingly, stomatal closure was delayed during the late season, while hydraulic vulnerability and capacitance remained unaffected under eCO2. Independently of the CO2 treatment, elastic, and inelastic water pools depleted simultaneously after 50% of complete stomatal closure. Our results suggest that the effect of eCO2 on drought physiology and wood traits are small and variable during the growing season and question a sequential capacitive water release from elastic and inelastic pools as drought proceeds.
Elevated CO2 has limited season-dependent effects on anatomical and hydraulic traits of aspen trees with increased xylem vulnerability to embolism occurring during early but not late season drought.
Introduction
Forests are exposed to unprecedented climate changes driven by a rapid rise in atmospheric CO2 concentration ([CO2]). As a consequence, air temperature is rapidly increasing and precipitation patterns are altering, often leading to longer and more intense drought episodes (IPCC, 2018). Across a wide variety of species and biomes, hydraulic failure has been suggested as the predominant underlying cause of drought-induced mortality (McDowell, 2011; Adams et al., 2017). Although tree hydraulic architecture is genetically determined to a large extent (Challis et al., 2020; Pritzkow et al., 2020), resource availability and environmental conditions can alter tree allometry and xylem traits (Diaconu et al., 2016; Deslauriers et al., 2017). Therefore, exposure to elevated [CO2] (eCO2) may also affect anatomical traits and determine the tree’s response to drought (Tognetti et al., 1999; Domec et al., 2017; Bartlett et al., 2019).
When facing drought, stomatal closure limits water losses (Choat et al., 2018). Nonetheless, residual water losses through leaf cuticle (Kerstiens, 1996) and bark (Oren and Pataki, 2001) further reduce tree water status (Choat et al., 2018; Körner, 2019; Machado et al., 2020). When reaching the critical xylem water potential (Ψxylem) for drought-induced embolism formation, tension developed in xylem conduits may disrupt the continuous water column leaving an inactive air-filled conduit (Sperry, 2000; Venturas et al., 2017). Propagation of embolism events throughout the xylem may cause systemic failure of the vascular system and ultimately tree death (Adams et al., 2017; Hammond et al., 2019). To assess hydraulic vulnerability, the relationship between loss of xylem hydraulic conductivity (kh) and Ψxylem, (i.e. vulnerability curve) can be established (Cochard et al., 2013; Nolf et al., 2015; De Baerdemaeker et al., 2019a; Sergent et al., 2020).
Capacitive release of internal water pools buffers Ψxylem reductions, and therefore delays drought-induced embolism (Tyree and Ewers, 1991; Meinzer et al., 2009; Choat et al., 2018). Desorption curves (DCs) describe the relation between water content and Ψxylem, with the hydraulic capacitance being defined as the corresponding slope (Zweifel et al., 2001; Steppe et al., 2006; Steppe, 2018). Since trees store water in different tissues, DCs are partitioned into different phases, each characterized by its corresponding capacitance (Tyree and Yang, 1990; Pratt and Jacobsen, 2017; Choat et al., 2018; Steppe, 2018). With decreasing Ψxylem, water is assumed to be sequentially retracted from capillary water pools (i.e. intercellular spaces or lumen of previous embolized conduits), elastic water pools (i.e. mostly living cells in the bark), and inelastic pools (embolized conduits; Tyree and Yang, 1990; Tyree and Ewers, 1991; Zweifel et al., 2000; Zweifel et al., 2001; Steppe et al., 2006; Hölttä et al., 2009; De Swaef et al., 2015; Vergeynst et al., 2015a). The daily contribution of elastic water to the transpiration stream can be approached with highly-resolved measurements of stem diameter variations (Steppe et al., 2015; De Swaef et al., 2015; Zweifel, 2016). Sub-daily depletion and refilling of stem water pools result in radial stem shrinkage and swelling, but do not account for the cumulative water losses (De Swaef et al., 2009), which progressively limit stem hydraulic capacitance (Salomón et al., 2017). To circumvent this issue, tree water deficit (TWD) was introduced as a measure of stem water depletion (Zweifel, 2016) and has proven to be a reliable indicator for water status in several tree species (Dietrich et al., 2018; Krejza et al., 2020).
Tree tolerance to drought is determined by wood anatomical traits (e.g. conduit diameter and pit membrane thickness) and physiological functioning (e.g. stomatal regulation and hydraulic capacitance; Choat et al., 2018; McCulloh et al., 2019), which both can acclimate to changing environmental conditions, including [CO2] (Domec et al., 2017; Qaderi et al., 2019). Exposure to eCO2 commonly results in photosynthetic stimulation and stomatal closure (Ainsworth and Rogers, 2007), increasing carbon availability (Norby et al., 2005), and altering hydraulic conductivity throughout tree organs (Hao et al., 2018), respectively. Increased carbon availability may result in faster growth rates with development of wider conduits, favoring hydraulic efficiency (e.g. Domec et al., 2010; Kostiainen et al., 2014; Kim et al., 2015). Enhanced carbon availability may also result in stimulated cell wall deposition, thereby favoring mechanical strength (e.g. Saxe et al., 1998; Atwell et al., 2003; Domec et al., 2010; Domec et al., 2016). Additional thickening of xylem cell walls under eCO2 is expected to improve resistance to embolism formation, as enhanced mechanical strength and robustness of the pit membranes decrease the risk of embolism propagation (Li et al., 2016). On the other hand, wider vessels may increase the chance of a failing pit triggering embolism propagation (Wheeler et al., 2005; Christman et al., 2012). During the early 1990s, Tyree and Alexander (1993) already called for much-needed research on drought vulnerability under eCO2. Nevertheless, the effects of eCO2 on hydraulic vulnerability remain largely unexplored. To the best of our knowledge, so far only seven eCO2 studies established vulnerability curves in tree species under eCO2 with results remaining inconclusive (Table 1). Adding further complexity, xylem traits and vulnerability to embolism can vary over the season following phenological stages of wood formation. The P50 value (Ψxylem corresponding with 50% loss of kh) has long been considered a static parameter. A recent study on grapevine (Vitis vinifera) leaves, however, challenged this assumption as P50 decreased from the early to the late season according to changes in vessel size and pit membrane thickness (Sorek et al., 2020). Therefore, eCO2 effects on xylem vulnerability might also depend on the timing of the drought event.
Table 1.
Compilation of studies investigating the effect of elevated CO2 concentration (eCO2) on the xylem vulnerability of stems and branches in tree species
| Species | Tree age | eCO2 set-up | Method | eCO2 effect on vulnerability | Reference |
|---|---|---|---|---|---|
| Five broadleaved tree species | 3–9 m | Natural eCO2 spring (500–1,000) | Hydraulic methoda | Vulnerability was not affected | Tognetti et al. (1999) |
| Quercus ilex L. | 16- to 17-months-old | TC (750–700) | Air-injectionb | Vulnerability was not affected | Gartner et al. (2003) |
| Pinus taeda | 13.7–19.6 m | FACE (aCO2 + 200) | Centrifugal forcec | Vulnerability increased in Liquidambar styraciflua and C. florida
|
|
|
4.1–7.8 m | Domec et al. (2010) | |||
| Liquidambar styraciflua L. | 19-years-old | FACE (525–555) | Air-injectionb | Vulnerability increased | Warren et al. (2011) |
| Quercus suber L. | 18-months-old | TC (700) | Hydraulic methoda | Vulnerability was not affected | Vaz et al. (2012) |
| Six broadleaved trees | 1-year-old | TC (600) | Centrifugal forcec | Vulnerability was not affected | Hao et al. (2018) |
| Pinus banksiana Lamb. | 1-year-old | TC (900) | Air pressured | Vulnerability was not affected | Newaz et al. (2018) |
The species under study, tree age or height, eCO2 experimental set-up, applied method, and the main effects of eCO2 are summarized. The eCO2 setup specifies whether free-air carbon dioxide enrichment (FACE) or treatment chambers (TCs) were applied, and the CO2 concentration to which trees were subjected (ppm). Details on the applied methods are explained in
To assess the effects of eCO2 on tree physiology under drought, we integrated measurements of leaf stomatal behavior, stem shrinkage, vulnerability to embolism formation, and stem water content along gradients of drought stress (Ψxylem) with wood anatomical traits. For this, young European aspen (Populus tremula L.) trees, a species with diffuse-porous wood anatomy, were grown in treatment chambers under ambient (aCO2) or elevated (eCO2) [CO2]. Drought was imposed early (spring/summer 2019) and late (summer/autumn 2018) during the growing season to further assess seasonality in the hydraulic response to eCO2. In vivo drought responses were measured at leaf (stomatal conductance) and stem (TWD) level. In parallel, xylem anatomical traits, vulnerability to drought-induced vessel embolism formation, and hydraulic capacitance were determined by means of the bench dehydration method. For this, simultaneous measurements of Ψxylem, embolism-related acoustic emissions (AEs; Nolf et al., 2015; De Roo et al., 2016; see methodological considerations below) and stem volumetric water content (VWC; Vergeynst et al., 2015a) were carried out.
We hypothesize that the effect of eCO2 on xylem vulnerability is dependent on the timing of the drought event, with higher vulnerability during the early season. This is a result of a growth stimulation by CO2 fertilization (Lauriks et al., 2021) leading to the development of wide and thin-walled vessels which offer limited resistance to run-away embolism. By contrast during the late season, stimulated cell wall deposition under eCO2 (Lauriks et al., 2021) might enhance wood mechanical strength and counteract detrimental effects of rapid growth on hydraulic safety. Independent of the [CO2] treatment, we expect drought responses to be sequential, with limitation of leaf-level water loss followed by consecutive water release from elastic and inelastic tree water pools, the latter in concert with embolism propagation.
Results
Wood anatomical characteristics
Transverse stem sections of 1-year-old aspen trees grown under different [CO2] treatments and harvested during early and late seasonal experiments are shown in Figure 1A. Average vessel diameter (dv) was larger under eCO2 during the early season experiment (ESE hereafter), while the opposite was found during the late season experiment (LSE hereafter; P < 0.0001; Table 2). However, changes in dv under eCO2 did not substantially affect vessel efficiency since no moderate differences in overall hydraulic vessel diameter (dh_all), vessel conductivity (kh_all), or vessel grouping index (vg) were detected (P > 0.1). Also other wood anatomical traits related to mechanical strength, i.e. vessel density (VD), non-vessel fraction (Fnv), and stem wood density (), were not affected by the [CO2] treatment (P > 0.1; Table 2). The [CO2] treatment had a small impact on the relative frequency of vessel diameters (P < 0.1, Figure 1B), as a moderate decrease in relative vessel abundancy was only observed for narrow vessels within the 20 - 30 µm class under eCO2 during ESE. Under both [CO2] treatments and during ESE, vessels with diameters within the 20 - 40 µm were more frequent (P < 0.05), and the 30–40 µm class contributed most to overall hydraulic conductivity (kh; Figure 1B). The relative contribution of each vessel size class to kh (kh_class) was not affected under eCO2 during ESE or LSE (P > 0.1).
Figure 1.
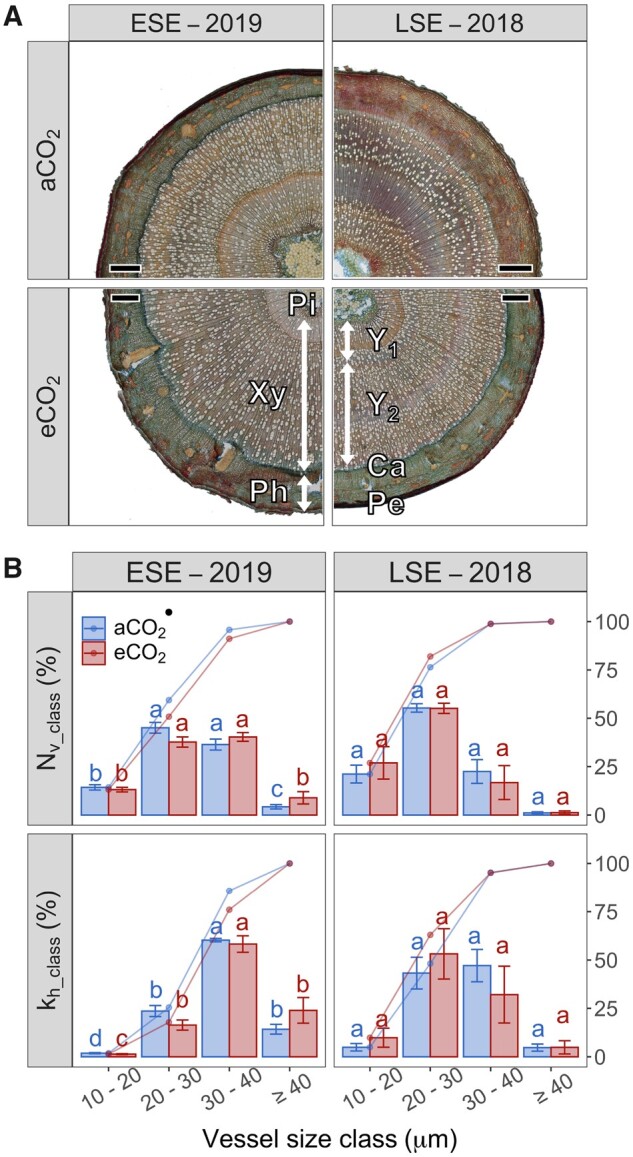
Effect of CO2 enrichment and seasonal drought on wood anatomical traits. A, Transverse stem sections of studied aspen trees and (B) relative (bar plot) and cumulative (line plot) abundancy of vessels classified by four size classes (Nv_class, upper panels) and their relative contribution to overall hydraulic conductance (kh_class, lower panels) during the early (ESE—2019) and the late (LSE—2018) season experiment. Trees were subjected to different levels of atmospheric [CO2] (ambient [aCO2] and elevated [eCO2]). Scale bars correspond with 1 mm. Lignified and non-lignified cell walls are colored red and blue, respectively, with distinction of cambium (Ca), periderm (Pe), phloem (Ph), pith (Pi), and xylem (Xy) from the first year (Y1) and the second year (Y2). Bar plot and error bars indicate the mean and standard error, respectively. Letters indicate differences in Nv_class and kh_class contributions within each [CO2] treatment and seasonal experiment (Wilcoxon test, P < 0.05). Difference between aCO2 and eCO2 (n = 4 for ESE and LSE) within each diameter class are also indicated (linear model, •P < 0.1).
Table 2.
Mean value and standard error of the wood anatomical characteristics measured during the early (ESE—2019) and late (LSE—2018) season experiment under different [CO2] treatments (aCO2 and eCO2 for the ambient and elevated [CO2] treatment, respectively)
| Trait | Unit | ESE—2019 |
LSE—2018 |
||
|---|---|---|---|---|---|
| aCO2 | eCO2 | aCO2 | eCO2 | ||
| dv | µm | 28.16 ± 0.04 | 29.55 ± 0.05* | 26.44 ± 0.04 | 25.64 ± 0.05* |
| dh_all | µm | 30.40 ± 0.62 | 31.98 ± 0.73 | 27.35 ± 1.23 | 25.88 ± 2.05 |
| VD | mm−2 | 206.3 ± 26.2 | 157.6 ± 14.3 | 266.4 ± 28.5 | 229.0 ± 19.0 |
| kh_all | kg m−1 MPa−1 s−1 | 4.26 ± 0.41 | 4.00 ± 0.29 | 3.88 ± 0.95 | 2.72 ± 0.78 |
| vg | – | 1.38 ± 0.03 | 1.45 ± 0.09 | 1.52 ± 0.11 | 1.34 ± 0.05 |
| Fnv | – | 0.86 ± 0.01 | 0.89 ± 0.01 | 0.85 ± 0.02 | 0.89 ± 0.02 |
| kg m−3 | 362.82 ± 17.39 | 339.31 ± 17.98 | 294.03 ± 22.88 | 322.81 ± 11.31 | |
dv the average vessel diameter, dh_all the hydraulic vessel diameter, VD the vessel density, kh_all the vessel hydraulic conductivity, vg the vessel grouping index, Fnv the non-vessel fraction, and the stem wood density. Differences between aCO2 and eCO2 are indicated (parametric t test, •P < 0.1, *P < 0.05). With n = 4.
Stem vulnerability and DCs
AE sensors were used for the detection of embolism events and the determination of acoustic vulnerability curves (VCAE; Figure 2) in four trees per [CO2] treatment during both seasonal experiments. The xylem water potential (Ψxylem) corresponding with 88% of embolism-related AE signals (AE88,) was less negative under eCO2 during ESE (P < 0.05, Table 3). Although this trend of increased xylem vulnerability under eCO2 during ESE seemingly held for Ψxylem corresponding with 12% (AE12) and 50% (AE50) of embolism related AE (Figure 2), differences between [CO2] treatments were not statistically significant (P = 0.14 and 0.12 for AE12 and AE50, respectively). During LSE, VCAE and corresponding thresholds were not affected by the [CO2] treatment (P > 0.1). Accordingly, DCs, indicating the loss of VWC over a Ψxylem gradient (Figure 2), were only altered under eCO2 during ESE. Although elastic capacitance (Cel) at mild drought stress did not differ between [CO2] treatments (P > 0.1; Table 3), inelastic capacitance (Cinel) at more severe stress levels was larger under eCO2 during ESE (P < 0.05) and the breakpoint of DCs, separating the elastic from the inelastic phase, was less negative under eCO2 during ESE (P < 0.05; Table 3), suggesting greater and earlier (in terms of drought stress) capacitive water release from embolized vessels. During LSE, the [CO2] treatment did not affect Cel, Cinel, or Ψxylem separating the elastic and inelastic depletion phase (P > 0.1).
Figure 2.

Effect of CO2 enrichment on hydraulic vulnerability and capacitance during the early and late season. Acoustic vulnerability curves (VCAE, upper panels) and DCs (lower panels) during early (ESE—2019) and late (LSE—2018) season bench dehydration experiments. Trees were subjected to different levels of atmospheric [CO2] (ambient [aCO2] and elevated [eCO2]). Xylem water potential (Ψxylem) at which 12%, 50%, and 88% of the embolism-related AE occur (AE12 [●], AE50 [▲], AE88 [∎], respectively) are shown (upper panels; n = 4 for ESE and LSE). Blue and red lines on the DCs display the Ψxylem range of elastic and inelastic water release, respectively. Corresponding hydraulic capacitances (elastic and inelastic) are calculated as the slope of the linear relationship between VWC and Ψxylem (n = 3 and 4 for ESE and LSE, respectively, under aCO2, and n = 4 for ESE and LSE under eCO2). Shaded areas indicate the standard error of each curve.
Table 3.
Average value and standard error of the hydraulic vulnerability thresholds and capacitances measured during the early (ESE—2019) and late (LSE—2018) season experiment and under different [CO2] treatments (aCO2 and eCO2 for ambient and elevated [CO2] treatment, respectively)
| ESE—2019 |
LSE—2018 |
||||
|---|---|---|---|---|---|
| aCO2 | eCO2 | aCO2 | eCO2 | ||
| Vulnerability curves | |||||
| AE12 | MPa | −2.60 ± 0.13 | −1.99 ± 0.31 | −1.97 ± 0.25 | −1.86 ± 0.11 |
| AE50 | MPa | −3.02 ± 0.14 | −2.47 ± 0.25 | −2.50 ± 0.22 | −2.28 ± 0.03 |
| AE88 | MPa | −3.39 ± 0.08 | −2.86 ± 0.12* | −2.70 ± 0.21 | −2.54 ± 0.02 |
| DCs | |||||
| Cel | kg m−3 MPa−1 | 206.1 ± 71.4 | 147.1 ± 32.6 | 119.4 ± 25.0 | 265.2 ± 148.7 |
| Cinel | kg m−3 MPa−1 | 136.1 ± 22.0 | 341.4 ± 43.5* | 175.9 ± 24.4 | 279.6 ± 66.3 |
| Ψ bp | MPa | −2.62 ± 0.13 | −2.42 ± 0.12* | −2.15 ± 0.13 | −2.28 ± 0.21 |
Hydraulic vulnerability is defined by the threshold water potentials corresponding with 12% (AE12), 50% (AE50), and 88% (AE88) of the embolism-related AE signals (n = 4 for ESE and LSE). Hydraulic capacitance is characterized by capacitance of the elastic (Cel) and inelastic (Cinel) water pools. The breakpoint of the segmented DC separating the elastic and inelastic depletion phase is also shown (Ψbp; n = 3 and 4 for ESE and LSE, respectively, under aCO2 and n = 4 for ESE and LSE under eCO2). Differences between aCO2 and eCO2 are indicated (parametric t test, •P < 0.1, *P < 0.05).
Microclimate and effectiveness of the in vivo drought stress treatments
Daily averages of microclimatic variables during daytime and along the duration of the in vivo seasonal drought treatments are shown in Supplemental Figure S1. Chamber [CO2] was 448.16 ± 5.00 ppm (aCO2) and 698.86 ± 13.48 ppm (eCO2) during ESE, and 440.41 ± 8.67 ppm (aCO2) and 694.29 ± 10.75 ppm (eCO2) during LSE. Daytime photosynthetic photon flux density (PPFD) and temperature (T) did not differ between [CO2] treatment chambers and averaged 568.76 ± 24.20 µmol m−2 s−1 and 27.08 ± 0.54°C during ESE, and 463.12 ± 16.65 µmol m−2 s−1 and 24.10 ± 2.65°C during LSE. Chamber vapor pressure deficit (VPD) did not differ between chambers during ESE (P > 0.1; 1.34 ± 0.06 kPa), but was reduced under eCO2 during LSE (P < 0.0001; 1.44 ± 0.07 kPa and 1.05 ± 0.08 kPa under aCO2 and eCO2, respectively), presumably as a result of enhanced transpiration related to stimulated leaf area development under eCO2. Variability in midday Ψxylem over time (Supplemental Figure S1) was small under well-watered conditions with an average Ψxylem of −0.67 ± 0.04 MPa and −0.98 ± 0.02 MPa during ESE and LSE, respectively. Drought stress reduced Ψxylem over time under both aCO2 and eCO2. The [CO2] treatment did not affect Ψxylem under well-watered or drought conditions (P > 0.1).
Stomatal conductance and TWD responses to in vivo drought stress
Under well-watered conditions, stomatal conductance (gs) was not altered by the [CO2] treatment during ESE or LSE (P > 0.1). Contrastingly, drought stress reduced gs under both aCO2 and eCO2 and during both seasonal experiments (P < 0.0001). The sigmoidal fits between relative gs loss and Ψxylem, established for the drought-stressed trees, are shown in Figure 3 with corresponding parameters in Table 4. During ESE, eCO2 slightly flattened the slope of the gs curve (P < 0.1), but did not affect its inflection point (P > 0.1), denoting a moderately earlier onset of stomatal closure followed by a more gradual drought-induced gs reduction. In contrast and during LSE, eCO2 did not affect the slope of the gs curve (P > 0.1) but the inflection point was shifted to more negative Ψxylem (P < 0.05), denoting a delayed stomatal closure. At the onset of the drought stress event, stem diameter did not differ between [CO2] treatments during ESE (P > 0.1), but was larger under eCO2 during LSE (P < 0.05; Figure 4). Throughout both seasonal experiments and under both [CO2] treatments, well-watered trees kept growing throughout the surveyed period. Daily stem volumetric growth (i.e. the difference in stem diameter maximum between two consecutive days, commonly registered at pre-dawn) was stimulated under eCO2 during ESE (P < 0.1), but remained unaltered during LSE (P > 0.1). When facing drought, trees started to shrink (i.e. daily volumetric growth was negative) independently of the [CO2] treatment (P < 0.01) 6.9 ± 1.1 and 13.7 ± 1.2 d after onset of the drought event during ESE and LSE, respectively. The sigmoidal fits between TWD and Ψxylem were not affected by the [CO2] treatment during any of the seasonal experiments (P > 0.1; Table 4).
Figure 3.

Effect of CO2 enrichment and seasonal drought on stomatal conductance. Stomatal conductance (gs) over time (left-hand side panels) and relative gs loss with decreasing xylem water potential (ΨXylem; right-hand side panels) during the early (ESE—2019) and late (LSE—2019) season in vivo drought experiment. Trees were subjected to combined treatments of atmospheric [CO2] (ambient [a] and elevated [e]) and drought stress (well-watered [W] and drought-stressed [D]). Points and shaded areas denote average and standard error in left-hand side panels. Thin red lines show the sigmoidal relation between relative gs loss and Ψxylem for individual trees. Dashed and solid lines illustrate aCO2 and eCO2, respectively. Bold lines and shaded areas indicate model fit applying average ± SE parameter for aCO2 and eCO2 (n = 4 and 5 for ESE and LSE, respectively). With DOY day of year.
Table 4.
Average value and standard error of the parameters (a and i) of the sigmoidal curve adjusted to define the relative change in stomatal conductance (gs) and TWD with decreasing xylem water potential (Ψxylem) for the drought-stressed trees during the early (ESE—2019) and late (LSE—2018) season experiments under different [CO2] treatments (aCO2 and eCO2 for the ambient and elevated CO2 treatment, respectively)
| Variable | Season | Rate (a, MPa−1) |
Inflection point (i, MPa) |
||
|---|---|---|---|---|---|
| aCO2 | eCO2 | aCO2 | eCO2 | ||
| gs | ESE | 17.85 ± 6.27 | 3.95 ± 1.82• | −1.77 ± 0.15 | −1.46 ± 0.13 |
| LSE | 2.90 ± 0.32 | 7.27 ± 3.89 | −1.07 ± 0.11 | −1.50 ± 0.11* | |
| TWD | ESE | 2.89 ± 1.05 | 2.55 ± 0.50 | −2.39 ± 0.15 | −2.14 ± 0.21 |
| LSE | 4.74 ± 3.27 | 4.62 ± 1.05 | −1.93 ± 0.45 | −1.83 ± 0.12 | |
Differences between aCO2 and eCO2 are indicated (linear model, •P < 0.1, *P < 0.05). For gs, n = 4 and 5 for ESE and LSE, respectively. For TWD, n = 3 for ESE and LSE, respectively, under aCO2 and n = 4 and 5 for ESE and LSE, respectively, under eCO2.
Figure 4.

Effect of CO2 enrichment and seasonal drought on stem diameter variations. Stem diameter (D) over time (left-hand side panels) and relative increase of TWD with decreasing xylem water potential (Ψxylem; right-hand side panels) during the early (ESE—2019) and the late (LSE—2018) season in vivo drought experiment. Trees were subjected to combined treatments of atmospheric CO2 (ambient [a] and elevated [e]) and drought stress (well-watered [W] and drought-stressed [D]). Discrete Ψxylem measurements were linearly regressed over time to match temporal resolution (on a daily basis) of TWD and Ψxylem (average R2 = 0.71 ± 0.04). Error bars indicate the standard error of the mean stem diameter size per [CO2] treatment at the onset of the drought event and the shaded areas the standard error in the variation of stem diameter. Black lines show the preceding maximum stem diameter of the drought-stressed trees as reference to estimate TWD. Thin red lines show sigmoidal relation between TWD and Ψxylem for individual drought-stressed trees. Dashed and solid lines illustrate aCO2 and eCO2, respectively. Bold lines and shaded areas indicate model fit applying average and standard error parameter values for aCO2 (n = 3 for ESE and LSE) and eCO2 (n = 4 and 5 for ESE and LSE, respectively). With DOY day of year.
Comparison of hydraulic thresholds
Figure 5 shows the sequential variation of the surveyed variables (gs, TWD, AE; top panels) and the comparison of their threshold values (i.e. Ψxylem corresponding with 12%, 50%, and 88% of relative changes) between [CO2] treatments (lower panels). At relatively high Ψxylem (>−1.5 MPa) and during both seasonal experiments, the first response to drought was the reduction of leaf-level water loss by stomatal closure (12% stomatal closure, gs_12), followed by depletion of stem elastic water pools (12% of maximal TWD, TWD12). Initial depletion of inelastic water pools denoted by the onset of embolism formation (AE12) was thus preceded by decreased leaf-scale water loss (P < 0.01) and depletion of elastic water storage pools (P < 0.01). With decreasing Ψxylem (from −1.5 MPa to −2.5 MPa) and during ESE, Ψxylem corresponding to 50% of maximum TWD (TWD50) was moderately less negative than AE50 (P < 0.1), while differences were not significant (P > 0.1) during LSE. This denotes that half the depletion of elastic and inelastic pools occurred at similar Ψxylem. When hydraulic conductivity was mostly lost (approximately −3.0 MPa), Ψxylem corresponding to 88% of maximum TWD (TWD88) and AE88 did not differ during ESE or LSE (P > 0.1), suggesting simultaneous full depletion of elastic and inelastic water pools. Remarkably, AE12 did not significantly differ from the Ψxylem corresponding to 88% of complete stomatal closure (gs_88; under both [CO2] treatments and during both seasonal experiments; P > 0.1), indicating that drought-induced stomatal closure was almost complete when drought-induced embolism started. Regarding [CO2] treatment differences, and in addition to the less negative AE88 under eCO2 during ESE (Table 2), the [CO2] treatment also altered some of the TWD and gs thresholds. During ESE, Ψxylem corresponding to 12% of complete stomatal closure (gs_12) was moderately less negative under eCO2 (P < 0.1). Contrastingly, during LSE, Ψxylem corresponding to 12% (gs_12) and 50% (gs_50) of complete stomatal closure (P < 0.1 and < 0.05, respectively) and Ψxylem corresponding to 12% of maximum TWD (TWD12, P < 0.05) were more negative under eCO2.
Figure 5.

Relative variation of the stomatal conductance (gs, n = 4 and 5 for ESE and LSE, respectively), TWD (n = 3 for ESE and LSE, respectively, under aCO2, and n = 4 and 5 for ESE and LSE, respectively, under eCO2) and embolism-related AEs (n = 4 for ESE and LSE) with decreasing xylem water potential (Ψxylem) during the early (ESE—2019) and the late (LSE—2018) season drought experiment (upper panels) and pairwise comparison of their corresponding hydraulic thresholds (lower panels). Trees were subjected to different levels of atmospheric [CO2] (aCO2 and eCO2 for ambient and elevated [CO2], respectively). Lines and shades areas show model fit applying average and standard error parameter values under aCO2 (dashed lines) and eCO2 (solid lines). Boxplots show hydraulic thresholds corresponding with 12%, 50%, and 88% loss of each of the variables for aCO2 (light colored) and eCO2 (dark colored). Center line, box limits, whiskers, and points in the boxplot denote median, upper and lower quartiles, 1.5 × interquartile range, and outliers, respectively. Letters indicate difference between variables (linear mixed effect model, P < 0.05, pooling aCO2 and eCO2 data). Differences between [CO2] treatments for each threshold are also indicated (linear model, •P < 0.1, *P < 0.05).
Discussion
Effects of eCO2 on wood anatomy and hydraulic vulnerability
At the wood anatomical level, rapid stem growth is often positively related to wider vessels to meet tree water needs for transpiration and negatively related to wood density to maximize volumetric growth for a given carbon cost (e.g. Poorter et al. 2010; Martínez-Cabrera et al. 2011). Recent reviews confirm an overall increase in conduit diameter and xylem conductivity in woody species exposed to eCO2 (Domec et al., 2017; Qaderi et al., 2019). In the young aspen trees under study and during ESE, volumetric stem growth was stimulated under eCO2 in well-watered trees (Lauriks et al., 2021), explaining the overall wider vessel diameter under eCO2 at this time. Despite the increase in average vessel diameter, vessel hydraulic diameter, and conductivity, both proxies of hydraulic efficiency, remained unaltered under eCO2 during ESE. In concert with the effect of eCO2 on vessel width during the early season, (1) vulnerability curves apparently shifted toward less negative Ψxylem, with significant differences being found for AE88, (2) the breakpoint of the DCs shifted toward less negative Ψxylem, and (3) inelastic water release from embolized vessels increased. Taken together, these observations suggest eCO2 increased hydraulic vulnerability while hydraulic conductivity remained relatively constant during the early season drought. Wood features not surveyed here may partly explain such eCO2 effect on hydraulic vulnerability and conductivity. Pit membrane thickness has been suggested to be a key trait to prevent rapid spread of air throughout the xylem (Li et al., 2016; Venturas et al., 2017; Kaack et al., 2021), hence determining xylem resistance to drought-induced embolism. Taking into account the direct relationship between wood density and pit membrane thickness (Jansen et al., 2009), we speculate that greater hydraulic vulnerability under eCO2 during ESE could be related to the non-significant reduction in wood density, and potentially thinner pit membranes.
During the late season, overall vessel diameter was wider under aCO2 than eCO2. Two factors might explain this unexpected and opposite effect of eCO2 on vessel width during LSE. First, after cell division and enlargement during the early season, cell wall deposition and thickening occur during late phenological phases of wood formation (Cuny et al., 2015). During this period, increased carbon availability, as a result of An stimulation (Lauriks et al., 2021), under eCO2 might result in enhanced secondary cell wall thickening (e.g. Domec et al., 2010, 2016) at the expense of vessel lumen area, as hinted here by non-significant increases in non-vessel fraction and wood density. Second, stimulated development of late-wood vessels under eCO2 may also contribute to a reduction of the average vessel diameter, as suggested here by the relative vessel abundance by size classes. In any case, any potential alteration in wood traits during LSE did not affect xylem vulnerability to drought-induced embolism according to similar vulnerability curves and inelastic capacitance for both [CO2] treatments. Our results, therefore, highlight that wood phenology should be considered when studying possible alterations in wood traits and hydraulic vulnerability under eCO2, which merits further effort to better predict plant hydraulic functioning in future climates.
Independent of the [CO2] treatment, 50% of embolism-related acoustic emissions (AE50) occurred at −2.74 ± 0.17 MPa and −2.39 ± 0.11 MPa during ESE and LSE, respectively. Drought vulnerability to embolism formation in the young trees under study was therefore at the lower (i.e. more negative) end of reported P50 values across Populus spp. (from −1.1 to −3.0 MPa; Fichot et al., 2015; Guet et al., 2015; Pivovaroff et al., 2016; De Baerdemaeker et al., 2017; Venturas et al., 2019; Zhang et al., 2020). Large variability in P50 among studies can be explained by differences in hydraulic vulnerability across plant organs (Choat et al., 2005) and differences between measurement techniques. For instance, in branches of P. trichocarpa, P50 values spanned a 2 MPa range among four widely used approaches: the optical method, the hydraulic method, the centrifuge method, and X-ray computed microtomography (microCT; Venturas et al., 2019). In this line, the acoustic method applied here for assessment of hydraulic vulnerability adds a fifth approach (Steppe et al., 2022). It is now well-known that the originally expected one-to-one relation between the number of registered AE signals and embolism events is often lacking (Tyree et al., 1984; Rosner et al., 2006) as different drying-related sources of AEs exist (Vergeynst et al., 2016; Steppe et al., 2022), even after full loss of hydraulic conductivity (Wolkerstorfer et al., 2012). Insight that Ψxylem corresponding to full loss of hydraulic conductivity can be mathematically determined (Vergeynst et al., 2015a), that waveform features can be surveyed for accurate selection of embolism-related acoustic signals, and that water potential values that represent a species’ vulnerability to drought-induced embolism can be derived from non-filtered AE-signals (Vergeynst et al., 2016) recently established the acoustic method as reliable and state-of-the-art measurement technique in drought-induced embolism research (Steppe et al., 2022). A recent study in Fraxinus excelsior comparing VCs developed with the AE method and microCT furthermore indicated close resemblance between approaches, with only slight improvements when machine learning was applied to filter embolism-related acoustic activity compared to using all registered AE-signals (De Baerdemaeker et al., 2019b). Similarly, unfiltered acoustic signals enabled reliable estimation of VCs when compared to the cryo-scanning electron microscopy technique in leaves of four evergreen species (Johnson et al., 2009), and to the hydraulic method in trunk wood of Picea abies (Rosner et al., 2006) and branches of Malus domestica (De Baerdemaeker et al., 2019a). Differences between state-of-the-art measurement techniques may still result from differences in the way kh losses are quantified. For example, the optical and acoustic method focus on the number of embolism events, which is not necessarily proportional with the loss of kh as this is dependent on the size of the embolized conduit according to Equation 2. However, this difference might be small in diffuse-porous Populus spp. with relatively homogeneous vessel size along the stem radial profile (Figure 1A).
Stomatal regulation and TWD under drought and elevated CO2
During the early and late season drought, the [CO2] treatment affected the onset and rate of stomatal closure with declining tree water status and eCO2 effects differed between seasonal experiments. During ESE, gs reduction started earlier and was more gradual under eCO2. High atmospheric [CO2] facilitates maintenance of relatively high [CO2] in the sub-stomatal cavities despite partial stomatal closure. When facing moderate drought, this advantage of CO2 fertilization might gain importance as an earlier and more gradual stomatal closure favors water savings (e.g. Goodfellow et al., 1997; Herrick et al., 2004; Robredo et al., 2007; Drake et al., 2017a; Pathare et al., 2017; Birami et al., 2020). As drought proceeds, limited leaf-level water loss can help to maintain the integrity of the hydraulic system, as an earlier stomatal closure is often associated with higher xylem vulnerability to drought-induced embolism (Brodribb et al., 2014, 2017; Choat et al., 2018), which is consistent with the shift in the VCAE observed here. Contrastingly, stomatal closure was delayed under eCO2 during LSE. Limited sensitivity of gs to soil drought under eCO2 has previously been observed in beech (Fagus sylvatica L.), chestnut (Castanea sativa Mill.), and oak (Quercus robur L.) trees (Heath, 1998), as well as in tomato (Solanum lycopersicum L.; Liu et al., 2019) and other crop species (Haworth et al., 2016). It might be mediated by an eCO2-induced disruption of the ABA (abscisic acid) signal transduction pathway (Li et al., 2020), in turn likely affected by leaf phenology (Mcadam and Brodribb, 2015). Regardless of the underlying mechanisms explaining differential stomatal behavior under eCO2, our results highlight that stomatal responses to interactive effects of drought and eCO2 are season dependent. An earlier stomatal closure under eCO2 during ESE may reflect differences in xylem hydraulic vulnerability, whereas delayed stomatal closure under eCO2 during LSE seems to be decoupled from xylem integrity, as denoted by similar VCs for both [CO2] treatments.
In vivo measurements of stem, shrinkage suggests that the progressive depletion of elastic water pools (TWD) was unaffected by eCO2. Accordingly, estimates of elastic capacitance (Cel) derived from DCs via bench dehydration did not differ between [CO2] treatments. Independent of the [CO2] treatment, Cel in the young European aspen trees surveyed here varied from 119 to 265 kg m−3 MPa−1, which is in agreement with values previously obtained in ten small-sized (≤3 m height) angiosperm trees (20–280 kg m−3 MPa−1; Scholz et al., 2011). Reliance on stored water to maintain transpiration requirements and stem hydraulic capacitance commonly increase with stem size (Phillips et al., 2003; Scholz et al., 2011). However, despite the eCO2-induced stimulation of stem diameter at onset of the late season drought event, differences in size might still be insufficient to affect the stem elastic water pools. Long-term experiments would be necessary to detect eCO2-induced differences in elastic hydraulic capacitance. Nevertheless, we speculate that potential differences would result from biophysical responses to eCO2 rather than from physiological acclimation.
Sequential down-regulation of tree water losses and depletion of water pools
Stomatal closure was the first response to declining tree water status under both aCO2 and eCO2. Remarkably, almost complete stomatal closure (approximated by 88% of complete stomatal closure, gs_88) and onset of embolism formation (12% of embolism-related AEs, AE12) occurred at a similar Ψxylem. The reduction of leaf-level water loss to delay further increases in xylem tension and avoid lethal drought-driven embolism reveals a strict stomatal regulation. Such conservative hydraulic behavior prioritizes the safeguarding of the vascular system integrity to the detriment of a limited carbon uptake to fulfill metabolic requirements (Brodribb et al., 2017; Choat et al., 2018), even in the young surveyed aspen trees which cannot rely to a great extent on stored carbohydrates (Wertin and Teskey, 2008), a strategy already observed in several plant species (Hochberg et al., 2017; Choat et al., 2018; Li et al., 2018; Blackman et al., 2019).
Progressive depletion of capillary, elastic, and inelastic stem water pools under drought stress remains comparatively less studied than stomatal closure and embolism formation (Körner, 2019; Martinez-Vilalta et al., 2019). Capacitive water release from capillaries and elastic pools buffers rapid reductions in Ψxylem to meet transpiration requirements on a sub-daily basis (Zweifel et al., 2001; Steppe et al., 2012; Steppe et al., 2015; De Swaef et al., 2015), while further seasonal depletion of elastic living pools delays Ψxylem reductions when facing prolonged drought stress (Vergeynst et al., 2013; Salomón et al., 2017). Only when Ψxylem exceeds critical thresholds, inelastic water release from embolized conduits is expected to occur, transiently reducing the risk of runaway embolism (Hölttä et al., 2009). This theoretical DC (Tyree and Yang, 1990; Vergeynst et al., 2015a; Pratt and Jacobsen, 2017; Choat et al., 2018; Steppe, 2018) leads to the widely accepted idea of sequential dehydration patterns. Accordingly, stems started to shrink before onset of embolism formation (TWD12 > AE12). However, with declining tree water status and starting after 50% of stomatal closure (gs_50), comparison of TWD and AE trends indicate a parallel rather than sequential depletion of stem elastic and inelastic water pools (TWD50 ≈ AE50 and TWD88 ≈ AE88). This dehydration pattern is consistent with recent microCT studies performed to assess temporal and spatial variability in xylem dehydration. In C. dentata (Knipfer et al., 2019), Eucalyptus camaldulensis (Nolf et al., 2017), and Laurus nobilis L. (Nardini et al., 2017), dehydration of non-conducting xylem tissue (i.e. living cells and dead fibers) occurred simultaneously or even after onset of embolism formation. In 2-year-old C. dentata trees, current-year xylem, closely located to the cambium layer, remained hydrated at a more negative water potential than that in the older xylem, more distant from the cambium. These observations suggest prioritization of cambial survival over maintenance of the vascular functionality since living cambial cells are crucial for drought recovery and growth resumption (Knipfer et al., 2019). The observed parallel depletion of elastic and inelastic water pools (Figure 5) after 50% of complete stomatal closure highlights that depletion of stem water pools does not simply switch from elastic to inelastic tissues and questions the classic sequential dehydration pattern merely based on the water source type. Therefore, we suggest that the initial slope of the DC can be used as an adequate proxy of the elastic capacitance at full tissue hydration (Steppe et al., 2006). With increasing levels of drought stress, however, capacitive water might be simultaneously released from elastic and inelastic pools. Hence, the slope of the final part of the segmented DC might represent an integrated hydraulic capacitance of partly depleted elastic and inelastic water pools. When aiming to disentangle the relative contribution of both elastic and inelastic water pools throughout the complete gradient of drought stress, combined measurements of stem shrinkage and proxies of conduit embolism would be helpful.
Conclusions
The [CO2] treatment differently affected average vessel diameter in young aspen (P. tremula L.) trees depending on wood phenological phases. During the early season, stimulated stem volumetric growth under eCO2 might have resulted in wider vessels and marginal reductions in wood density. Accordingly, xylem was more vulnerable to drought-induced embolism under eCO2 and hydraulic capacitance increased during severe drought stress. Hydraulic efficiency remained, however, unaltered by the [CO2] treatment, as estimated from average vessel hydraulic diameter and conductivity. Drought-driven stomatal closure was accelerated under eCO2, which might help to maintain vascular integrity of a more vulnerable hydraulic system. During the late season, greater carbon availability under eCO2 might have been allocated to cell wall thickening, hereby narrowing vessel lumen. This alteration, however, did not affect xylem hydraulic vulnerability or capacitance. Depletion of stem elastic water pools (detected with high-resolution dendrometers) remained unaffected by the [CO2] treatment during both in vivo seasonal drought experiments. Limitation of leaf-level water losses was the first tree response when facing drought, and stomatal closure was almost complete at the onset of embolism formation. Such conservative hydraulic behavior denotes prioritized maintenance of vascular integrity over carbon uptake. Despite earlier onset of the depletion of stem elastic pools relative to the inelastic ones, differences leveled off after halfway of complete stomatal closure. This underlines that the relative contribution of elastic water pools to the overall hydraulic capacitance remained significant even during vessel embolism formation. We, therefore, urge to revisit the idea of a simplified sequential depletion of elastic and inelastic water pools, as simultaneous dehydration suggests otherwise.
Materials and methods
Plant material and experimental set-up
During two consecutive years (2018 and 2019), approximately 51-year-old aspen (P. tremula L.) trees were planted in 30 L pots filled with potting soil and fertilizer (Osmocote Exact Standard 8-9M, ICL, Ipswich, UK). Young trees, with an initial stem diameter of 4.30 ± 0.20 mm, were planted (DOYs 78–79) and randomly distributed between two half-cylindrical treatment chambers (based on a 4 4 m2 square) constructed following the design of Wertin et al. (2010) and located in an open grass field (experimental site Proefhoeve, Ghent University, Belgium, 50°58'N, 3°49'E). Inside the chambers, [CO2] was continuously monitored and daytime [CO2] was regulated using a non-dispersive infrared sensor (GMT222, Vaisala, Helsinki, Finland) connected to a regulation unit. Target values were 400 ppm (hereafter ambient CO2, aCO2) and 700 ppm (hereafter elevated CO2, eCO2). Air temperature (T, 10k thermistors Epcos, Munich, Germany), relative humidity of the air (RH, Rotronic, Basserdorf, Switzerland), and photosynthetic photon flux density (PPFD, JYP PAR sensors SDEC, Rousset, France) were measured inside the chambers above the foliage, and outside the chambers 3.5 m above ground level. Inside T was regulated to approximate outside T using two cooling units (Midea, Foshan City, Guangdong, China) and a heater (AEG, Nurnberg, Germany) in each chamber. Chamber VPD was calculated from T and RH as a measure of atmospheric water demand (Allen et al., 1998).
Young trees were watered with an automated irrigation system at predawn (between 5:00 h and 6:00 h) and the amount of water provided was adjusted for each pot and throughout the season following point measurements of soil water content (ML3 ThetaKit, Delta-T Devices, Burnwell, UK). To avoid drought stress and soil water saturation, soil water content was maintained between 30% and 60% (Supplemental Figure S2; Kangur et al., 2021). For the in vivo drought measurements (see below), trees inside each chamber were randomly assigned to a well-watered or a drought stress group. This 22 factorial experimental design resulted in four treatment groups: well-watered trees under aCO2 (aW) and eCO2 (eW) and drought-stressed trees under aCO2 (aD) and eCO2 (eD). During the 2018 growing season, duration of the irrigation time was first reduced to 50% of the well-watered trees (DOY 222, 10 August) and completely ceased 1 week later (DOY 229, 17 August), with the drought treatment lasting 24 d (until DOY 253, 10 September). During the 2019 growing season, irrigation directly ceased on DOY 183 (2 July) and the drought treatment lasted 26 d. Onset of the drought events was hence imposed early (“early season experiment” or ESE) and late (“late season experiment” or LSE) during the growing season to study seasonality in the tree hydraulic response to eCO2.
Vulnerability and DCs
For the construction of vulnerability (VC) and desorption (DC) curves, four well-watered trees per [CO2] treatment were transported to the lab (DOY 183 and 240 for ESE and LSE, respectively) in their pots 1 d prior to the bench dehydration experiment. After transportation, approximately 40 leaves on branches of the upper stem half were loosely wrapped with aluminum foil to ensure hydraulic equilibrium with the stem (Begg and Turner, 1970). One day after, before the onset of the bench dehydration experiment, remaining leaves were cut at petiole level, and wounds were covered with petroleum jelly. Likewise, all leaves on branches of the lower stem half were removed and wounds were covered with petroleum jelly to ensure similar dehydration rates between stem halves. Next, stems were cut just above the pot soil level after root-soil removal and at mid-height separating the two stem halves. To avoid air-entry artifacts, cuts were executed under water followed by two additional recuts of 3 cm (Cochard et al., 2013; Wheeler et al., 2013) and sample preparation was performed in the dark with low light-intensity green operating light, limiting transpiration. Cut ends were covered with wet paper towels during sensor installation (see below) to avoid water loss prior to bench dehydration. After sensor installation, branches were dehydrated until Ψxylem could no longer be determined (i.e. approximately 2 d).
To construct VCs, embolism formation was detected using a broadband point contact AE sensor (KRNBB-PC, KRN Services, Richland, WA, USA) in the upper stem halves. To establish better acoustic coupling with AEs originating from xylem embolisms, a rectangular section of the bark (1.5 0.5 cm2) was removed and a droplet of vacuum grease (High-Vacuum Grease, Dow Corning, Seneffe, Belgium) was applied between the sensor tip and the xylem. The AE sensor was mounted and pressed against the xylem using a custom-made PVC tubular frame and a compression spring (D22050, Tevema, Amsterdam, The Netherlands). Good sensor contact was tested with the pencil lead break test (Tyree and Sperry, 1989; Sause, 2011; Vergeynst et al., 2015b). Acoustic signals were amplified by 35.6 dB (AMP-1BB-J, KRN Services, Richland, WA, USA), waveforms of 7,168 samples length were acquired at 10 MHz sample rate and signals were collected using two 2-channel PCI boards and redirected to the AEwin software (PCI-2, AEWIN E4.70; Mistras Group BV, Schiedam, the Netherlands). AE signals with amplitude below 34 dB were discarded (20–1,000 kHz electronic band pass filter) to remove noise unrelated to vessel embolism events (Beall, 2002; Steppe et al., 2009; Vergeynst et al., 2016).
To obtain continuous Ψxylem data, the linear relationship between discrete Ψxylem measurements and relative xylem shrinkage was established for the upper stem halves (with average R2 = 0.87 ± 0.01 [ESE] and R2 = 0.79 ± 0.04 [LSE]). Measurements of Ψxylem were performed on wrapped leaves using a pressure chamber (Model 600, PMS Instrument Company, Corvallis, OR, USA). At the moment of leaf cutting, collection of AE signals was paused to avoid measurement artifacts related to embolism formation induced by cutting (Venturas et al., 2017). Frequency of Ψxylem measurements varied from once to twice per hour depending on the rate of AE signal registration. Absolute xylem diameter shrinkage (ΔDxylem) was continuously measured in the upper stem halves using a dendrometer (DD-S, Ecomatik, Dachau, Germany) pressed against the xylem and located approximately 7 cm apart from the AE sensor. For this, a rectangular section of the bark (1.5 0.5 cm2) was removed and petroleum jelly was applied to prevent local water loss (Vergeynst et al., 2015a). Relative xylem shrinkage was estimated as the ratio of ΔDxylem and the initial stem diameter.
To construct DCs, lower stem halves were placed on a weighing scale (0.01 g accuracy; DK 6200, Henk Maas, Veen, The Netherlands) for continuous measurements of fresh mass during dehydration. Initial stem mass was monitored until complete vessel embolization detected in the upper counterparts. Fresh stem mass (Mfresh) and volume (V) were also measured on a 3-cm-length wood sample collected before and after bench dehydration. Wood samples were then oven-dried (80°C) until constant mass (Mdry) to estimate fresh VWC (VWC= [Mfresh–Mdry]/V) and stem wood density (=Mdry/V). Continuous VWC data were obtained by rescaling weighing scale measurements from initial (VWCi) to final (VWCf) VWC during the course of the bench dehydration experiment (Vergeynst et al., 2015a). Similar dehydration rates were assumed between upper and lower stem halves, so that continuous Ψxylem data obtained to construct VCs were used likewise to construct DCs.
Xylem anatomical traits
After bench dehydration, an additional set of wood samples of 3-cm-length (four per [CO2] treatment for both ESE and LSE) were cut from the stem segments used to construct VCs and stored in an ethanol/glycerol/water (70/20/10%vol) solution until analysis of wood anatomical traits. Wood samples (i.e. four per [CO2] treatment during ESE and LSE) were transversely cut into 35-µm-thick sections using a sledge microtome (Jung Hn-40, JUNG, Germany). Sections were stained using 0.5% w/v Astra blue, 0.5% w/v chrysoidin, and 0.5% w/v acridine red for 5 min, dehydrated in 2-propanol and mounted in Euparal (Carl Roth, Germany). Slides were observed and imaged using a Nikon Ni-U light microscope (Nikon Instruments) equipped with a Nikon DS-Fi3 digital camera.
Wood anatomical images were processed using the image-processing software FIJI (www.fiji.sc; ImageJ) with implementation of the Biovoxxel toolbox. For each stem section, xylem area (Axylem, i.e. cross-section area without bark and pit) was selected for analysis. Note that Axylem integrated two growth rings, with the second one being formed under experimental conditions. Given the limited contribution of the first growth ring to Axylem (Figure 1A), both growth rings were analyzed together for comparison with the VCs and DCs. Extended particle analysis was applied to select vessels within the 200–1,500 µm2 range (Cai and Tyree, 2010; Johnson et al., 2018) and lumen area was individually estimated per vessel. Individual vessel diameter (dv) was approximated assuming a circular vessel lumen area, and distributed into four 10 µm classes. Total number of vessels per cross-section (Nv_all) and per vessel size class (Nv_class) was determined, and individual vessel lumen area was integrated to estimate total vessel conducting area (Av_all). As a measure of mechanical strength, the non-lumen area fraction was determined as the inverse of the lumen fraction (Fnv = [Axylem – Av_all]/Axylem). Vessel grouping index (vg), defined as the ratio of total number of vessels and the sum of solitary vessels and vessels clusters (Scholz et al., 2013), was determined with the imaging software using Neighbor Analysis. Vessels were considered of the same cluster applying a distance threshold of 10 µm. The average hydraulic weighted vessel diameter (dh) was calculated (Scholz et al., 2013) for the entire xylem area (dh_all) and for each vessel diameter class (dh_class) following:
| (1) |
For calculation of dh_all, n equaled to the total number of vessels (Nv_all) and dv to their corresponding diameter. For calculation of dh_class, n was equal to the number of vessels within a single vessel size class (Nv_class) with corresponding diameter dv. Theoretical hydraulic conductivity of the whole cross-section (kh_all) and of each vessel size class (kh_class) was calculated as the proportionally constant derived from the Hagen–Poiseuille law (Equation 2; Steppe and Lemeur, 2007; Poorter et al., 2010; Scholz et al., 2013).
| (2) |
With water density (998.2 kg m−3) and is water viscosity (1.002 10−9 MPa s), both at 20°C. For calculation of kh_all, vessel density (VD) was calculated as the ratio of Nv_all and Axylem and dh equaled to dh_all. For class-specific kh_class, VD was calculated as the ratio of Nv_class and Axylem and dh equaled to dh_class.
Drought stress responses in vivo
The effects of the drought event under aCO2 and eCO2 were assessed on ten trees per [CO2] treatment (i.e. five per irrigation group). Discrete measurements (Ψxylem and stomatal conductance [gs]) were conducted around midday (11:00 h–15:00 h) once (ESE) or 2–3 times (LSE) per week on fully developed leaves located in the mid-canopy. A pressure chamber (Model 600, PMS Instrument Company) was used to measure Ψxylem in leaves loosely covered with aluminum foil at least 1 h prior to the measurement to allow hydraulic equilibrium (Begg and Turner, 1970). Stomatal conductance of the same trees was measured using a portable photosynthesis system (Li-6400, Li-Cor Inc., Lincoln, Nebraska, USA) with leaf chamber conditions set at treatment chamber target [CO2] (i.e. 400 or 700 ppm), light-saturated PAR (1,500 μmol m−2 s−1) and prevailing T and RH in treatment chambers (see Supplemental Figure S1). Depletion of stem elastic water pools was assessed in the same 10 trees by monitoring stem diameter variations (ΔD). A linear variable displacement transducer (LVDT, model DF5.0, Solartron Metrology, Leicester, UK) was installed on the stem at an approximate height of 30 cm above pot soil level. TWD was calculated in drought-stressed trees by applying the “zero growth concept” (Zweifel et al., 2016) and was estimated on a daily basis as the difference between the last maximum stem diameter and the daily minimal stem diameter measured around midday (i.e. TWD4 as defined in Dietrich et al., 2018). Measurements ceased when Ψxylem could no longer be measured in drought-stressed trees (DOYs 209 and 253 for ESE and LSE, respectively).
Data analyses
Continuous ΔD and mass data from the bench dehydration experiment were registered every minute using a custom-built acquisition board. Continuous microclimate and ΔD data from the in vivo drought experiment were registered every minute and averaged over 5 min using a data logger (CR1000, Campbell Scientific, Logan, UT, USA). Continuous data from both approaches were collected and visualized using the PhytoSense software (Phyto-IT, Gent, Belgium). All data and statistical analyses were performed using R software (R Core Team, 2018).
For the construction of the acoustic VC (VCAE), AE activity was determined as the first derivative of the cumulative number of AE signals. The end-point of the VCAE (Ψxylem corresponding to 100% of embolized vessels) was determined as the point of strongest decrease in AE activity following highest AE activity, i.e. the maximum of the third derivative of the cumulative AE curve (Vergeynst et al., 2016). To approximate relative kh loss, absolute cumulative AE values were rescaled between zero and the end-point. Water potentials corresponding with 12%, 50%, and 88% of embolism-related AE signals were calculated (AE12, AE50, and AE88, respectively). For the DCs, VWC was regressed against Ψxylem and two phases of the DC were differentiated by their breakpoint, in turn, determined by segmented linear regression (segmented package). Elastic (Cel) and inelastic (Cinel) capacitance were determined as the corresponding slopes of the linear segments.
To describe the relative change in gs and TWD with Ψxylem during the in vivo drought experiment, a sigmoidal fit (Equation 3) was applied:
| (3) |
where y is the relative variation in gs or TWD, a defines the steepness of the curve and i is the inflection point. Loss in gs was defined relative to the average gs across well-watered trees during the same day and within the same [CO2] treatment. Increase in TWD was defined relative to the individual-specific maximal TWD (TWD registered on the last day of Ψxylem measurement). Thresholds of Ψxylem corresponding with 12%, 50%, and 88% of gs reduction (gs_12, gs_50, and gs_88) or TWD increase (TWD12, TWD50, and TWD88) were calculated.
To evaluate the effect of eCO2 on tree hydraulic functioning, parametric and non-parametric tests (depending on data normality) were applied on wood anatomical traits (dv, dh_all, VD, kh_all, vg, Fnv, and ) and thresholds of embolism-related AEs (AE12, AE50, and AE88), hydraulic capacitances (Cel and Cinel), stomatal conductance (gs_12, gs_50, and gs_88), and TWD (TWD12, TWD50, and TWD88) during ESE and LSE. Differences in relative vessel size class abundancy (Nrel) and contribution to the overall kh (kh_rel) were determined using non-parametric Kruskal–Wallis test followed by post hoc multiple comparison (Wilcoxon) among vessel size classes for each [CO2] treatment. Timing of xylem embolism formation (bench dehydration), stomatal closure and stem dehydration (in vivo) with declining tree water status were compared using a linear mixed effect model (nlme package), including an autocorrelation structure due to the repeated measurement design of the experiment and with plant response type (gs, TWD and AE) as fixed effect and tree as a random factor. Post-hoc Tukey tests were applied for multiple comparison (multcomp package) among plant response types. Since inter-annual differences in trees and microclimate conditions could bias comparison between seasonal experiments, we intentionally focus on treatment comparisons within a single growing season, while avoiding seasonal comparisons for a given treatment. Strong (P < 0.05) and moderate (P < 0.10) statistical differences are reported for those tests with small sample size and statistical power to detect significant differences. Reported values refer to mean ± SE.
Supplemental data
The following materials are available in the online version of this article.
Supplemental Figure S1. Average daytime microclimate and xylem water potential during the early and late season in vivo experiment and under combined treatments of atmospheric [CO2] and drought.
Supplemental Figure S2. Average soil water content under ambient and elevated [CO2] for well-watered and drought-stressed trees.
Supplementary Material
Acknowledgments
We would like to thank lab technicians Philip Deman, Geert Favyts, and Erik Moerman for their support in the practical and technical aspects of this experiment and for the construction of the growth chambers.
Funding
Funding was provided by the Research Foundation Flanders (FWO) under research program 1S19317N granted to F.L. and under research program G094115N granted to K.S. in support of the Ph.D. work of L.D.R. R.L.S. was supported by the European Union’s Horizon 2020 research and innovation program under the Marie Skłodowska-Curie fellowship (grant agreement no. 665501), the Special Research Fund (BOF) of Ghent University for Postdoctoral Fellowships, and the Spanish Ministry of Science, Innovation and Universities (Juan de la Cierva Programme, grant IJC2018-036123-I).
Conflict of interest statement. None declared.
F.L. designed and performed the experiments, analyzed the data, wrote the article with contributions of all authors; R.L.S. designed and performed the experiments, supervised and completed the writing; L.D.R. designed and performed the experiments; W.G. conducted the wood anatomical analysis; O.L. supervised the wood anatomical analysis; K.S. designed and supervised the experiments, supervised and completed the writing.
The author responsible for distribution of materials integral to the findings presented in this article in accordance with the policy described in the Instructions for Authors (https://academic.oup.com/plphys/pages/general-instructions) is: Kathy Steppe (kathy.steppe@UGent.be).
References
- Adams HD, Zeppel MJB, Anderegg WRL, Hartmann H, Landhäusser SM, Tissue DT, Huxman TE, Hudson PJ, Franz TE, Allen CD, et al. (2017) A multi-species synthesis of physiological mechanisms in drought-induced tree mortality. Nat Ecol Evol 1: 1285–1291 [DOI] [PubMed] [Google Scholar]
- Ainsworth EA, Rogers A (2007) The response of photosynthesis and stomatal conductance to rising [CO 2]: mechanisms and environmental interactions. Plant Cell Environ 30: 258–270 [DOI] [PubMed] [Google Scholar]
- Alder NN, Pockman WT, Sperry JS, Nuismer S (1997) Use of centrifugal force in the study of xylem cavitation. J Exp Bot 48: 665–674 [Google Scholar]
- Allen RG, Pereira LS, Raes D, Smith M (1998) Crop evapotranspiration — guidelines for computing crop water requirement. FAO Irrig Drain Pap 56. Food and Agriculture Organization, Rome [Google Scholar]
- Atwell BJ, Henery ML, Whitehead D (2003) Sapwood development in Pinus radiata trees grown for three years at ambient and elevated carbon dioxide partial pressures. Tree Physiol 23: 13–21 [DOI] [PubMed] [Google Scholar]
- Bartlett MK, Detto M, Pacala SW (2019) Predicting shifts in the functional composition of tropical forests under increased drought and CO2 from trade-offs among plant hydraulic traits. Ecol Lett 22: 67–77 [DOI] [PubMed] [Google Scholar]
- Beall FC (2002) Overview of the use of ultrasonic technologies in research on wood properties. Wood Sci Technol 36: 197–212 [Google Scholar]
- Begg JE, Turner NC (1970) Water potential gradients in field tobacco. Plant Physiol 46: 343–346 [DOI] [PMC free article] [PubMed] [Google Scholar]
- Birami B, Nägele T, Gattmann M, Preisler Y, Gast A, Arneth A, Ruehr NK (2020) Hot drought reduces the effects of elevated CO2 on tree water-use efficiency and carbon metabolism. New Phytol 226: 1607–1621 [DOI] [PubMed] [Google Scholar]
- Blackman CJ, Creek D, Maier C, Aspinwall MJ, Drake JE, Pfautsch S, O’Grady A, Delzon S, Medlyn BE, Tissue DT, et al. (2019) Drought response strategies and hydraulic traits contribute to mechanistic understanding of plant dry-down to hydraulic failure. Tree Physiol 39: 910–924 [DOI] [PubMed] [Google Scholar]
- Brodribb TJ, McAdam SAM, Carins Murphy MR (2017) Xylem and stomata, coordinated through time and space. Plant Cell Environ 40: 872–880 [DOI] [PubMed] [Google Scholar]
- Brodribb TJ, McAdam SAM, Jordan GJ, Martins SCV (2014) Conifer species adapt to low-rainfall climates by following one of two divergent pathways. Proc Natl Acad Sci USA 111: 14489–14493 [DOI] [PMC free article] [PubMed] [Google Scholar]
- Cai J, Tyree MT (2010) The impact of vessel size on vulnerability curves : data and models for within-species variability in saplings of aspen, Populus tremuloides Michx. Plant Cell Environ 33: 1059–1069 [DOI] [PubMed] [Google Scholar]
- Challis A, Blackman CJ, Ahrens CW, Medlyn BE, Rymer PD, Tissue DT (2020) Adaptive plasticity in plant traits increases time to hydraulic failure under drought in a foundation tree. bioRxiv 2020.08.19.258186 [DOI] [PubMed]
- Choat B, Brodribb TJ, Brodersen CR, Duursma RA, López R, Medlyn BE (2018) Triggers of tree mortality under drought. Nature 558: 531–539 [DOI] [PubMed] [Google Scholar]
- Choat B, Lahr EC, Melcher PJ, Zwieniecki MA, Holbrook NM (2005) The spatial pattern of air seeding thresholds in mature sugar maple trees. Plant Cell Environ 28: 1082–1089 [Google Scholar]
- Christman MA, Sperry JS, Smith DD (2012) Rare pits, large vessels and extreme vulnerability to cavitation in a ring-porous tree species. New Phytol 193: 713–720 [DOI] [PubMed] [Google Scholar]
- Cochard H, Badel E, Herbette S, Delzon S, Choat B, Jansen S (2013) Methods for measuring plant vulnerability to cavitation: a critical review. J Exp Bot 64: 4779–4791 [DOI] [PubMed] [Google Scholar]
- Cochard H, Cruiziat P, Tyree MT (1992) Use of positive pressures to establish vulnerability curves. Plant Physiol 100: 205–209 [DOI] [PMC free article] [PubMed] [Google Scholar]
- Cuny HE, Rathgeber CBK, Frank D, Fonti P, Makinen H, Prislan P, Rossi S, Del Castillo EM, Campelo F, Vavrčík H, et al. (2015) Woody biomass production lags stem-girth increase by over one month in coniferous forests. Nat Plants 1: 1–6 [DOI] [PubMed] [Google Scholar]
- De Baerdemaeker NJF, Arachchige KNR, Zinkernagel J, Van Den Bulcke J, Van Acker J, Schenk HJ, Steppe K, Tognetti R (2019a) The stability enigma of hydraulic vulnerability curves: addressing the link between hydraulic conductivity and drought-induced embolism. Tree Physiol 39: 1646–1664 [DOI] [PubMed] [Google Scholar]
- De Baerdemaeker NJF, Salomón RL, De Roo L, Steppe K (2017) Sugars from woody tissue photosynthesis reduce xylem vulnerability to cavitation. New Phytol 216: 720–727 [DOI] [PubMed] [Google Scholar]
- De Baerdemaeker NJF, Stock M, Van Den Bulcke J, De Baets B, Van Hoorebeke L, Steppe K (2019b) X-ray microtomography and linear discriminant analysis enable detection of embolism-related acoustic emissions. Plant Methods 15: 1–18 [DOI] [PMC free article] [PubMed] [Google Scholar]
- De Roo L, Vergeynst LL, De Baerdemaeker NJF, Steppe K (2016) Acoustic emissions to measure drought-induced cavitation in plants. Appl Sci 10.3390/app6030071 [DOI] [Google Scholar]
- Deslauriers A, Fonti P, Rossi S, Rathgeber CBK, Gričar J (2017) Ecophysiology and plasticity of wood and phloem formation. InAmoroso MM, Daniels LD, Baker PJ, Camarero JJ, eds, Dendroecology Tree-Ring Anal. Appl. to Ecol. Stud. Springer International Publishing, Cham, pp 13–33 [Google Scholar]
- De Swaef T, De Schepper V, Vandegehuchte MW, Steppe K (2015) Stem diameter variations as a versatile research tool in ecophysiology. Tree Physiol 35: 1047–1061 [DOI] [PubMed] [Google Scholar]
- De Swaef T, Steppe K, Lemeur R (2009) Determining reference values for stem water potential and maximum daily trunk shrinkage in young apple trees based on plant responses to water deficit. Agric Water Manag 96: 541–550 [Google Scholar]
- Diaconu D, Stangler DF, Kahle HP, Spiecker H (2016) Vessel plasticity of European beech in response to thinning and aspect. Tree Physiol 36: 1260–1271 [DOI] [PubMed] [Google Scholar]
- Dietrich L, Zweifel R, Kahmen A (2018) Daily stem diameter variations can predict the canopy water status of mature temperate trees. Tree Physiol 38: 941–952 [DOI] [PubMed] [Google Scholar]
- Domec JC, Palmroth S, Oren R (2016) Effects of Pinus taeda leaf anatomy on vascular and extravascular leaf hydraulic conductance as influenced by N-fertilization and elevated CO2. J Plant Hydraul 3: e007 [Google Scholar]
- Domec JC, Schäfer K, Oren R, Kim HS, McCarthy HR (2010) Variable conductivity and embolism in roots and branches of four contrasting tree species and their impacts on whole-plant hydraulic performance under future atmospheric CO2 concentration. Tree Physiol 30: 1001–1015 [DOI] [PubMed] [Google Scholar]
- Domec JC, Smith DD, McCulloh KA (2017) A synthesis of the effects of atmospheric carbon dioxide enrichment on plant hydraulics: implications for whole-plant water use efficiency and resistance to drought. Plant Cell Environ 40: 921–937 [DOI] [PubMed] [Google Scholar]
- Drake BL, Hanson DT, Lowrey TK, Sharp ZD (2017) The carbon fertilization effect over a century of anthropogenic CO2 emissions: higher intracellular CO2 and more drought resistance among invasive and native grass species contrasts with increased water use efficiency for woody plants in the US Southwest. Glob Chang Biol 23: 782–792 [DOI] [PubMed] [Google Scholar]
- Fichot R, Brignolas F, Cochard H, Ceulemans R (2015) Vulnerability to drought-induced cavitation in poplars: Synthesis and future opportunities. Plant Cell Environ 38: 1233–1251 [DOI] [PubMed] [Google Scholar]
- Gartner BL, Roy J, Huc R (2003) Effects of tension wood on specific conductivity and vulnerability to embolism of Quercus ilex seedlings grown at two atmospheric CO2 concentrations. Tree Physiol 23: 387–395 [DOI] [PubMed] [Google Scholar]
- Goodfellow J, Eamus D, Duff G (1997) Diurnal and seasonal changes in the impact of CO2 enrichment on assimilation, stomatal conductance and growth in a long-term study of Mangifera indica in the wet-dry tropics of Australia. Tree Physiol 17: 291–299 [DOI] [PubMed] [Google Scholar]
- Guet J, Fichot R, Lédée C, Laurans F, Cochard H, Delzon S, Bastien C, Brignolas F (2015) Stem xylem resistance to cavitation is related to xylem structure but not to growth and water-use efficiency at the within-population level in Populus nigra L. J Exp Bot 66: 4643–4652 [DOI] [PubMed] [Google Scholar]
- Hammond WM, Yu K, Wilson LA, Will RE, Anderegg WRL, Adams HD (2019) Dead or dying? Quantifying the point of no return from hydraulic failure in drought-induced tree mortality. New Phytol 223: 1834–1843 [DOI] [PMC free article] [PubMed] [Google Scholar]
- Hao GY, Holbrook NM, Zwieniecki MA, Gutschick VP, BassiriRad H (2018) Coordinated responses of plant hydraulic architecture with the reduction of stomatal conductance under elevated CO2 concentration. Tree Physiol 38: 1041–1052 [DOI] [PubMed] [Google Scholar]
- Haworth M, Killi D, Materassi A, Raschi A, Centritto M (2016) Impaired stomatal control is associated with reduced photosynthetic physiology in crop species grown at elevated [CO2]. Front Plant Sci 7: 1–13 [DOI] [PMC free article] [PubMed] [Google Scholar]
- Heath J (1998) Stomata of trees growing in CO2-enriched air show reduced sensitivity to vapour pressure deficit and drought. Plant Cell Environ 21: 1077–1088 [Google Scholar]
- Herrick JD, Maherali H, Thomas RB (2004) Reduced stomatal conductance in sweetgum (Liquidambar styraciflua) sustained over long-term CO2 enrichment. New Phytol 162: 387–396 [Google Scholar]
- Hochberg U, Windt CW, Ponomarenko A, Zhang YJ, Gersony J, Rockwell FE, Holbrook NM (2017) Stomatal closure, basal leaf embolism, and shedding protect the hydraulic integrity of grape stems. Plant Physiol 174: 764–775 [DOI] [PMC free article] [PubMed] [Google Scholar]
- Hölttä T, Cochard H, Nikinmaa E, Mencuccini M (2009) Capacitive effect of cavitation in xylem conduits: results from a dynamic model. Plant Cell Environ 32: 10–21 [DOI] [PubMed] [Google Scholar]
- IPCC (2018) Summary for policymakers. In V Masson-Delmotte, P Zhai, HO Pörtner, D Roberts, J Skea, PR Shukla, et al., eds, Global warming of 1.5°C: an IPCC special report on the impacts of global warming of 1.5°C above pre-industrial levels and related global greenhouse gas emission pathways, in the context of strengthening the global response to the threat of climate change, sustainable development, and efforts to eradicate poverty, World Meteorological Organization, Geneva, Switzerland, pp 32
- Jansen S, Choat B, Pletsers A (2009) Morphological variation of intervessel pit membranes and implications to xylem function in angiosperms. Am J Bot 96: 409–419 [DOI] [PubMed] [Google Scholar]
- Johnson D, Eckart P, Alsamadisi N, Noble H, Martin C, Spicer R (2018) Polar auxin transport is implicated in vessel differentiation and spatial patterning during secondary growth in Populus. Am J Bot 105: 186–196 [DOI] [PubMed] [Google Scholar]
- Johnson DM, Meinzer FC, Woodruff DR, McCulloh KA (2009) Leaf xylem embolism, detected acoustically and by cryo-SEM, corresponds to decreases in leaf hydraulic conductance in four evergreen species. Plant Cell Environ 32: 828–836 [DOI] [PubMed] [Google Scholar]
- Kaack L, Weber M, Isasa E, Karimi Z, Li S, Pereira L, Trabi CL, Zhang Y, Schenk HJ, Schuldt B, et al. (2021) Pore constrictions in intervessel pit membranes provide a mechanistic explanation for xylem embolism resistance in angiosperms. New Phytol nph.17282. [DOI] [PubMed] [Google Scholar]
- Kangur O, Steppe K, Schreel JDM, Von Der Crone JS, Sellin A (2021) Variation in nocturnal stomatal conductance and development of predawn disequilibrium between soil and leaf water potentials in nine temperate deciduous tree species. Funct Plant Biol 10.1071/FP20091 [DOI] [PubMed] [Google Scholar]
- Kerstiens G (1996) Cuticular water permeability and its physiological significance. J Exp Bot 47: 1813–1832 [Google Scholar]
- Kim K, Labbé N, Warren JM, Elder T, Rials TG (2015) Chemical and anatomical changes in Liquidambar styraciflua L. xylem after long term exposure to elevated CO2. Environ Pollut 198: 179–185 [DOI] [PubMed] [Google Scholar]
- Knipfer T, Reyes C, Earles JM, Berry ZC, Johnson DM, Brodersen CR, McElrone AJ (2019) Spatiotemporal coupling of vessel cavitation and discharge of stored xylem water in a tree sapling. Plant Physiol 179: 1658–1668 [DOI] [PMC free article] [PubMed] [Google Scholar]
- Körner C (2019) No need for pipes when the well is dry—a comment on hydraulic failure in trees. Tree Physiol 39: 695–700 [DOI] [PubMed] [Google Scholar]
- Kostiainen K, Saranpää P, Lundqvist SO, Kubiske ME, Vapaavuori E (2014) Wood properties of Populus and Betula in long-term exposure to elevated CO2 and O3. Plant Cell Environ 37: 1452–1463 [DOI] [PubMed] [Google Scholar]
- Krejza J, Cienciala E, Světlík J, Bellan M, Noyer E, Horáček P, Štěpánek P, Marek MV (2020) Evidence of climate-induced stress of Norway spruce along elevation gradient preceding the current dieback in Central Europe. Trees Struct Funct 10.1007/s00468-020-02022-6 [DOI] [Google Scholar]
- Lauriks F, Salomón RL, De Roo L, Steppe K (2021) Leaf and tree responses of young European aspen trees to elevated atmospheric CO2 concentration vary over the season. Tree Physiol 41: 1877–1892 [DOI] [PubMed] [Google Scholar]
- Li S, Lens F, Espino S, Karimi Z, Klepsch M, Schenk HJ, Schmitt M, Schuldt B, Jansen S (2016) Intervessel pit membrane thickness as a key determinant of embolism resistance in angiosperm xylem. IAWA J 37: 152–171 [Google Scholar]
- Li S, Li X, Wei Z, Liu F (2020) ABA-mediated modulation of elevated CO2 on stomatal response to drought. Curr Opin Plant Biol 56: 174–180 [DOI] [PubMed] [Google Scholar]
- Li X, Blackman CJ, Choat B, Duursma RA, Rymer PD, Medlyn BE, Tissue DT (2018) Tree hydraulic traits are coordinated and strongly linked to climate-of-origin across a rainfall gradient. Plant Cell Environ 41: 646–660 [DOI] [PubMed] [Google Scholar]
- Liu J, Hu T, Fang L, Peng X, Liu F (2019) CO2 elevation modulates the response of leaf gas exchange to progressive soil drying in tomato plants. Agric For Meteorol 268: 181–188 [Google Scholar]
- Machado R, Loram‐Lourenço L, Farnese FS, Alves RDFB, Sousa LF, Silva FG, Filho SCV, Torres‐Ruiz JM, Cochard H, Menezes‐Silva PE (2020) Where do leaf water leaks come from? Trade‐offs underlying the variability in minimum conductance across tropical savanna species with contrasting growth strategies. New Phytol 10.1111/nph.16941 [DOI] [PubMed] [Google Scholar]
- Martínez-Cabrera HI, Jochen Schenk H, Cevallos-Ferriz SRS, Jones CS (2011) Integration of vessel traits, wood density, and height in angiosperm shrubs and trees. Am J Bot 98: 915–922 [DOI] [PubMed] [Google Scholar]
- Martinez-Vilalta J, Anderegg WRL, Sapes G, Sala A (2019) Greater focus on water pools may improve our ability to understand and anticipate drought-induced mortality in plants. New Phytol 223: 22–32 [DOI] [PubMed] [Google Scholar]
- Mcadam SAM, Brodribb TJ (2015) Hormonal dynamics contributes to divergence in seasonal stomatal behaviour in a monsoonal plant community. Plant Cell Environ 38: 423–432 [DOI] [PubMed] [Google Scholar]
- McCulloh KA, Domec JC, Johnson DM, Smith DD, Meinzer FC (2019) A dynamic yet vulnerable pipeline: integration and coordination of hydraulic traits across whole plants. Plant Cell Environ 42: 2789–2807 [DOI] [PubMed] [Google Scholar]
- McDowell NG (2011) Mechanisms linking drought, hydraulics, carbon metabolism, and vegetation mortality. Plant Physiol 155: 1051–1059 [DOI] [PMC free article] [PubMed] [Google Scholar]
- Meinzer FC, Johnson DM, Lachenbruch B, McCulloh KA, Woodruff DR (2009) Xylem hydraulic safety margins in woody plants: coordination of stomatal control of xylem tension with hydraulic capacitance. Funct Ecol 23: 922–930 [Google Scholar]
- Nardini A, Savi T, Losso A, Petit G, Pacilè S, Tromba G, Mayr S, Trifilò P, Lo Gullo MA, Salleo S (2017) X-ray microtomography observations of xylem embolism in stems of Laurus nobilis are consistent with hydraulic measurements of percentage loss of conductance. New Phytol 213: 1068–1075 [DOI] [PubMed] [Google Scholar]
- Newaz MS, Dang QL, Man R (2018) Jack pine becomes more vulnerable to cavitation with increasing latitudes under doubled CO2 concentration. Botany 96: 111–119 [Google Scholar]
- Nolf M, Beikircher B, Rosner S, Nolf A, Mayr S (2015) Xylem cavitation resistance can be estimated based on time-dependent rate of acoustic emissions. New Phytol 208: 625–632 [DOI] [PMC free article] [PubMed] [Google Scholar]
- Nolf M, Lopez R, Peters JMR, Flavel RJ, Koloadin LS, Young IM, Choat B (2017) Visualization of xylem embolism by X-ray microtomography: a direct test against hydraulic measurements. New Phytol 214: 890–898 [DOI] [PubMed] [Google Scholar]
- Norby RJ, DeLucia EH, Gielen B, Calfapietra C, Giardina CP, Kings JS, Ledford J, McCarthy HR, Moore DJP, Ceulemans R, et al. (2005) Forest response to elevated CO2 is conserved across a broad range of productivity. Proc Natl Acad Sci USA 102: 18052–18056 [DOI] [PMC free article] [PubMed] [Google Scholar]
- Oren R, Pataki DE (2001) Transpiration in response to variation in microclimate and soil moisture in southeastern deciduous forests. Oecologia 127: 549–559 [DOI] [PubMed] [Google Scholar]
- Pathare VS, Crous KY, Cooke J, Creek D, Ghannoum O, Ellsworth DS (2017) Water availability affects seasonal CO2-induced photosynthetic enhancement in herbaceous species in a periodically dry woodland. Glob Chang Biol 23: 5164–5178 [DOI] [PubMed] [Google Scholar]
- Phillips NG, Ryan MG, Bond BJ, McDowell NG, Hinckley TM, Čermák J (2003) Reliance on stored water increases with tree size in three species in the Pacific Northwest. Tree Physiol 23: 237–245 [DOI] [PubMed] [Google Scholar]
- Pivovaroff AL, Burlett R, Lavigne B, Cochard H, Santiago LS, Delzon S (2016) Testing the “microbubble effect” using the Cavitron technique to measure xylem water extraction curves. AoB Plants 8: 1–10 [DOI] [PMC free article] [PubMed] [Google Scholar]
- Poorter L, McDonald I, Alarcón A, Fichtler E, Licona JC, Peña-Claros M, Sterck F, Villegas Z, Sass-Klaassen U (2010) The importance of wood traits and hydraulic conductance for the performance and life history strategies of 42 rainforest tree species. New Phytol 185: 481–492 [DOI] [PubMed] [Google Scholar]
- Pratt RB, Jacobsen AL (2017) Conflicting demands on angiosperm xylem: tradeoffs among storage, transport and biomechanics. Plant Cell Environ 40: 897–913 [DOI] [PubMed] [Google Scholar]
- Pritzkow C, Williamson V, Szota C, Trouvé R, Arndt SK (2020) Phenotypic plasticity and genetic adaptation of functional traits influences intra-specific variation in hydraulic efficiency and safety. Tree Physiol 40: 215–229 [DOI] [PubMed] [Google Scholar]
- Qaderi MM, Martel AB, Dixon SL (2019) Environmental factors influence plant vascular system and water regulation. Plants 8: 1–23 [DOI] [PMC free article] [PubMed] [Google Scholar]
- Robredo A, Pérez-López U, de la Maza HS, González-Moro B, Lacuesta M, Mena-Petite A, Muñoz-Rueda A (2007) Elevated CO2 alleviates the impact of drought on barley improving water status by lowering stomatal conductance and delaying its effects on photosynthesis. Environ Exp Bot 59: 252–263 [Google Scholar]
- R Core Team (2018) R (3.5.2): A language and environment for statistical computing. Vienna, Austria: R Foundation for Statistical Computing [Google Scholar]
- Rosner S, Klein A, Wimmer R, Karlsson B (2006) Extraction of features from ultrasound acoustic emissions: A tool to assess the hydraulic vulnerability of Norway spruce trunkwood? New Phytol 171: 105–116 [DOI] [PMC free article] [PubMed] [Google Scholar]
- Salleo S, Hinckley TM, Kikuta SB, Lo Gullo MA, Richter H, Weilgony P, Yoon T (1992) A method for inducing xylem emboli in situ : experiments with a field-grown tree. Plant Cell Environ 15: 491–497 [Google Scholar]
- Salomón RL, Limousin JM, Ourcival JM, Rodríguez-Calcerrada J, Steppe K (2017) Stem hydraulic capacitance decreases with drought stress: implications for modelling tree hydraulics in the Mediterranean oak Quercus ilex. Plant Cell Environ 40: 1379–1391 [DOI] [PubMed] [Google Scholar]
- Sause MGR (2011) Investigation of pencil-lead breaks as acoustic emission sources. J Acoust Emiss 29: 184–196 [Google Scholar]
- Saxe H, Ellsworth DS, Heath J (1998) Tree and forest functioning in an enriched CO2 atmosphere. New Phytol 139: 395–436 [Google Scholar]
- Scholz A, Klepsch M, Karimi Z, Jansen S (2013) How to quantify conduits in wood? Front Plant Sci 4: 1–11 [DOI] [PMC free article] [PubMed] [Google Scholar]
- Scholz FG, Phillips NG, Bucci SJ, Meinzer FC, Goldstein G (2011) Hydraulic capacitance: biophysics and functional significance of internal water sources in relation to tree size. In: Meinzer F, Lachenbruch B, Dawson T, eds, Size- and age-related changes in tree structure and function, Tree Physiology, Vol 4. Springer, Dordrecht, pp. 341–361
- Sergent AS, Varela SA, Barigah TS, Badel E, Cochard H, Dalla-Salda G, Delzon S, Fernández ME, Guillemot J, Gyenge J, et al. (2020) A comparison of five methods to assess embolism resistance in trees. For Ecol Manage 10.1016/j.foreco.2020.118175 [DOI] [Google Scholar]
- Sorek Y, Greenstein S, Netzer Y, Shtein I, Jansen S, Hochberg U (2020) An increase in xylem embolism resistance of grapevine leaves during the growing season is coordinated with stomatal regulation, turgor loss point and intervessel pit membranes. New Phytol 10.1111/nph.17025 [DOI] [PubMed] [Google Scholar]
- Sperry J, Tyree MT (1988) A method for measuring hydraulic conductivity and embolism in xylem. 10.1111/j.1365-3040.1988.tb01774.x [DOI]
- Sperry JS (2000) Hydraulic constraints on plant gas exchange. Agric For Meteorol 104: 13–23 [Google Scholar]
- Sperry JS, Saliendra NZ (1994) Intra‐ and inter‐plant variation in xylem cavitation in Betula occidentalis. Plant Cell Environ 17: 1233–1241 [Google Scholar]
- Steppe K (2018) The potential of the tree water potential. Tree Physiol 38: 937–940 [DOI] [PubMed] [Google Scholar]
- Steppe K, Aggelis DG, Grosse CU (2022) AE in biological materials. InGrosse C, Ohtsu M, Aggelis D, Shiotani T, eds, Acoustic emission testing. Springer tracts in civil engineering. Springer, Cham, pp 583–619 [Google Scholar]
- Steppe K, Cochard H, Lacointe A, Améglio T (2012) Could rapid diameter changes be facilitated by a variable hydraulic conductance? Plant Cell Environ 35: 150–157 [DOI] [PubMed] [Google Scholar]
- Steppe K, Lemeur R (2007) Effects of ring-porous and diffuse-porous stem wood anatomy on the hydraulic parameters used in a water flow and storage model. Tree Physiol 27: 43–52 [DOI] [PubMed] [Google Scholar]
- Steppe K, De Pauw DJW, Lemeur R, Vanrolleghem PA (2006) A mathematical model linking tree sap flow dynamics to daily stem diameter fluctuations and radial stem growth. Tree Physiol 26: 257–273 [DOI] [PubMed] [Google Scholar]
- Steppe K, Sterck F, Deslauriers A (2015) Diel growth dynamics in tree stems: Linking anatomy and ecophysiology. Trends Plant Sci 20: 335–343 [DOI] [PubMed] [Google Scholar]
- Steppe K, Zeugin F, Zweifel R (2009) Low-decibel ultrasonic acoustic emissions are temperature-induced and probably have no biotic origin. New Phytol 183: 928–931 [DOI] [PubMed] [Google Scholar]
- Tognetti R, Longobucco A, Raschi A (1999) Seasonal embolism and xylem vulnerability in deciduous and evergreen mediterranean trees influenced by proximity to a carbon dioxide spring. Tree Physiol 19: 271–277 [DOI] [PubMed] [Google Scholar]
- Tyree MT, Alexander JD (1993) Plant water relations and the effects of elevated CO2: a review and suggestions for future research. Vegetatio 104–105:47–62 [Google Scholar]
- Tyree MT, Dixon MA, Tyree EL, Johnson R (1984) Ultrasonic acoustic emissions from the sapwood of cedar and hemlock. Plant Physiol 75: 988–992 [DOI] [PMC free article] [PubMed] [Google Scholar]
- Tyree MT, Ewers FW (1991) The hydraulic architecture of trees and other woody plants. New Phytol 119: 345–360 [Google Scholar]
- Tyree MT, Sperry JS (1989) Characterization and propagation of acoustic emission signals in woody plants: towards an improved acoustic emission counter. Plant Cell Environ 12: 371–382 [Google Scholar]
- Tyree MT, Yang S (1990) Water-storage capacity of Thuja, Tsuga and Acer stems measured by dehydration isotherms - the contribution of capillary water and cavitation. Planta 182: 420–426 [DOI] [PubMed] [Google Scholar]
- Vaz M, Cochard H, Gazarini L, Graça J, Chaves MM, Pereira JS (2012) Cork oak (Quercus suber L.) seedlings acclimate to elevated CO2 and water stress: Photosynthesis, growth, wood anatomy and hydraulic conductivity. Trees Struct Funct 26: 1145–1157 [Google Scholar]
- Venturas MD, Pratt RB, Jacobsen AL, Castro V, Fickle JC, Hacke UG (2019) Direct comparison of four methods to construct xylem vulnerability curves: differences among techniques are linked to vessel network characteristics. Plant Cell Environ 42: 2422–2436 [DOI] [PubMed] [Google Scholar]
- Venturas MD, Sperry JS, Hacke UG (2017) Plant xylem hydraulics: what we understand, current research, and future challenges. J Integr Plant Biol 59: 356–389 [DOI] [PubMed] [Google Scholar]
- Vergeynst LL, Bogaerts J, Baert A, Kips L, Steppe K (2013) New type of vulnerability curve gives insight in the hydraulic capacitance and conductivity of the xylem. Acta Hortic 991: 341–348 [Google Scholar]
- Vergeynst LL, Dierick M, Bogaerts JAN, Cnudde V, Steppe K (2015a) Cavitation: a blessing in disguise? New method to establish vulnerability curves and assess hydraulic capacitance of woody tissues. Tree Physiol 35: 400–409 [DOI] [PubMed] [Google Scholar]
- Vergeynst LL, Sause MGR, De Baerdemaeker NJF, De Roo L, Steppe K (2016) Clustering reveals cavitation-related acoustic emission signals from dehydrating branches. Tree Physiol 36: 786–796 [DOI] [PubMed] [Google Scholar]
- Vergeynst LL, Sause MGR, Hamstad MA, Steppe K (2015b) Deciphering acoustic emission signals in drought stressed branches: the missing link between source and sensor. Front Plant Sci 6: 1–11 [DOI] [PMC free article] [PubMed] [Google Scholar]
- Warren JM, Norby RJ, Wullschleger SD, Oren R (2011) Elevated CO2 enhances leaf senescence during extreme drought in a temperate forest. Tree Physiol 31: 117–130 [DOI] [PubMed] [Google Scholar]
- Wertin TM, McGuire MA, Teskey RO (2010) The influence of elevated temperature, elevated atmospheric CO2 concentration and water stress on net photosynthesis of loblolly pine (Pinus taeda L.) at northern, central and southern sites in its native range. Glob Chang Biol 16: 2089–2103 [Google Scholar]
- Wertin TM, Teskey RO (2008) Close coupling of whole-plant respiration to net photosynthesis and carbohydrates. Tree Physiol 28: 1831–1840 [DOI] [PubMed] [Google Scholar]
- Wheeler JK, Huggett BA, Tofte AN, Rockwell FE, Holbrook NM (2013) Cutting xylem under tension or supersaturated with gas can generate PLC and the appearance of rapid recovery from embolism. Plant Cell Environ 36: 1938–1949 [DOI] [PubMed] [Google Scholar]
- Wheeler JK, Sperry JS, Hacke UG, Hoang N (2005) Inter-vessel pitting and cavitation in woody Rosaceae and other vessel led plants: a basis for a safety versus efficiency trade-off in xylem transport. Plant Cell Environ 28: 800–812 [Google Scholar]
- Wolkerstorfer SV, Rosner S, Hietz P (2012) An improved method and data analysis for ultrasound acoustic emissions and xylem vulnerability in conifer wood. Physiol Plant 146: 184–191 [DOI] [PubMed] [Google Scholar]
- Zhang L, Liu L, Zhao H, Jiang Z, Cai J (2020) Differences in near isohydric and anisohydric behavior of contrasting poplar hybrids (I-101 (Populus alba L.) x 84K (Populus alba L. x Populus glandulosa Uyeki) under drought-rehydration treatments. Forests 10.3390/F11040402 [DOI] [Google Scholar]
- Zweifel R (2016) Radial stem variations - a source of tree physiological information not fully exploited yet. Plant Cell Environ 39: 231–232 [DOI] [PubMed] [Google Scholar]
- Zweifel R, Haeni M, Buchmann N, Eugster W (2016) Are trees able to grow in periods of stem shrinkage? New Phytol 211: 839–849 [DOI] [PubMed] [Google Scholar]
- Zweifel R, Item H, Häsler R (2001) Link between diurnal stem radius changes and tree water relations. Tree Physiol 21: 869–877 [DOI] [PubMed] [Google Scholar]
- Zweifel R, Item H, Häsler R (2000) Stem radius changes and their relation to stored water in stems of young Norway spruce trees. Trees Struct Funct 15: 50–57 [Google Scholar]
Associated Data
This section collects any data citations, data availability statements, or supplementary materials included in this article.