Abstract
Ionotropic glutamate delta receptors 1 (GluD1) and 2 (GluD2) exhibit the molecular architecture of postsynaptic ionotropic glutamate receptors, but assemble into trans-synaptic adhesion complexes by binding to secreted cerebellins that in turn interact with presynaptic neurexins1,2,3,4. It is unclear whether neurexin–cerebellin–GluD1/2 assemblies serve an adhesive synapse-formation function or mediate trans-synaptic signalling. Here we show in hippocampal synapses, that binding of presynaptic neurexin–cerebellin complexes to postsynaptic GluD1 controls glutamate receptor activity without affecting synapse numbers. Specifically, neurexin-1–cerebellin-2 and neurexin-3–cerebellin-2 complexes differentially regulate NMDA (N-methyl-D-aspartate) receptors and AMPA (α-amino-3-hydroxy-5-methyl-4-isoxazole propionic acid) receptors by activating distinct postsynaptic GluD1 effector signals. Of note, minimal GluD1 and GluD2 constructs containing only their N-terminal cerebellin-binding and C-terminal cytoplasmic domains, joined by an unrelated transmembrane region, fully control the levels of NMDA and AMPA receptors. The distinct signalling specificity of presynaptic neurexin-1 and neurexin-35,6 is encoded by their alternatively spliced splice site 4 sequences, whereas the regulatory functions of postsynaptic GluD1 are mediated by conserved cytoplasmic sequence motifs spanning 5–13 residues. Thus, GluDs are signalling molecules that regulate NMDA and AMPA receptors by an unexpected transduction mechanism that bypasses their ionotropic receptor architecture and directly converts extracellular neurexin–cerebellin signals into postsynaptic receptor responses.
Main
AMPA receptors (AMPARs) and NMDA receptors (NMDARs) mediate nearly all excitatory synaptic responses in the brain, control synapse properties, effect synaptic plasticity7,8,9 and contribute critically to neuropsychiatric disorders10,11. Little is known, however, about the mechanisms controlling the synaptic composition of NMDARs and AMPARs. Neurexins are presynaptic adhesion molecules that are encoded by three genes and have been implicated in schizophrenia, autism and Tourette’s syndrome12,13,14. In hippocampal synapses, alternative splicing of presynaptic neurexin-1 (Nrxn1) and neurexin-3 (Nrxn3) at splice site 4 (SS4) control postsynaptic NMDAR and AMPAR levels, respectively5,6. The Nrxn1SS4+ splice variant selectively enhances NMDAR excitatory postsynaptic currents (EPSCs), whereas the Nrxn3SS4+ splice variant selectively suppresses AMPAR-mediated EPSCs (hereafter AMPAR EPSCs)5,6. How NRXN1SS4+ and NRXN3SS4+ differentially regulate NMDARs and AMPARs is unknown. Of the identified neurexin ligands, two secreted cerebellins (CBLN1 and CBLN2) bind to presynaptic SS4+, but not to SS4−, neurexins and to postsynaptic GluD1 and GluD2 receptors that are homologous to AMPARs and NMDARs1,2,3,4. Thus, CBLN1 and CBLN2 connect presynaptic SS4+ neurexins to postsynaptic GluDs. Although high-resolution structures of NMDARs, AMPARs and CBLN1–GluD2 complexes are available15,16, the function and mechanism of action of GluDs remain unclear. Here, we show that NRXN1SS4+ and NRXN3SS4+ regulate NMDARs and AMPARs via the cerebellin-dependent activation of GluDs that transduce distinct presynaptic neurexin signals into different postsynaptic receptor responses.
GluD1 controls AMPARs and NMDARs
Hippocampal neurons robustly express synaptically localized GluD1, but little GluD217 (Extended Data Fig. 1a, f, g). We used CRISPR–Cas9-mediated manipulations to ablate GluD1 expression in cultured hippocampal neurons (Fig. 1a, b, Extended Data Fig. 1b–e). GluDs are thought to mediate synapse formation4, but immunocytochemical analysis showed that the GluD1 deletion did not detectably decrease the synapse density in hippocampal neurons (Fig. 1c, d, Extended Data Fig. 1h). Patch-clamp recordings demonstrated that the GluD1 deletion increased both the frequency (by approximately 180%) and amplitude (approximately 20%) of spontaneous miniature EPSCs (mEPSCs) (Fig. 1e), and enhanced the AMPA/NMDA ratio of evoked EPSCs (approximately 320%; Fig. 1f, g). This enhancement was due to an increase in the amplitude of AMPAR EPSCs (about 60%; Fig. 1h) and a decrease in the amplitude of NMDAR-EPSCs (about 40%; Fig. 1i). The kinetics, coefficient of variation and paired-pulse ratios (PPRs) of EPSCs did not change (Extended Data Fig. 1i–k). Together, these data indicate that the GluD1 deletion did not impair synapse formation, but altered the postsynaptic AMPAR and NMDAR composition. The increased mEPSC frequency may be produced by a more sensitive detection of larger mEPSCs and an unsilencing of synapses due to an increased AMPAR content.
Fig. 1: GluD1 controls AMPARs and NMDARs without altering synapse numbers.
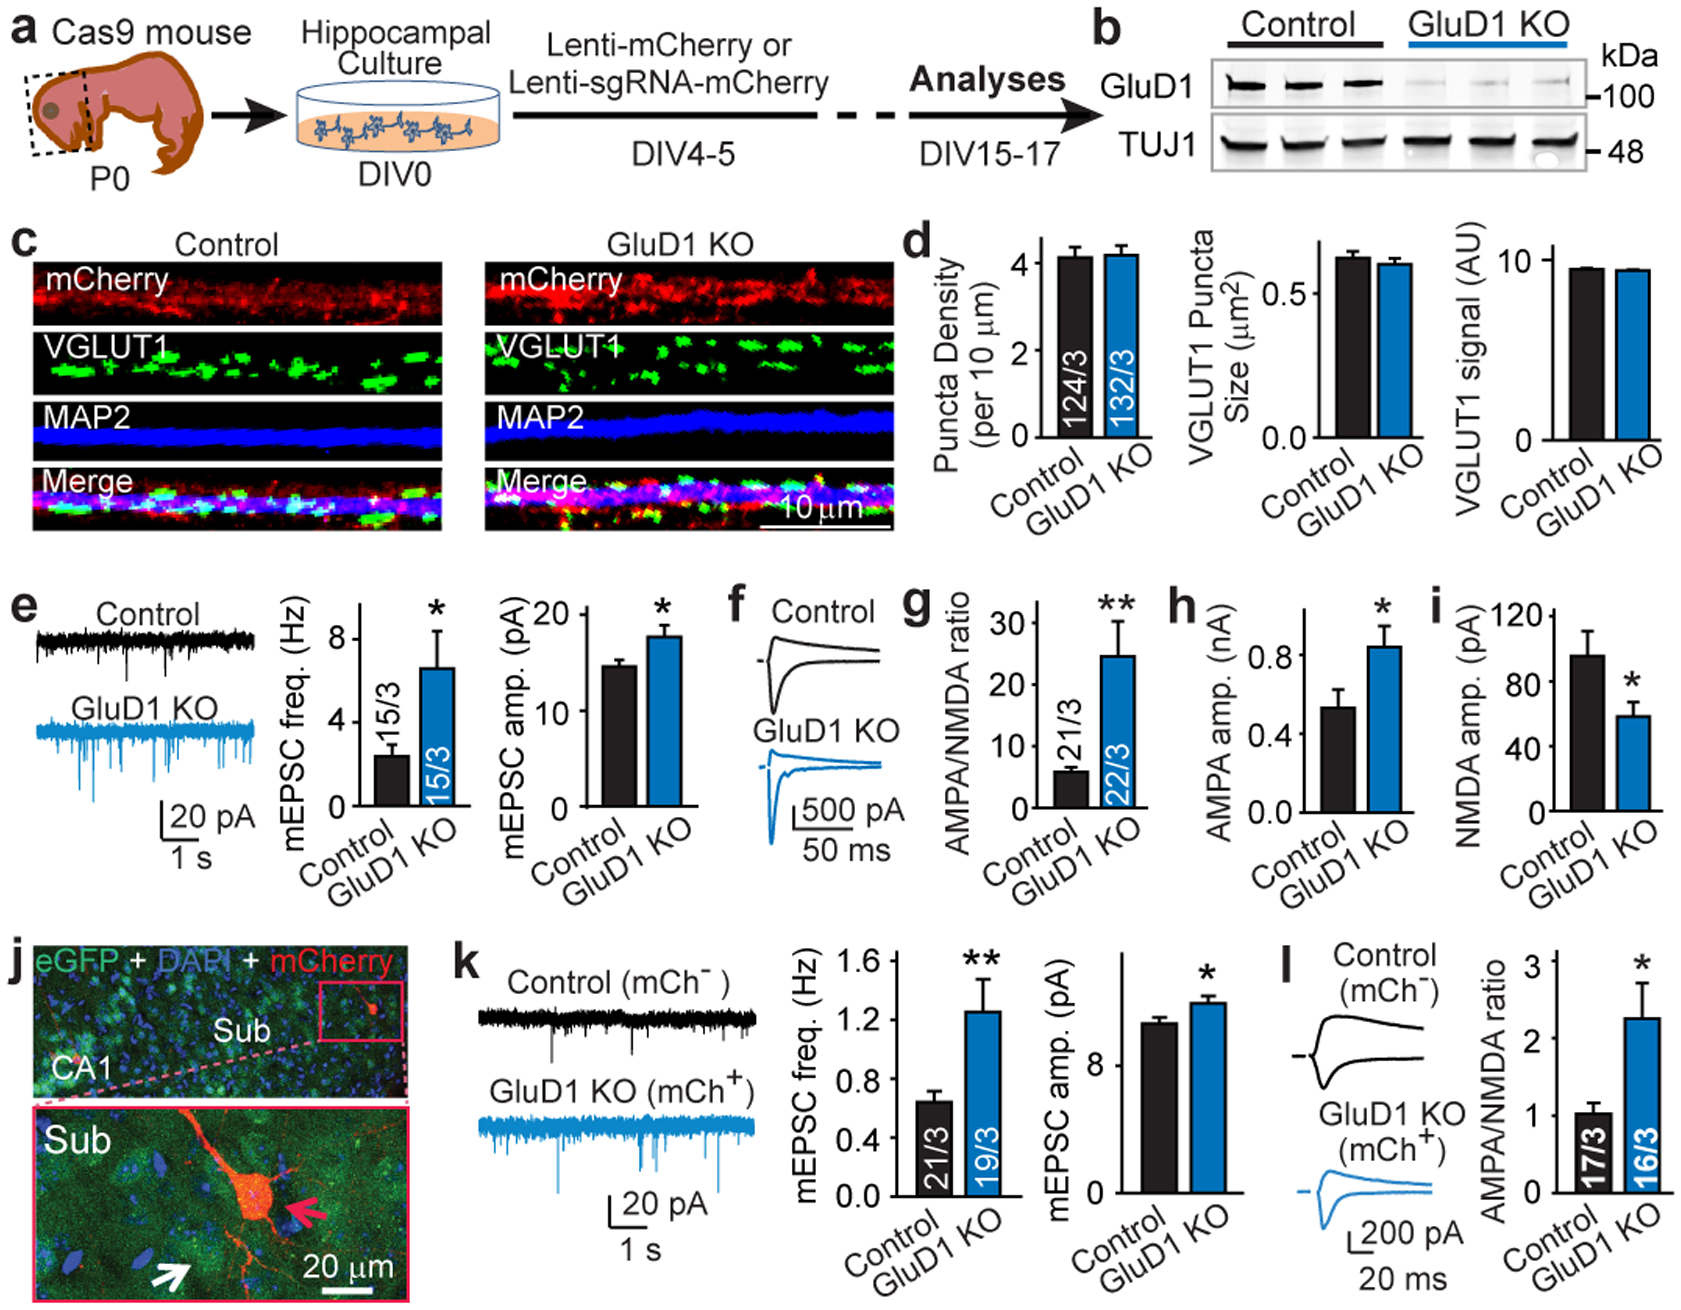
a, Experimental approach. P0, postnatal day 0; DIV, days in vitro; lenti, lentiviral vector; sgRNA, single guide RNA. b, Immunoblots showing CRISPR–Cas9-induced suppression of GluD1 protein levels (n = 3; see Extended Data Fig. 1d, Supplementary Fig. 1a). KO, knockout. c, d, GluD1 deletion does not decrease numbers of excitatory synapses in hippocampal cultures; representative images (c) and summary graphs (d). AU, arbitrary units. e, GluD1 deletion increases mEPSC frequency (freq.) and amplitude (amp.). Left, representative traces; middle and right, summary graphs. f–i, GluD1 deletion increases the AMPA/NMDA EPSC ratio of evoked EPSCs by enhancing AMPAR EPSCs and suppressing NMDAR EPSCs; representative traces (f), AMPA/NMDA EPSC ratio (g), AMPAR-EPSC (AMPA) amplitude (h) and NMDAR-EPSC (NMDA) amplitude (i). j, Section of subiculum from a Cas9 mouse stereotactically infected with a lenti-sgRNA-mCherry virus. Top, overview; bottom, infected (red arrow) and uninfected (white arrow) neurons. Representative image from 6 experiments. k, Sparse in vivo deletion of GluD1 increases the mEPSC frequency and amplitude. Left, sample traces; middle and right, summary graphs. mCh, mCherry. l, Sparse in vivo deletion of GluD1 enhances the AMPA/NMDA ratio. Left, sample traces; right, summary graph. Data are mean ± s.e.m. Numbers of statistical samples (n) are shown in bars: regions of interest/independent experiments (d); neurons/independent experiments (e–i); neurons/mice (k, l). Statistical significance was assessed by two-tailed Student’s t-test. *P ≤ 0.05, **P ≤ 0.01; exact P values are presented in the Source Data.
To test whether postsynaptic GluD1 also regulates synaptic AMPARs and NMDARs in vivo, we deleted GluD1 in the subiculum of young mice using lentiviral CRISPR manipulations18 (Fig. 1j, Extended Data Fig. 2a–c). The in vivo GluD1 deletion also increased the mEPSC frequency (approximately 95%) and amplitude (approximately 10%) (Fig. 1k), and enhanced the AMPA/NMDA ratio at CA1→subiculum synapses (approximately 120%; Fig. 1l). Again, the EPSC kinetics and coefficient of variation were unchanged (Extended Data Fig. 2d, e). Thus, in vivo deletion of GluD1 alters the postsynaptic AMPAR and NMDAR composition in subiculum neurons similarly to cultured neurons.
CBLN2 functions upstream of GluD1
A plausible hypothesis is that GluD1 regulates NMDARs and AMPARs in hippocampal neurons by functioning as a receptor for cerebellin–neurexin complexes. RNA in situ hybridization showed that Cbln2 is the major isoform expressed in the hippocampal formation. Cbln2 is selectively synthesized in the subiculum (Extended Data Fig. 2f, g), prompting us to delete Cbln2 from the subiculum using conditional Cbln2-knockout mice19 (Extended Data Fig. 2l). Although cerebellins are thought to mediate synapse formation by binding to GluDs4, we detected no changes in synapse numbers (Fig. 2a, Extended Data Fig. 2h, i). Moreover, instead of a decrease, the Cbln2 deletion caused a robust increase in mEPSC frequency (approximately 75%) and amplitude (approximately 15%) (Fig. 2b). In addition, the Cbln2 deletion enhanced the AMPA/NMDA EPSC ratio (approximately 50%) in CA1→subiculum synapses (Fig. 2c) without changing the EPSC kinetics or coefficient of variation (Extended Data Fig. 2k, m). Thus, similar to GluD1, CBLN2 does not function in synapse formation, but regulates NMDARs and AMPARs. At CA3→CA1 synapses that lack cerebellins (Extended Data Fig. 2f, g), the CBLN2 deletion had no effect (Extended Data Fig. 2n). Minimal stimulation experiments confirmed a large increase in AMPA/NMDA ratios in CBLN2-deficient neurons (approximately 65%); this increase was again produced by an increase in the amplitudes of AMPAR EPSCs (approximately 34%) and a suppression of amplitudes of NMDAR-mediated EPSCs (hereafter NMDAR EPSCs) (approximately 22%) (Fig. 2d–g, Extended Data Fig. 2j, o). Together, these results indicate that, similar to the GluD1 deletion, the CBLN2 deletion increases AMPARs and decreases NMDARs, and that both regulatory mechanisms operate at the same synapses.
Fig. 2: GluD1 controls postsynaptic AMPAR EPSCs and NMDAR EPSCs by a CBLN2-dependent mechanism.
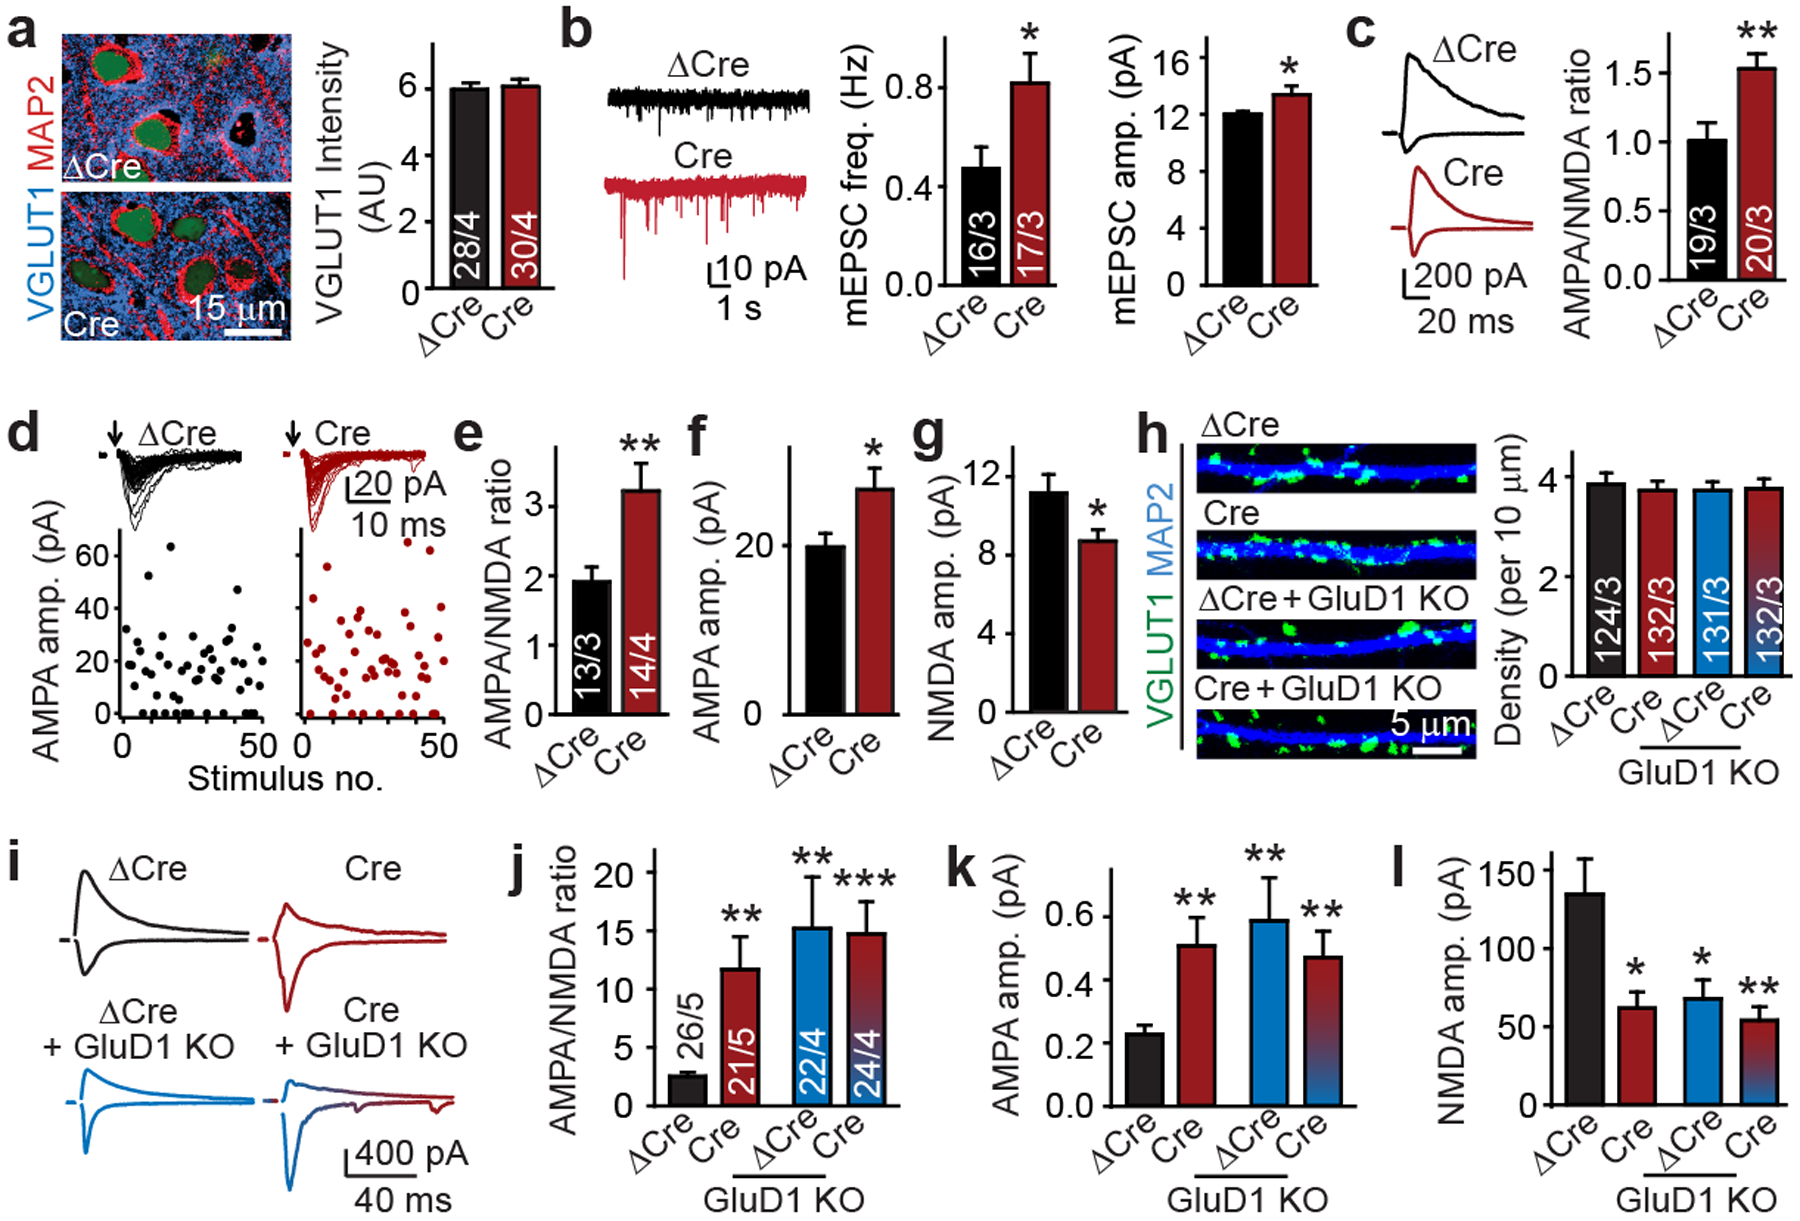
a, Conditional CBLN2 deletion from subiculum in vivo does not alter excitatory synapse density as monitored by VGLUT1 staining. Left, representative images; right; summary graph. b, c, Conditional CBLN2 deletion increases the mEPSC frequency and amplitude (b; sample traces (left) and summary graphs (middle and right)), and enhances the AMPA/NMDA ratio (c; sample traces (left) and summary graphs (right)). d–g, Minimal stimulation of AMPAR EPSCs shows that CBLN2 deletion affects AMPARs and NMDARs at individual synapses. d, Representative sample traces (top) and amplitude plots (bottom). e, AMPA/NMDA EPSC ratio. f, AMPAR EPSC amplitude. g, NMDAR EPSC amplitudes. h, CBLN2/GluD1 double deletion has no effect on excitatory synapse numbers in hippocampal cultures (representative images (left) and summary graph (right)). i–l, GluD1 deletion occludes the synaptic effects of the CBLN2 deletion. i, Representative traces. j, AMPA/NMDA EPSC ratio. k, AMPAR EPSC amplitude. l, NMDAR EPSC amplitude. Data are mean ± s.e.m. Numbers of statistical samples (n) are shown in bars: sections/mice (a); neurons/mice (b–g); dendrites/independent experiments (h); neurons/independent experiments (i–l). Statistical significance was assessed by two-tailed Student’s t-test comparing to control. ***P ≤ 0.001; exact P values are presented in the Source Data.
We next tested whether CBLN2 acts by binding to GluD1. Similar to individual CBLN2 and GluD1 deletions, the double GluD1/CBLN2 deletion had no apparent effect on synapse formation in cultured neurons (Fig. 2h, Extended Data Fig. 3a–f), but it increased the AMPA/NMDA ratio (about 300%), enhanced AMPAR EPSCs (around 100%), and decreased NMDAR EPSCs (about 50%) (Fig. 2i–l), again without changing the EPSC kinetics, coefficient of variation or PPRs (Extended Data Fig. 3g–i). Thus, CBLN2 and GluD1 operate in a unitary CBLN2–GluD1 signalling pathway that increases NMDAR EPSCs and decreases AMPAR EPSCs at individual synapses without affecting synapse numbers.
NRXNSS4+ signalling requires GluD1
At hippocampal synapses, presynaptic NRXN1SS4+ upregulates postsynaptic NMDAR EPSCs, whereas presynaptic NRXN3SS4+ suppresses postsynaptic AMPAR EPSCs5,6. To test whether CBLN2 and GluD1 transduce both of the distinct NRXN1SS4+ and NRXN3SS4+ signals, we combined overexpression of NRXN1βSS4+ or NRXN3βSS4+ with CRISPR-mediated deletion of GluD1 in cultured hippocampal neurons (Fig. 3a, Extended Data Fig. 4a–c). As before, expression of NRXN1βSS4+ or NRXN3βSS4+ decreased the AMPA/NMDA ratio of evoked EPSCs (by 40–50%), whereas the GluD1 deletion increased the AMPA/NMDA ratio (about 330%; Fig. 3b, c). However, NRXN1βSS4+ or NRXN3βSS4+ did not alter the AMPA/NMDA ratio in GluD1-deleted neurons (Fig. 3c). Moreover, NRXN1βSS4+ selectively increased NMDAR (around 50%) but not AMPAR EPSCs, whereas NRXN3βSS4+ suppressed AMPAR (around 45%) but not NMDAR EPSCs5,6 (Fig. 3d, e). Again, these effects were blocked by GluD1 deletion, which produced the opposite changes (Fig. 3d, e). None of these manipulations altered EPSC kinetics or PPRs (Extended Data Fig. 4d–h). These results suggest that GluD1 mediates two distinct neurexin signalling pathways, NRXN1βSS4+–CBLN2–GluD1–NMDAR and NRXN3βSS4+–CBLN2–GluD1–AMPAR.
Fig. 3: GluD1 transduces both the NRXN1SS4+ signal that enhances NMDAR EPSCs and the NRXN3SS4+ signal that suppresses AMPAR EPSCs.
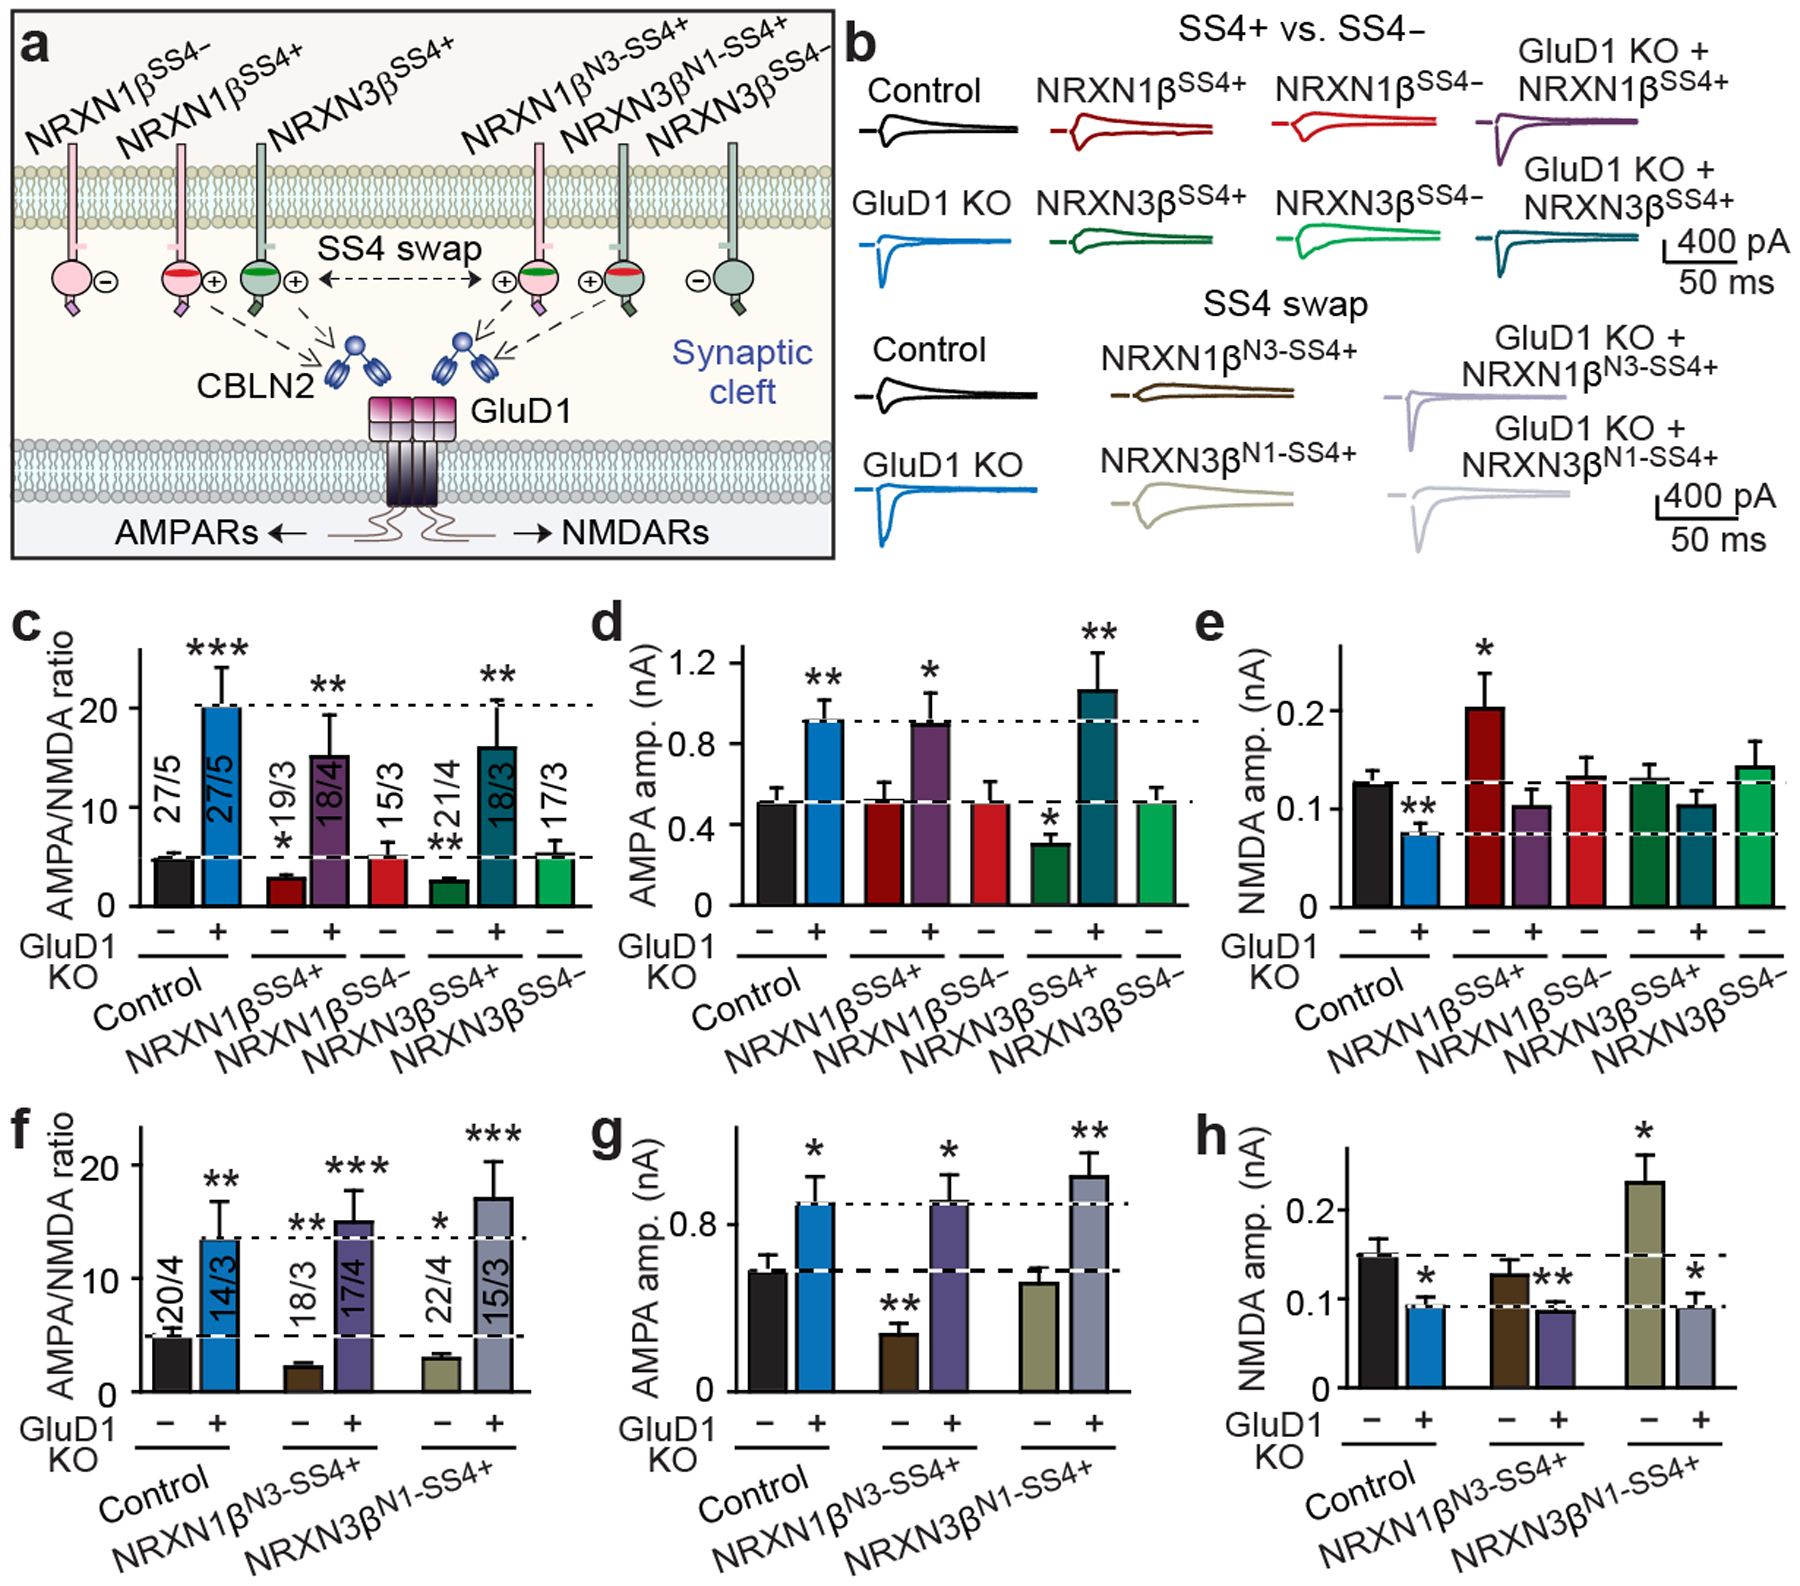
a, Schematic of NRXN1β–CBLN2–GluD1 and NRXN3β–CBLN2–GluD1 signalling pathways. b, Representative AMPAR-EPSC and NMDAR-EPSC traces from cultured hippocampal neurons. c–e, After deletion of GluD1, NRXN1βSS4+ and NRXN3βSS4+ do not decrease the AMPA/NMDA EPSC ratio (c), NRXN3βSS4+ does not suppress AMPAR ESPCs (d) and NRXN1βSS4+ does not enhance NMDAR EPSCs (e). f–h, The SS4 sequences of NRXN1SS4+ and NRXN3SS4+ determine their functional specificity. f, AMPA/NMDA EPSC ratios. g, AMPAR EPSCs. h, NMDAR EPSCs. Data are mean ± s.e.m. Numbers of neurons/independent experiments are indicated in bars. Statistical significance was assessed by two-tailed Student’s t-test, comparing to control. Exact P values are presented in the Source Data.
We next investigated the origin of the signalling specificities of NRXN1SS4+ and NRXN3SS4+ for NMDARs and AMPARs, respectively. The alternatively spliced SS4 sequences of neurexins that bind cerebellins are less conserved than surrounding sequences (Extended Data Fig. 4i). Since NRXN1SS4+ and NRXN3SS4+ exhibit distinct affinities for cerebellins2, we hypothesized that their SS4 sequences may encode their functional specificities. When we swapped the SS4 sequences of NRXN1βSS4+ and NRXN3βSS4+ (Extended Data Fig. 4i–k), NRXN1β containing the NRXN3β SS4 sequence (NRXN1βN3-SS4+) suppressed AMPAR EPSCs instead of enhancing NMDAR EPSCs, whereas NRXN3β containing the NRXN1β SS4 sequence (NRXN3βN1-SS4+) enhanced NMDAR EPSCs instead of suppressing AMPAR EPSCs (Fig. 3f–h). The EPSC kinetics and PPRs did not change (Extended Data Fig. 4l–p). Thus, the short alternatively spliced SS4 sequences of NRXN1SS4+ and NRXN3SS4+ encode their specificities in regulating postsynaptic glutamate receptor responses, suggesting that neurexins control AMPARs and NMDARs via cerebellin binding without involving co-receptors.
Distinct GluD1 regulatory sequences
Considering how GluD1 might function as a differential signalling device, we hypothesized that GluD1 transduces presynaptic NRXN1βSS4+ and NRXN3βSS4+ signals into postsynaptic AMPAR and NMDAR responses using distinct cytoplasmic GluD1 effector sequences. We therefore tested mutations in five conserved cytoplasmic sequences of GluD1, including the well-studied C-terminal PDZ-domain-binding sequence4 (Fig. 4a, Extended Data Figs. 5a, b, 6). Wild-type GluD1 fully rescued the diminished NMDAR EPSCs and the increased AMPAR EPSCs of GluD1-deficient neurons, and mutation of the PDZ-domain-binding motif of GluD1 did not impair the rescue (Fig. 4b–e). Similarly, mutation of two of the four internal sequence motifs (motifs 1 and 2) had no effect on rescue (Fig. 4c). By contrast, mutation of the other two conserved sequence motifs (motifs 3 and 4) partly impaired rescue of the AMPA/NMDA ratio (Fig. 4c). Importantly, the motif 3 mutant selectively blocked rescue of the NMDAR-EPSC phenotype, whereas the motif 4 mutant selectively blocked rescue of the AMPAR-EPSC phenotype (Fig. 4d, e). None of the GluD1 mutations altered the EPSC kinetics or PPRs (Extended Data Fig. 7a–c, j, k).
Fig. 4: Distinct cytoplasmic GluD1 sequences regulate AMPARs and NMDARs independent of the GluD1 ionotropic receptor transmembrane architecture.
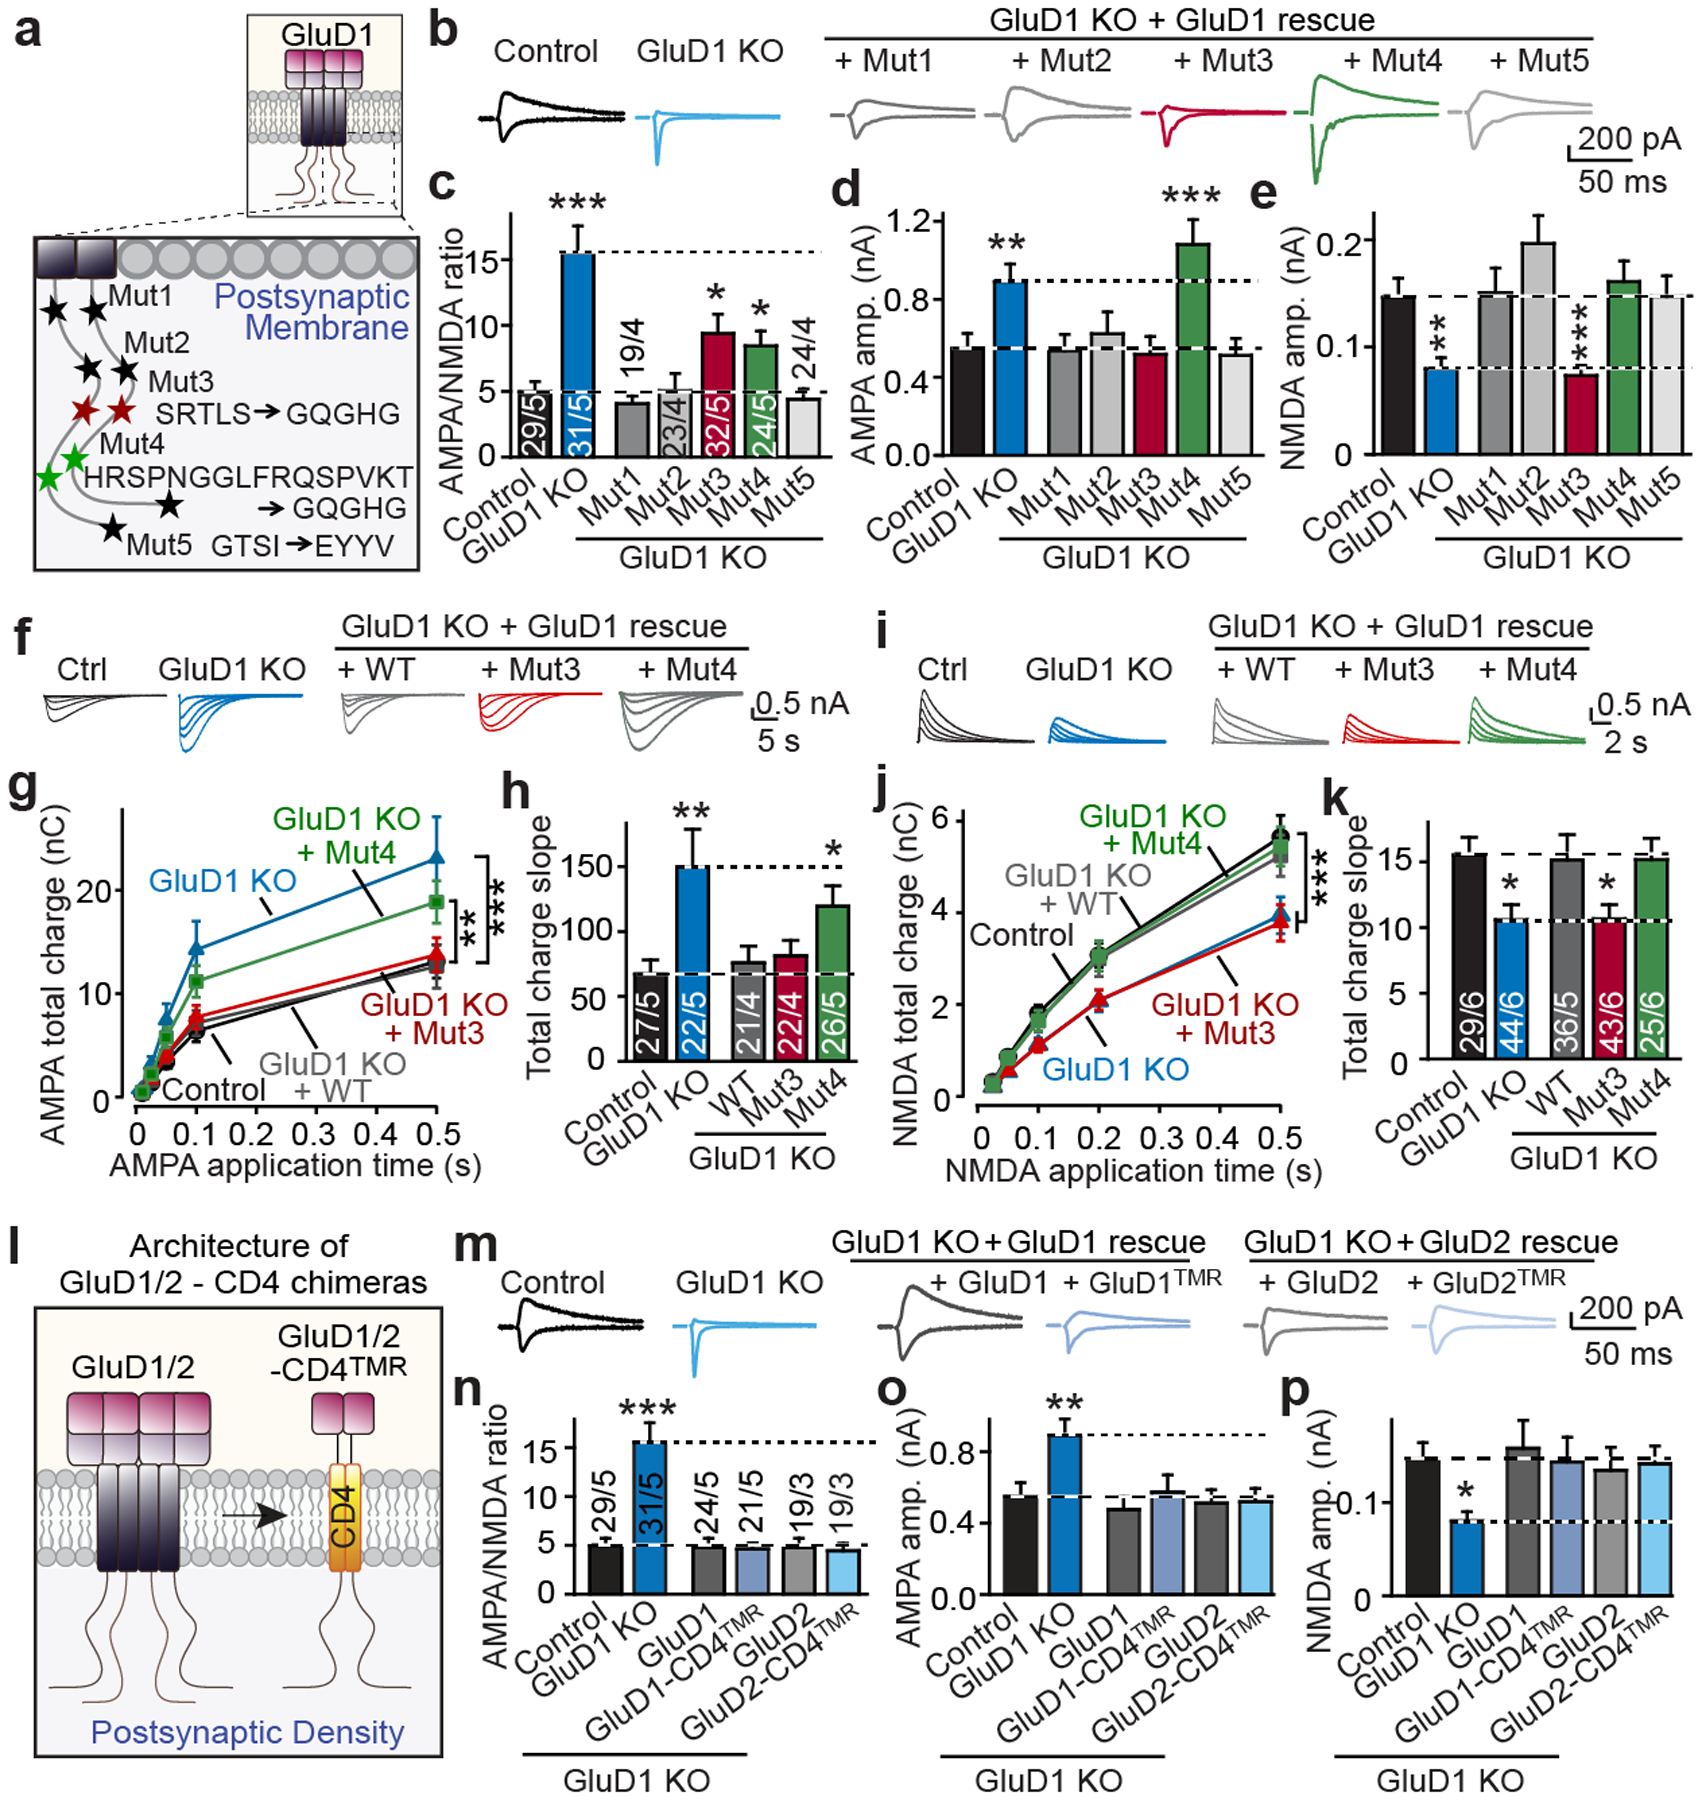
a, Schematic of mutations in cytoplasmic GluD1 sequences. b, Representative traces of AMPAR and NMDAR EPSCs. c, GluD1 mut3 (motif 3 mutation) and mut4 (motif 4 mutation) mutations partly impair rescue of the increased AMPA/NMDA ratio in GluD1-deficient neurons. d, e, Mut3 and mut4 mutations of GluD1 selectively impair regulation of NMDAR (e) and AMPAR (d) EPSCs, respectively. f–h, Direct AMPA application shows that the GluD1 mut4 mutation blocks rescue of the increased surface AMPAR levels in GluD1-deficient neurons. f, Representative traces. g, Total AMPAR-EPSC charge transfer per AMPA application times. h, Slopes of AMPA-response curves. i–k, Direct NMDA application reveals that the GluD1 mut3 mutation blocks rescue of the decreased surface NMDAR levels in GluD1-deficient neurons. i, Representative traces. j, Total AMPAR-EPSC charge transfer per AMPA application times. k, Slopes of AMPA-response curves. l, Schematic of minimal GluD1-CD4TMR and GluD2-CD4TMR constructs (see Extended Data Fig. 5 for details). GluD1/2, GluD1 or GluD2. m–p, GluD1-CD4TMR and GluD2-CD4TMR fully rescue the GluD1-deletion phenotypes, similarly to wild-type GluD1 and GluD2. m, Representative traces. n, AMPA/NMDA EPSC ratios. o, AMPA EPSC amplitudes. p, NMDA EPSC amplitudes. Data are mean ± s.e.m. Numbers of neurons/independent experiments are indicated in bars. Statistical significance was assessed by two-tailed Student’s t-test, comparing to control, or two-way ANOVA with Dunnett’s test. Exact P values are presented in the Source Data.
These findings suggest that GluD1 regulates AMPARs and NMDARs through distinct cytoplasmic sequence motifs. To independently validate this finding, we monitored EPSCs induced by puffing of AMPA or NMDA5 (Fig. 4f–k). As expected, the GluD1 deletion increased the AMPA response (by around 100%) and decreased the NMDA response (by around 33%). Both phenotypes were rescued by wild-type GluD1, but the motif 3 mutation of GluD1 selectively blocked rescue of the NMDA response, whereas the motif 4 mutation abolished rescue of the AMPA response (Fig. 4f–k). Thus, distinct GluD1 effector sequences are required for, and have differential effects on, the regulation of synaptic NMDARs and AMPARs and act to control the surface exposure of these receptors.
GluD1 signal transduction mechanism
How does a single receptor (GluD1) differentially transduce distinct NRXN1SS4+ and NRXN3SS4+ signals? It is possible that the ionotropic receptor architecture of GluDs (which they share with NMDARs and AMPARs) mediates signalling through a conformational change4. Alternatively, GluDs may directly transduce an extracellular neurexin–cerebellin signal into an intracellular response regulating AMPARs and NMDARs.
To address this central question, we deleted the transmembrane regions and presumptive glutamate-binding domains of GluD1 and GluD2, and replaced them with the single transmembrane region of CD420. The resulting hybrid receptors (GluD1-CD4TMR and GluD2-CD4TMR) retain only the N-terminal cerebellin-binding domain and the C-terminal cytoplasmic sequences of GluDs (Fig. 4l, Extended Data Fig. 5b). GluD1-CD4TMR and GluD2-CD4TMR were expressed similar to wild-type GluD proteins in neurons and efficiently transported to the cell surface (Extended Data Figs. 6b–f). Surprisingly, both GluD1-CD4TMR and GluD2-CD4TMR fully reversed the synaptic GluD1 deletion phenotypes without altering EPSC kinetics and PPRs (Fig. 4m–p, Extended Data Fig. 7d–f, j, k). These data show that GluDs regulate AMPARs and NMDARs via a mechanism that does not involve their glutamate-binding domains or their ionotropic receptor transmembrane architecture.
If GluD1-CD4TMR and GluD2-CD4TMR function analogous to wild-type GluD1 and GluD2, mutations that block specific NRXN1SS4+ and NRXN3SS4+ signalling functions of GluD1 should also impair these functions in GluD1-CD4TMR and GluD2-CD4TMR. Indeed, mutations of motifs 3 and 4 had the same effects on GluD1-CD4TMR as on wild-type GluD1 (Fig. 5a–e, Extended Data Fig. 5b). Moreover, GluD1-CD4TMR fully mediated the regulation of NMDARs and AMPARs by NRXN1βSS4+ or NRXN3βSS4+, respectively (Fig. 5b–e). Again, the effects of NRXN1βSS4+ or NRXN3βSS4+ were blocked by the respective cytoplasmic GluD1-CD4TMR mutations (Fig. 5b–e). None of these manipulations affected the EPSC kinetics or PPRs (Extended Data Fig. 7g–k). Thus, GluD1-CD4TMR is functionally indistinguishable from wild-type GluD1.
Fig. 5: Short GluD1 cytoplasmic sequence motifs transduce presynaptic neurexin signals into postsynaptic AMPAR and NMDAR responses.
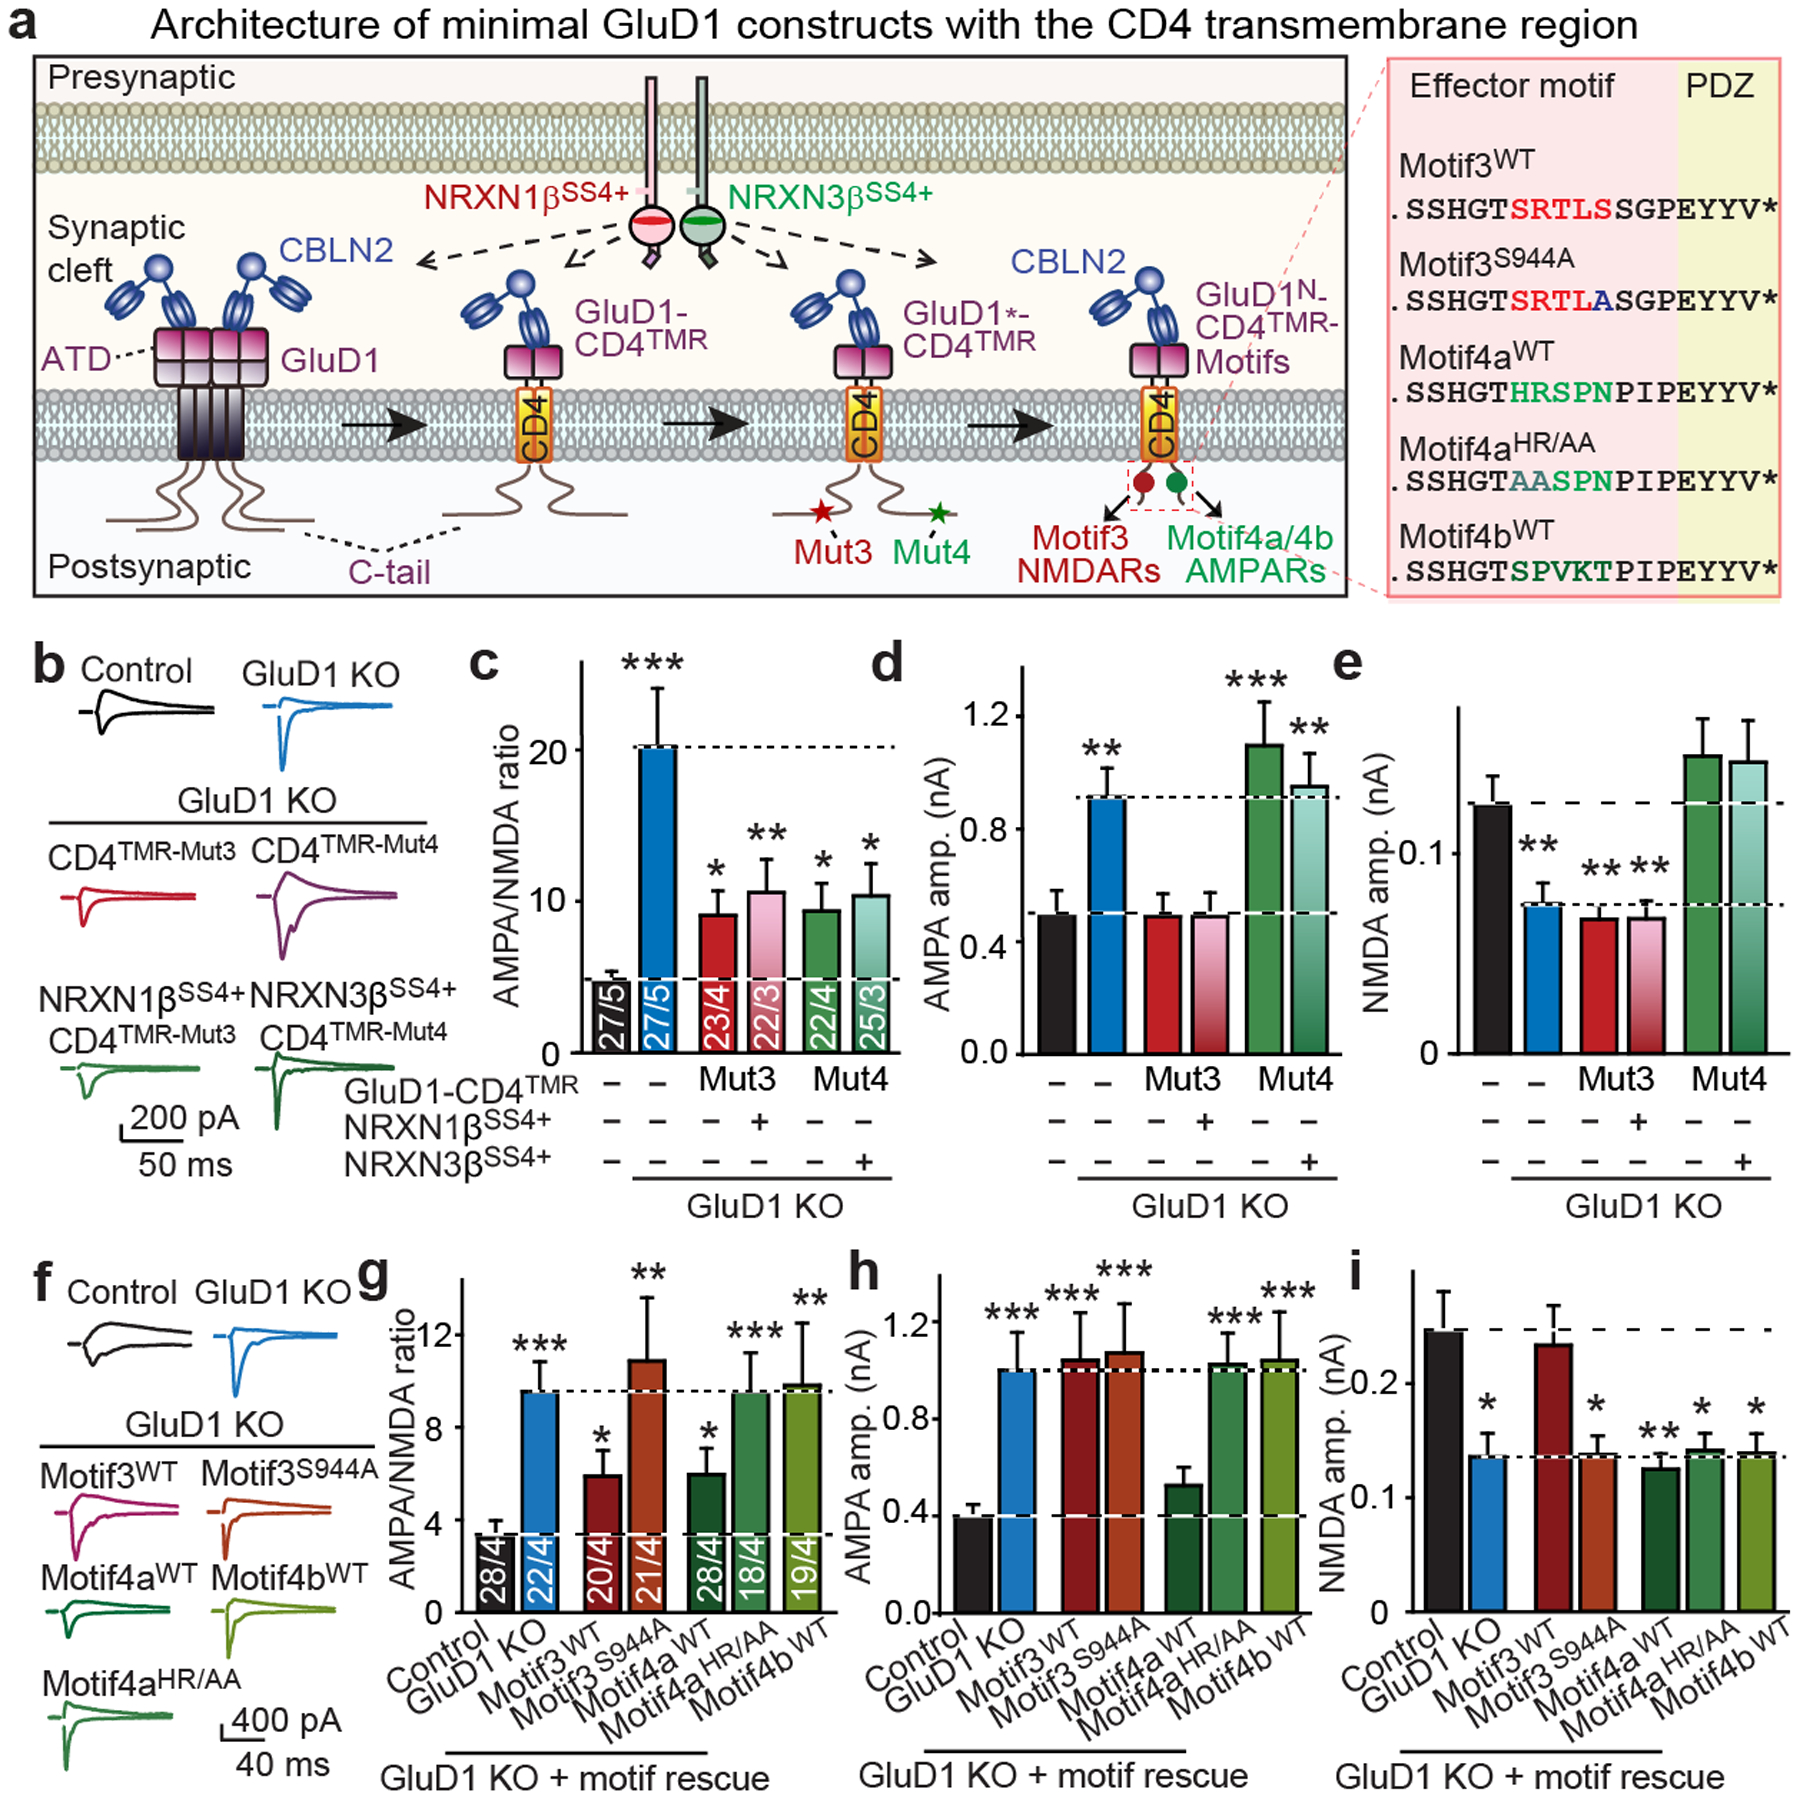
a, Schematic of minimized GluD1-CD4TMR constructs. ATD, amino-terminal domain; GluD1*-CD4TMR, mut3 or mut4 mutations on GluD1-CD4TMR; GluD1N-CD4TMR-motifs, GluD1-CD4TMR containing only the GluD1 N-terminal domain and cytoplasmic sequence motif (see Extended Data Fig. 5 for details). b–e, The mut3 and mut4 mutations of GluD1 also block regulation of NMDARs and AMPARs in minimal GluD1-CD4TMR proteins. b, Representative traces. c, AMPA/NMDA EPSC ratios. d, AMPA EPSC amplitudes. e, NMDA EPSC amplitudes. f–i, Distinct cytoplasmic sequence motifs, connected to the GluD1 cerebellin-binding domain (GluD1N) by a single transmembrane region, fully mediate regulation of NMDARs and AMPARs. f, Representative traces. g, AMPA/NMDA EPSC ratios. h, AMPAR-EPSC amplitudes. i, NMDAR EPSC amplitudes. Data are mean ± s.e.m. Numbers of neurons/independent experiments are indicated in bars. Statistical significance was assessed by two-tailed Student’s t-test, comparing to control. Exact P values are presented in the Source Data.
A minimal GluD1 signalling module
We next investigated which minimal GluD1 sequences might be sufficient to regulate AMPARs and NMDARs. Truncation of the GluD1-CD4TMR cytoplasmic sequence to 59 residues including the motif 3 and 4 sequences did not impair its regulation of AMPARs and NMDARs (Extended Data Fig. 8). We next designed minimal GluD1-derived receptor proteins comprising the GluD1 cerebellin-binding domain, the CD4 transmembrane region, and a short synthetic cytoplasmic tail containing only 5–13 residues of the conserved GluD1 sequence motifs (Fig. 5a, Extended Data Fig. 5b). We analysed wild-type and mutant motif 3 and 4 sequences (Extended Data Fig. 5); all of the constructs were expressed on the surface of neurons (Extended Data Fig. 9a, c).
Notably, the motif 3 sequence conferred full regulation of NMDARs but not AMPARs to the minimal GluD1 protein (Fig. 5f–i). A single serine-to-alanine substitution in motif 3 blocked its function (Fig. 5f–i). Conversely, a short sequence from motif 4 (motif 4a) fully regulated AMPARs but not NMDARs; this effect was also blocked by a specific point mutation (Fig. 5f–i). A second sequence from motif 4 (motif4b) did not regulate AMPARs or NMDARs (Fig. 5f–i). None of the manipulations altered the EPSC kinetics or PPRs (Extended Data Fig. 9d–h).
Discussion
Here we show that at hippocampal synapses, NRXN1SS4+ and NRXN3SS4+ enhance NMDAR EPSCs and suppress AMPAR EPSCs, respectively, by activating GluD1 in a complex with CBLN2 (Extended Data Fig. 10). Thus, postsynaptic GluD1 transduces distinct presynaptic neurexin signals into different NMDAR and AMPAR responses, creating an unexpected symmetry whereby homologous presynaptic neurexins differentially control homologous postsynaptic receptors (NMDARs and AMPARs) through a common effector (GluD) that shares homology with the regulated receptors. Minimal proteins comprising the short N-terminal cerebellin-binding domain of GluD1, the transmembrane region of CD4, and short C-terminal GluD1 sequence motifs fully mediated the neurexin-dependent regulation of NMDARs and AMPARs. The specificity of the NRXN1SS4+ and NRXN3SS4+ signals rested exclusively on the alternatively spliced SS4 sequences, which probably differentially alter the specific CBLN2-binding affinities of these neurexins2. Our findings suggest a parsimonious model in which presynaptic neurexins recruit distinct postsynaptic GluD complexes to the postsynaptic density, with the neurexin specificity governed by differential binding affinities (Extended Data Fig. 10). Expression of cerebellin21 and GluD222 is activity-dependent, suggesting that this signalling mechanism also produces activity-dependent synaptic plasticity. Together, these data delineate an unexpectedly economical molecular mechanism by which neurexin signalling controls AMPAR- and NMDAR-mediated responses in synaptic circuits.
Methods
P0 mice were randomly picked up for making hippocampal cultures. P21 littermate mice were randomly received the same injections of ΔCre or Cre AAV viruses. In experiments using cultured neurons, cover slips were assigned randomly. No statistical methods were used to predetermine sample size. All data were acquired by experimenters who were unaware of the sample or mouse genetic manipulations being analysed (that is, blinded), except for the GluD1 in vivo KO in slice recording, RNA fluorescence in situ hybridization (FISH), immunoblotting and surface staining experiments (Fig. 1b, j, Extended Data Figs. 2c, f, g, 3a, 4b, c, j, k, 6, 8b, d, 9a, c) in which the approach disabled blinding or the readout was independent of the observer.
Mice
All mice described in this study were maintained on a hybrid C57BL/6/SV129/CD1 (wild-type) background using established procedures according to protocols approved by the Stanford University Administrative Panel on Laboratory Animal Care and guidelines of the National Institutes of Health. Mice were group-housed with littermates of the same sex on a 12-h light:dark cycle, with access to food and water ad libitum. CBLN2 conditional KO and constitutive KO mice were described previously19. CRISPR–Cas9 knockin (KI) mice were obtained from Jackson Laboratory (Jax stock no: 024858). Primers (IDT) used for genotyping were as follows: Cbln2, forward: 5′-TAAAAGACAGTCCAGAGTTTTAGTC-3′, reverse (WT and flox): 5′-TCAAATAGAGAGGAGTAAGCACA-3′, reverse (KO): 5′-TTTCCTTGAAGGACTCCAATAG-3′; cas9 KI, forward: 5′-GCTAACCATGTTCATGCCTTC-3′, reverse: 5′-CTCCGTCGTGGTCCTTATAGT-3′; cas9 WT, forward: 5′-CTGGCTTCTGAGGACCG-3′, reverse: 5′-AGCCTGCCCAGAAGACTCC-3′. All studies used littermate male or female mice. Newborn pups were used for hippocampal cultures; day 21 mice were used for virus injections and were analysed 2–4 weeks after virus injection.
Hippocampal cultures
Hippocampal cultures were generated as described previously5,6,23,24,25. In brief, the hippocampi of newborn pups were dissected in ice-cold Hanks buffered saline solution (HBSS) without regard to gender, digested with 0.2 μm-filtered 10 U ml−1 papain (Worthington Biochemical Corporation) in HBSS, and incubated in a 37 °C water bath for 20 min. Hippocampi were washed once each with prewarmed HBSS and plating medium (MEM (Gibco) supplemented with 2 mM L-glutamine (Gibco), 0.4% glucose (Sigma-Aldrich), 2% Gem21 NeuroPlex Serum-Free Supplement (Gemini), and 5% FBS (Atlanta)). Cells were dissociated in plating media and seeded on coverslips precoated with Matrigel (Corning) in 24-well plates (5 hippocampi per two 24-well plates). The day of seeding was considered as DIV0. On DIV1, 95% of the plating medium was replaced with prewarmed neuronal growth medium (Neurobasal-A (Gibco) supplemented with 2 mM L-glutamine (Sigma-Aldrich), 2% Gem21 NeuroPlex Serum-Free Supplement (Sigma-Aldrich), and 5% FBS (Atlanta)). At DIV3, 50% of the medium was replaced with prewarmed neuronal growth medium supplemented with 4 μM AraC (Sigma-Aldrich) to prevent the glial overgrowth. At DIV4–5, when applicable, lentiviruses were added. At DIV6–7 for rescue experiments, lentiviruses were added additionally. Analyses were performed at DIV15–17.
Single-molecule RNA FISH
Wild-type BL6 mice were euthanized with isofluorane at P30, followed by transcardial perfusion with ice cold PBS. The brain was quickly dissected and embedded in Optimal Cutting Temperature (OCT) solution on dry ice. Horizontal sections with 16 μm thickness were cut using Leica CM3050-S cryostat, mounted directly onto Superfrost Plus slides and stored at −80 °C until use. Single-molecule FISH for Cbln1 (catalogue (cat.) no. 538491-C2), Cbln2 (cat. no. 428551) and Cbln4 (cat. no. 320269-C3) mRNA was performed using the multiplex RNAscope platform (Advanced Cell Diagnostics) according to manufacturer instructions for fresh-frozen sections. Fluorescent microscopy images were acquired using a VS120 Olympus slide scanner at 20× magnification.
DNA constructs and viruses
Adeno-associated virus (AAV)-ΔCre-eGFP and AAV-Cre-eGFP were used for in vivo subiculum injection as described previously5,6. In brief, AAV-DJ was produced in HEK 293T cells (obtained from and validated by the American Type Culture Collection (ATCC)) by co-transfection of pHelper, pDJ, and AAV vector (8.5 μg of DNA per 75 cm2 culture area) using the calcium-phosphate method. Cells were collected 72 h after transfections, lysed, and viral particles were isolated on an iodixanol gradient by ultracentrifugation at 400,000g for 2 h. The 40% iodixanol fraction containing AAVs was collected and concentrated using an Ultracon filter (100K MWCO). To effect the GluD1 KO in neurons, sgRNAs (sequences: sgRNA1, 5′-GCCGACTCCATCATCCACAT-3′; sgRNA2, 5′-GTAACGCACTGGCATATCCA-3′; sgRNA3, 5′-GGCCAATAATCCGTTCCAGG-3′; sgRNA4, 5′-GAACGCAGCCAAGGACGACA-3′; sgRNA5, 5′-CTTCGAGGAGAACGCAGCCA-3′) were cloned into lentiCRISPR v2 (Addgene plasmid: 52961), and CAS9-PuroR was replaced with mCherry. cre-eGFP and Δcre-eGFP DNA were cloned into the lentiviral plasmid FSW5,6 for cultured neuron studies. For rescue experiments, full-length wild-type and mutant GluD1 or GluD2 with a haemagglutinin (HA) tag (Figs. 4a, 4l, 5a, Extended Data Figs. 5, 8a) or NRXN1β or NRXN3β with a Flag tag (Figs. 3a, 5a, Extended Data Fig. 4i) were cloned into the lentiviral plasmid FSW5,6 for overexpression in neuronal cultures. Concentrated Lenti-sgRNA-mCherry virus23,26 was used for in vivo subiculum injections. All viruses were produced in HEK 293T cells (American Type Culture Collection (ATCC)) as described5,6,23,24. In brief, for lentiviral production, transfections of HEK 293T cells were performed using the calcium-phosphate method with each lentiviral expression plasmid and three helper plasmids (pRSV-REV, pMDLg/pRRE and pVSVG) at 12 μg per plasmid per 75 cm2 culture area. Sixteen to twenty hours after transfections, HEK 293 cells were washed with PBS, and the medium was replaced with neural culture media. HEK 293 cell media containing the recombinant viruses were collected at 48 h after transfection, centrifuged at 1,500g for 10 min to clear the supernatant, filtered (0.45 μm pore size), aliquoted, and stored at −80 °C. Viral supernatant (20–30 μl) was added directly to each 24-well plate. To further concentrate the Lenti-sgRNA-mCherry, the supernatant was ultracentrifuged at 49,000g for 90 min, resuspended in MEM, aliquoted, and stored at −80 °C.
Cell line identification
HEK 293T cells were directly purchased from ATCC, which regularly validates cell lines. Cell lines were tested negative for mycoplasma contamination using the fluorochrome Hoechst DNA stain and the direct culture method23,24,25.
mRNA measurements
mRNA was prepared from hippocampal cultures that had been infected as indicated with CRISPR lentiviruses at DIV4–5 and collected at DIV15–175,6. RNA was extracted using the Qiagen RNeasy kit according to manufacturer’s protocol (QIAGEN) and quantified using an ND-1000 spectrophotometer (NanoDrop, ThermoScientific). Quantitative real-time PCR (RT–qPCR) was performed using the VeriQuest Probe One-Step RT–qPCR Master Mix (Affymetrix) based on the manufacturer’s instructions, and reactions were carried out and quantified using a 7900HT Fast RT–qPCR instrument (Applied Biosystems). Expression levels were normalized to Actb as an internal control. The following PrimeTime qPCR Assays (IDT) were used (shown as gene, primer1, probe and primer2): GluD1, TGGATATGCCAGTGCGTTAC, TCCATCATCCACATCGGTGCCATC, CAGGTCTGATACAGCCAACTG; GluD2, TTTCTGTCCTTCTGTTGGTCTC, CCTGGCGACCGCTGATTCTATCAT, TGTGCGGAATACTTCATCATCT; mouse Actb (Applied Biosystems; cat. no. 4352933).
Culture electrophysiology
Electrophysiological recordings were performed on cultured hippocampal neurons prepared from cas9 or cas9-Cbln2fl/fl P0 mice as described5,6. cas9 cultures were infected with Lenti-mCherry or Lenti-sgRNA-mCherry at DIV4–5 and overexpression of GluD1 and its mutations or of neurexins was performed at DIV6–7. cas9 and Cbln2fl/fl double-mutant cultures were produced by infecting neurons at DIV4–5 with lentiviruses encoding Cre–eGFP (to induce the Cbln2cKO genotype) or ΔCre–eGFP (to retain the Cbln2fl/fl genotype) and then again at DIV6–7 with Lenti-mCherry or Lenti-sgRNA-mCherry lentiviruses. Neurons were analysed at DIV15–17 as described5,6. For electrophysiological recordings, cultures were continuously superfused with artificial cerebrospinal fluid (ACSF) solution maintained at 30.5 °C. The ACSF solution contained (in mM): 120 NaCl, 2.5 KCl, 1 NaH2PO4, 26.2 NaHCO3, 2.5 CaCl2, 1.3 MgSO4·7 H2O, and 11 D-glucose (Sigma-Aldrich), and was kept at ~290 mOsm. For measurements of mESPCs, 0.5 μM tetrodotoxin (TTX) (Fisher Scientific) was added to silence action potentials; for evoked EPSCs, 0.02 μM TTX was added to reduce neuronal network activity, which enabled us to detect the NMDA EPSC amplitude (50 ms after stimulation). EPSCs were recorded with an internal solution containing (in mM): 117 Cs-methanesulfonate, 15 CsCl, 8 NaCl, 10 TEA-Cl, 0.2 EGTA, 4 Na2-ATP, 0.3 Na2-GTP, 10 HEPES, pH 7.3 with CsOH (~300 mOsm) (Sigma-Aldrich). Evoked EPSCs were recorded in 50 μM picrotoxin (Tocris) for AMPAR EPSCs (HP = −70 mV) and NMDAR EPSCs (HP = +40 mV). AMPAR-EPSC amplitudes were quantified as the peak amplitude; NMDAR-ESPC amplitudes were measured 50 ms after the stimiulus. PPRs of AMPAR EPSCs were monitored using interstimulus intervals of 40–400 ms. Evoked synaptic currents were elicited with a nichrome stimulating electrode placed 100–150 μm from the soma of recorded neurons, and controlled by a Model 2100 Isolated Pulse Stimulator (A-M Systems) synchronized with the Clampex-10 data acquisition software (Molecular Devices). Synaptic currents were monitored with a Multiclamp 700B amplifier (Molecular Devices). Puffing applications of 50 μM AMPA (R-S AMPA hydrobromide (Tocris), in the presence of 50 μM picrotoxin, 50 μM D-APV (Tocris) and 0.5 μM TTX), 50 μM NMDA (Tocris) (in the presence of 50 μM picrotoxin, 10 μM CNQX (Tocris) and 0.5 μM TTX) were performed with 10 psi pressures for 10–500 ms using a Picospritzer III (Parker Instrumentation). The total charge transfer was calculated within 20 s (NMDA) and 40 s (AMPA) from puff application. The slope was calculated from the minimum puffing time to 100 ms (AMPA) or 200 ms (NMDA). Data were collected at 4 kHz and filtered with a low pass filter at 1 kHz. For all experiments, the experimenter was blinded to the recording condition.
Slice electrophysiology
Electrophysiological recordings from acute hippocampal slices were performed essentially as described5,6. In brief, slices were prepared from Cbln2fl/fl mice at 2–3 weeks after stereotactic infection of AAVs (encoding Cre and ΔCre) or from cas9 mice at 3–4 weeks after stereotactic infection of lenti-sgRNA-mCherry. Horizontal slices (300 μm thickness) were cut in a high sucrose cutting solution containing (in mM) 85 NaCl, 75 sucrose, 2.5 KCl, 1.3 NaH2PO4, 24 NaHCO3, 0.5 CaCl2, 4 MgCl2 and 25 D-glucose. Slices were equilibrated in ACSF at 31 °C for 30 min, followed by room temperature for 1 h. Slices were then transferred to a recording chamber containing ACSF as described above and maintained at 30.5 °C. To induce evoked synaptic responses in subiculum, a nichrome stimulating electrode was placed at the most distal portion of hippocampal CA1 region as illustrated in Extended Data Fig. 2l. AMPA/NMDA ratios and mEPSCs were recorded with an internal solution containing (in mM): 117 Cs-methanesulfonate, 15 CsCl, 8 NaCl, 10 TEA-Cl, 0.2 EGTA, 4 Na2-ATP, 0.3 Na2-GTP, 10 HEPES, pH 7.3 with CsOH (~300 mOsm). AMPAR- and NMDAR-EPSCs were monitored in 50 μM picrotoxin at holding potentials of −70 mV (AMPAR-EPSCs) or +40 mV (NMDAR-EPSCs, quantified at 50 ms after the stimulus). Measurements of mEPSCs were performed in 50 μM picrotoxin with 0.5 μM TTX at −70 mV holding potentials. For minimal stimulation of evoked synaptic responses in the subiculum, we reduced the stimulation intensity until failure events emerged, and then repeated stimulations 50 times at 0.1 Hz with holding potentials of −70 mV (AMPAR EPSCs, success threshold = 5 pA) and +40 mV (NMDAR EPSCs, measured at 50 ms after the stimulus; success threshold = 2 pA). For all experiments, the experimenter was blinded to the recording condition. All data were analysed with Igor software (WaveMetrics). Miniature events were handpicked with a threshold of 5 pA using the Igor software27.
Stereotactic injections
Stereotactic injections of AAV or lentiviruses into the subiculum of mice at P21 were performed essentially as described5,6. Mice were anaesthetized with ketamine-medetomidine, and viruses were injected using a stereotactic instrument (David Kopf) and a syringe pump (Harvard Apparatus) with 0.4 μl (AAV) or 1.0 μl (Lentivirus) at a slow rate (0.1 μl min−1) into the subiculum (Bregma coordinates (mm): AP: −3.3, ML: ± 3.3, DV: −2.5). After infection, virally mediated expression was confirmed by the presence of eGFP or mCherry. Image (Extended Data Fig. 2l) was taken using the Olympus Fluoview Imaging software (Olympus). Images (Fig. 1j, Extended Data Fig. 2c) were taken using a Nikon confocal microscope (A1Rsi) with a 10× objective (PlanApo, NA0.45) with 1,024 × 1,024-pixel resolution. The fluorescence of all slices prepared for physiology was confirmed under a fluorescence microscope (Olympus).
Immunocytochemistry
Hippocampal cultures were fixed with 4% paraformaldehyde (PFA) + 4% sucrose for 15 min, washed 3 times with 1× PBS, and incubated in blocking buffer (0.3% Triton X-100 and 5% goat serum in PBS) for 1 h at room temperature5,6,24,25,28. Cover slips were incubated overnight at 4 °C with primary antibodies diluted in blocking buffer (Figs. 1c, 2h: anti-VGLUT1, 1:1,000, guinea pig, Millipore; anti-MAP2, 1:1,000, rabbit, Millipore, Extended Data Fig. 1f: anti-VGLUT1, 1:1,000, guinea pig, Millipore; anti-MAP2, 1:1,000, mouse, Sigma; anti-GluD1, 1:500, rabbit, Frontier Institute; anti-HOMER1, 1:1,000, rabbit, Millipore, Extended Data Figs. 1h, 3e: anti-VGLUT1, 1:1,000, guinea pig, Millipore; anti-MAP2, 1:1,000, mouse, Sigma; anti-HOMER1, 1:1,000, rabbit, Millipore), followed by treatment with secondary antibodies (1:1,000, Alexa Fluor 647, Alexa Fluor 488, Alexa Fluor 405) at room temperature for 1 h after washing 3 times with PBS. For anti-HA or anti-Flag surface labelling, cultures were first incubated in blocking buffer (5% goat serum in PBS) for 1 h at room temperature, and then incubated overnight at 4 °C with anti-HA mouse (1:1,000; Covance; cat. no. MMS101R) or anti-Flag mouse (1:1,000; Sigma; cat. no. F3165) primary antibody, followed by treatment with secondary antibodies (1:1,000, Alexa 647) at room temperature for 1 h after washing 3 times with PBS. After HA surface labelling, cells were permeabilized in blocking buffer (0.3% Triton X-100 and 5% goat serum in PBS), internal HA was labelled with anti-HA rabbit (1:1,000; Cell Signaling Technologies; cat. no. 3724) primary antibody and secondary antibody (1:1,000, Alexa Fluor 405) in blocking buffer (0.3% Triton X-100 and 5% goat serum in PBS). In the end, cover slips were washed three times again and mounted with Fluoromount-G (SouthernBiotech). Image acquisition and quantification were performed as described5,6. In brief, cells were chosen from three or more independent cultures. Images were taken from at least three coverslips per experiment. Fluorescent images were acquired at room temperature by using a Nikon confocal microscope (A1Rsi) with a 60× oil objective (PlanApo, NA1.4) with 1,024 × 1,024 pixel resolution except 2,048 × 2,048 pixel resolution for Extended Data Fig. 1f. Within the same experiment, the same acquisition settings were used. Fifteen to thirty optical sections (0.25 μm z-step for GluD1/HOMER1, 0.5 μm z-step for vGlut1/HOMER1, and 1 μm z-step for HA or Flag labelling) were used and maximum pixel intensity projections were generated. For synaptic puncta quantification, images were thresholded by intensity to exclude background signals and the puncta (size was ranged from 0.1–3.0 μm2) was quantified to calculate the mean and s.e.m. For HA or Flag surface and internal quantification, the entire image was calculated. For minimum distance quantification, the range of 0.1–4 μm was analysed for presynaptic VGLUT1 to postsynaptic GluD1/HOMER1 distance.
Immunohistochemistry
For hippocampal cryosections, experiments were essentially performed as described5,29,30. Mice were anaesthetized with isoflurane and perfused with 10 ml PBS followed by 30 ml 4% PFA in 1× PBS using a perfusion pump (2 ml min−1). Whole brains were dissected out and kept in PFA for 6 h, then post-fixed in 30% sucrose (in 1× PBS) for 24–48 h at 4 °C. Horizontal brain sections (30 μm) were collected at −20 °C with a cryostat (Leica CM1050). Sections were washed with PBS and incubated in blocking buffer (0.3% Triton X-100 and 5% goat serum in PBS) for 1 h at room temperature, and incubated overnight at 4 °C with primary antibodies diluted in blocking buffer (anti-VGLUT1, 1:1,000, guinea pig, Millipore and anti-MAP2, 1:1,000, rabbit, Millipore). Sections were washed 3 times for 10 min each in 1× PBS, followed by treatment with secondary antibodies (1:1,000, Alexa Fluor 405, Alexa Fluor 647) at 4 °C overnight, then washed 3 times for 10 min each with 1× PBS. All incubations were performed with agitation. All sections were then mounted on superfrost slides and covered with Fluoromount-G as previously described. Serial confocal z-stack images (1-μm step for 10 μm at 1,024 × 1,024 pixel resolution) were acquired using a Nikon confocal microscope (A1Rsi) with a 60× oil objective (PlanApo, NA1.4). All acquisition parameters were kept constant among different conditions within experiments. For data analysis, maximum intensity projections were generated for each image, and average VGLUT1 intensity (mean ± s.e.m.) calculated from the entire area of subiculum (object size range 0.055–0.125 mm2). Twenty-eight to 30 sections were used for each condition (n ≥ 3 animals per condition) and analysed with Nikon analysis software.
Immunoblotting
Immunoblotting was performed as described previously5,6,24,26. In brief, DIV15–17 hippocampus cultures were homogenized in Laemmli buffer (12.5 mM Tris-HCl, pH 6.8, 5 mM EDTA, pH 6.8, 143 mM β-mercaptoethanol, 1% SDS, 0.01% bromophenol blue, 10% glycerol), boiled and separated by SDS–PAGE at 100 V for about 1.3 h, then transferred onto nitrocellulose membranes using the Trans-Blot Turbo transfer system (Bio-Rad). Membranes were then blocked with 5% milk in TBS containing 0.1% Tween 20 (TBST) at room temperature for 1 h, and then incubated in primary antibody overnight at 4 °C. Membranes were washed 3 times with TBST, then incubated in fluorescent labelled secondary antibodies (donkey anti-rabbit IR dye 680LT/800CW, 1:10,000; donkey anti-mouse IR dye 680LT/800CW, 1:10,000; LI-COR Bioscience). Membranes were scanned using an Odyssey Infrared Imager and analysed with the Odyssey software (LI-COR Biosciences). Intensity values for GluD1*, HA and Flag were normalized to TUJ1. The antibodies used are as follows: anti-TUJ1 mouse (1:2,000; Covance; cat. no. MMS-435P), anti-GluD1 rabbit (1:1,000; Frontier Institute; cat. no. Af1390), anti-HA mouse (1:1,000; Covance; cat. no. MMS101R) and anti-Flag mouse (1:1,000; Sigma; cat. no. F3165).
Data analyses
All raw data are listed in the Source Data. All numerical data are shown as mean ± s.e.m., with statistical significance (*P < 0.05, **P < 0.01 and ***P < 0.001) determined by two-tailed Student’s t-test, or two-way analysis of variance (ANOVA) with Dunnett’s test. Non-significant results (P > 0.05) are not identified.
Extended Data
Extended Data Fig. 1. CRISPR-mediated deletion and synaptic localization of GluD1 in cultured hippocampal neurons, and the effect on synapse numbers and synaptic function.
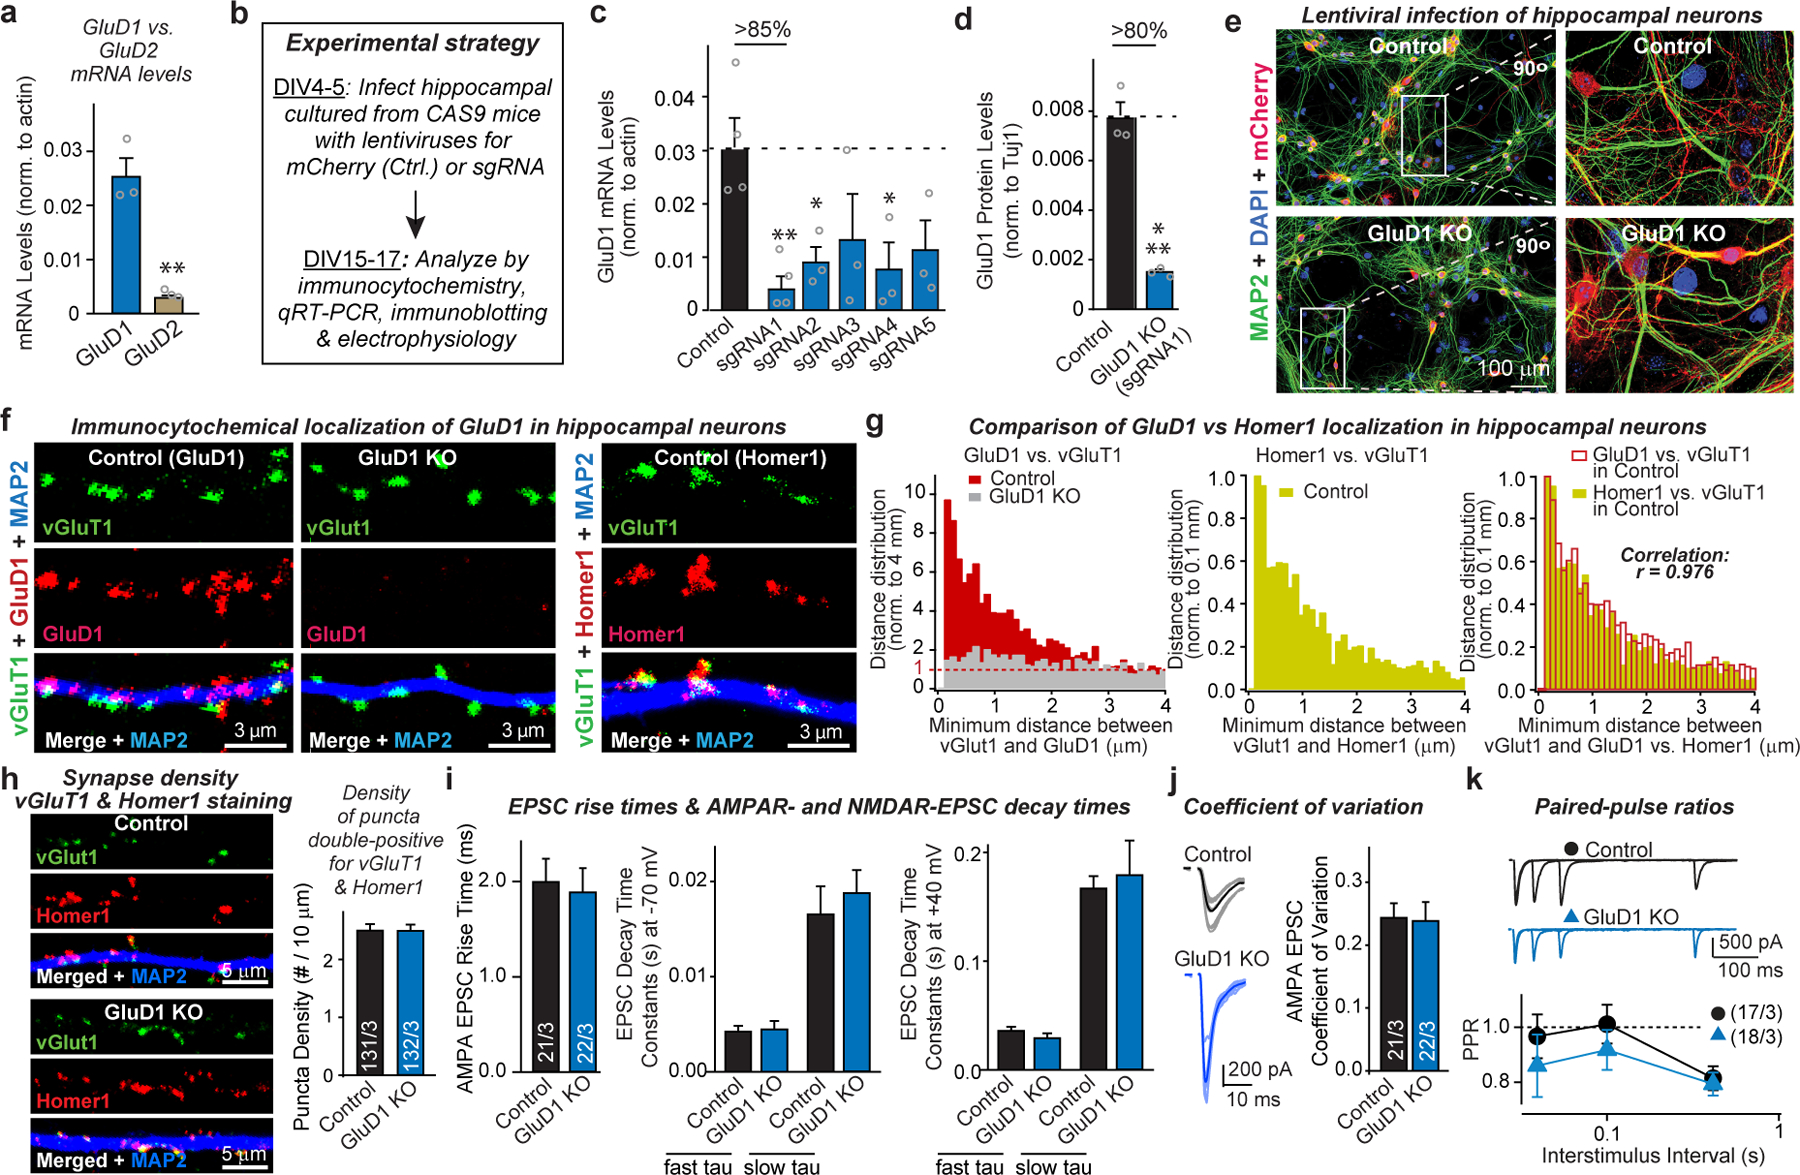
a, Quantitative RT–PCR demonstrating robust GluD1 but weak GluD2 expression in cultured hippocampal neurons, providing the rationale for targeting GluD1 over GluD2. b, Experimental strategy for the CRISPR-mediated GluD1 deletion. Hippocampal cultures from Cas9-expressing transgenic18 mice were infected at DIV4–5 with lentiviruses expressing only mCherry or co-expressing mCherry with GluD1-directed sgRNAs, and were analysed at DIV15–17. c, Screening of five sgRNAs for the GluD1 KO efficacy in hippocampal cultures from Cas9-expressing transgenic mice18. GluD1 mRNA levels were analysed by quantitative RT–PCR in neurons as described in a. sgRNA sequences: sgRNA1, 5′-GCCGACTCCATCATCCACAT-3′; sgRNA2, 5′-GTAACGCACTGGCATATCCA-3′; sgRNA3, 5′-GGCCAATAATCCGTTCCAGG-3′; sgRNA4, 5′-GAACGCAGCCAAGGACGACA-3′; sgRNA5, 5′-CTTCGAGGAGAACGCAGCCA-3′. sgRNA1 was used for all subsequent experiments. d, GluD1 deletion using sgRNA1 in hippocampal cultures from Cas9-expressing transgenic mice abolishes most GluD1 protein expression by the time of analysis used in the current experiments. Protein levels were quantified using immunoblots (see Fig. 1b) with fluorescent secondary antibodies. e, Representative images of more than 3 experiments of hippocampal neurons cultured from Cas9-expressing transgenic mice and infected with a control lentivirus or a lentivirus expressing sgRNA1 targeting GluD1 (CRISPR). Neurons were stained for MAP2 and DAPI; the mCherry signal is from the lentiviruses). f, Representative images of hippocampal neurons cultured from Cas9-expressing transgenic mice and infected with a control lentivirus or a lentivirus expressing sgRNA1 targeting GluD1 (CRISPR, used as a negative control for GluD1 staining). Neurons were stained for vGluT1, MAP2 and GluD1 (left and middle panels) or Homer1 (right panels). g, Co-localization quantifications indicate that the GluD1 and the Homer1 signals are both adjacent to vGluT1 signals and are highly correlated with each other (Pearson correlation test). For minimum distance quantification, the range of 0.1–4 μm was analysed for distances between presynaptic vGlut1 and postsynaptic GluD1 or Homer1. h, CRISPR-mediated deletion of GluD1 has no effect on excitatory synapse numbers in hippocampal neurons, independently confirming the experiments shown in Fig. 1 using double labelling for pre- and postsynaptic excitatory synapse markers (vGluT1 and Homer1, respectively). Only puncta positive for both markers were quantified (left, representative images of neurons stained for vGluT1, Homer1 and MAP2; right, summary graphs of the density of double-positive for vGluT1 and Homer1 synaptic puncta). i, CRISPR-mediated GluD1 deletion does not alter EPSC kinetics (left, AMPAR-EPSC rise time (20–80%); middle, AMPAR-EPSC decay constants at −70 mV fitted with double-exponential function; NMDAR-EPSC decay constants at +40 mV fitted with double-exponential function. Data for i and j are from the experiments of Fig. 1g–i. j, k, CRISPR-mediated GluD1 deletion does not alter the coefficient of variation (j; left, representative traces; right, summary graph of coefficient of variation), or the PPR of AMPAR-EPSCs (k; top, sample traces; bottom, summary plots of the PPRs as a function of interstimulus intervals (ISIs)). Data are means ± s.e.m. (number of independent experiments (data points) is indicated in the bars of a–d, regions of interests/independent experiments is listed in h, and number of neurons/ independent experiments is indicated in i–k). Statistical significance was assessed by two-tailed Student’s t-test or two-way ANOVA (*P ≤ 0.05, **P ≤ 0.01, and ***P ≤ 0.001; for numerical P values, see source data; non-significant comparisons are not indicated).
Extended Data Fig. 2. Effects of the CRISPR-mediated deletion of GluD1 and Cre-mediated deletion of Cbln2 in vivo.
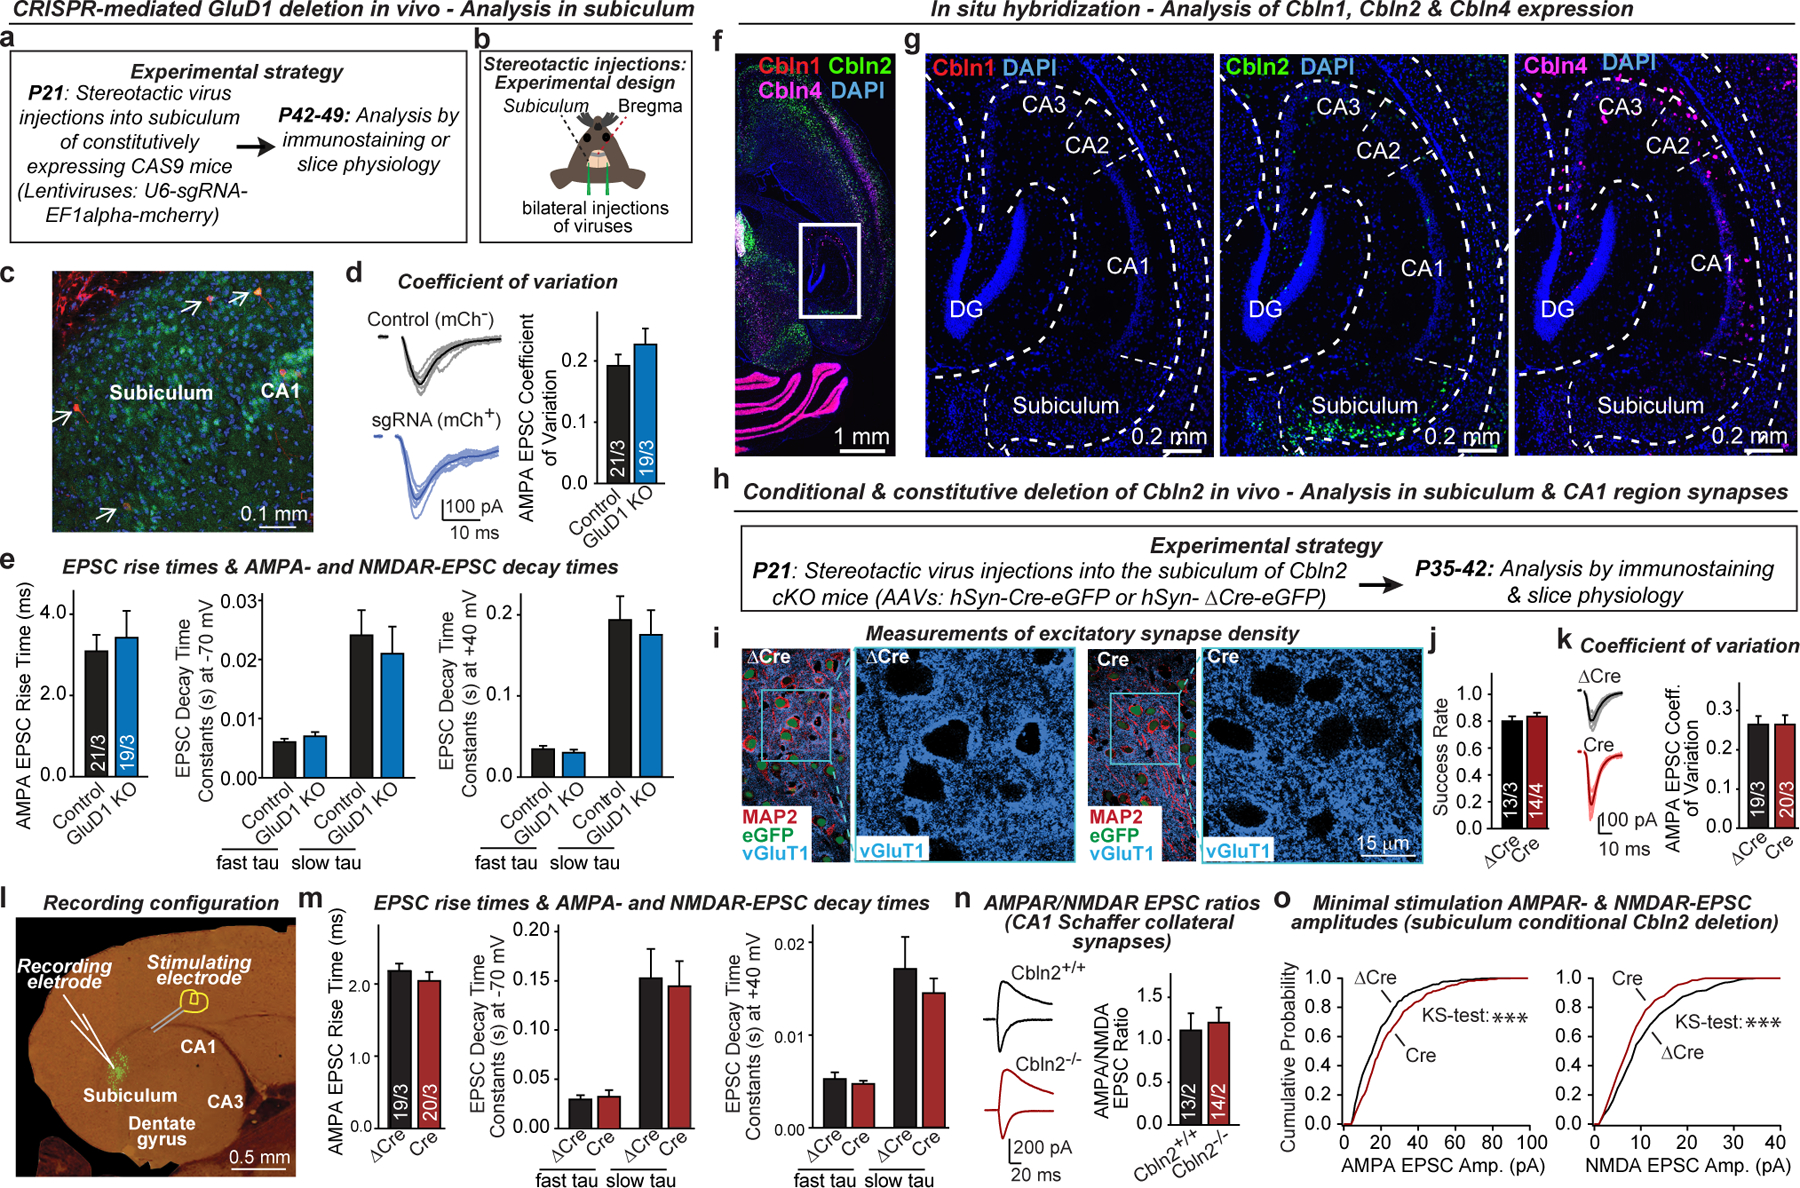
a, b, Experimental strategy for CRISPR-mediated sparse GluD1 deletion in neurons of the subiculum in the hippocampal formation. Mice were bilaterally infected at P21 by stereotactic injections of lentiviruses co-expressing sgRNA directed against GluD1 and mCherry. Mice were sacrificed at P42-P49, and subiculum sections were analysed by acute slice physiology comparing adjacent infected mCherry-positive GluD1-deficient neurons with non-infected control neurons (strategy outline (a); diagram of stereotactic injections (b)). c, Image of a subiculum section from a stereotactically infected mouse (representative of 6 experiments). Arrows identify sparsely infected mCherry-positive neurons. d, CRISPR-mediated GluD1 deletion does not alter the coefficient of variation of AMPAR-EPSCs (left, representative traces; right, summary graph of coefficient of variation). e, CRISPR-mediated GluD1 deletion does not alter the EPSC kinetics (left, EPSC rise time (20–80%); middle, EPSC decay constants at −70 mV fitted with double-exponential function; EPSC decay constants at +40 mV fitted with double-exponential function). Data in this panel and panel d were from the experiments in Fig. 1l. f, g, RNA in situ hybridization analyses reveal that cerebellin-1 (Cbln1) is poorly expressed in the hippocampal formation, cerebellin-2 (Cbln2) is detectable only in subiculum neurons, and cerebellin-4 (Cbln4) is found only in a subset of interneurons (overview of the hippocampal formation hybridized for Cbln1, Cbln2, and Cbln4 mRNAs (f); representative images for each cerebellin (g)). Images are representative of multiple brain sections, and match those obtained by the Allen Brain Institute (https://mouse.brain-map.org). h, Experimental strategy for analysis of conditional Cbln2 deletions in vivo using Cbln2 cKO mice19. Mice were bilaterally infected at P21 by stereotactic injections of AAVs expressing ΔCre-eGFP (control) or Cre-eGFP, and subiculum neurons were analysed in acute slices 2–3 weeks later. In this and all following experiments, ΔCre refers to the expression of a mutant inactive Cre that is otherwise indistinguishable from Cre. i, Conditional Cbln2 deletion from subiculum neurons does not impair excitatory synapse numbers (representative images complementing those shown in Fig. 2a). j, Summary graph of the EPSC success rate during minimal stimulation experiments (Fig. 2d). k, Conditional Cbln2 deletion does not alter the coefficient of variation of AMPAR-EPSCs (left, representative traces; right, summary graph of coefficient of variation). l, Image of an acute slice of the hippocampal formation from a mouse infected with AAVs expressing Cre-eGFP (green), and illustration of the electrophysiological recording configuration. m, Conditional Cbln2 deletion does not alter the EPSC kinetics (left, EPSC rise time (20–80%); middle, EPSC decay constants at −70 mV fitted with double-exponential function; EPSC decay constants at +40 mV fitted with double-exponential function). Data in this panel and panel k were from the experiments shown in Fig. 2c. n, Constitutive Cbln2 deletion does not alter the AMPA/NMDA EPSC ratio at CA3-CA1 Schaffer collateral synapses (left, representative traces; right, summary graph). Both conditional and constitutive Cbln2 deletions cause a massive change in this ratio when analysed in subiculum synapses (see Fig. 2). o, Cumulative probability plots show that the conditional Cbln2 deletion in subiculum significantly shifts the distribution of AMPAR-EPSC amplitudes the right and of NMDAR-EPSC amplitudes to the left, as analysed during minimal stimulation experiments. Data are means ± s.e.m. (number of neurons/mice is indicated in the bars of d, e, j, k, m, n). Statistical significance was assessed by two-tailed Student’s t-test or two sample K-S test (*P ≤ 0.05, **P ≤ 0.01, and ***P ≤ 0.001; for exact P values, see source data; non-significant relations are not indicated).
Extended Data Fig. 3. Double deletion of GluD1 and Cbln2 produces the same phenotype as individual deletions of GluD1 and Cbln2 in hippocampal cultures.
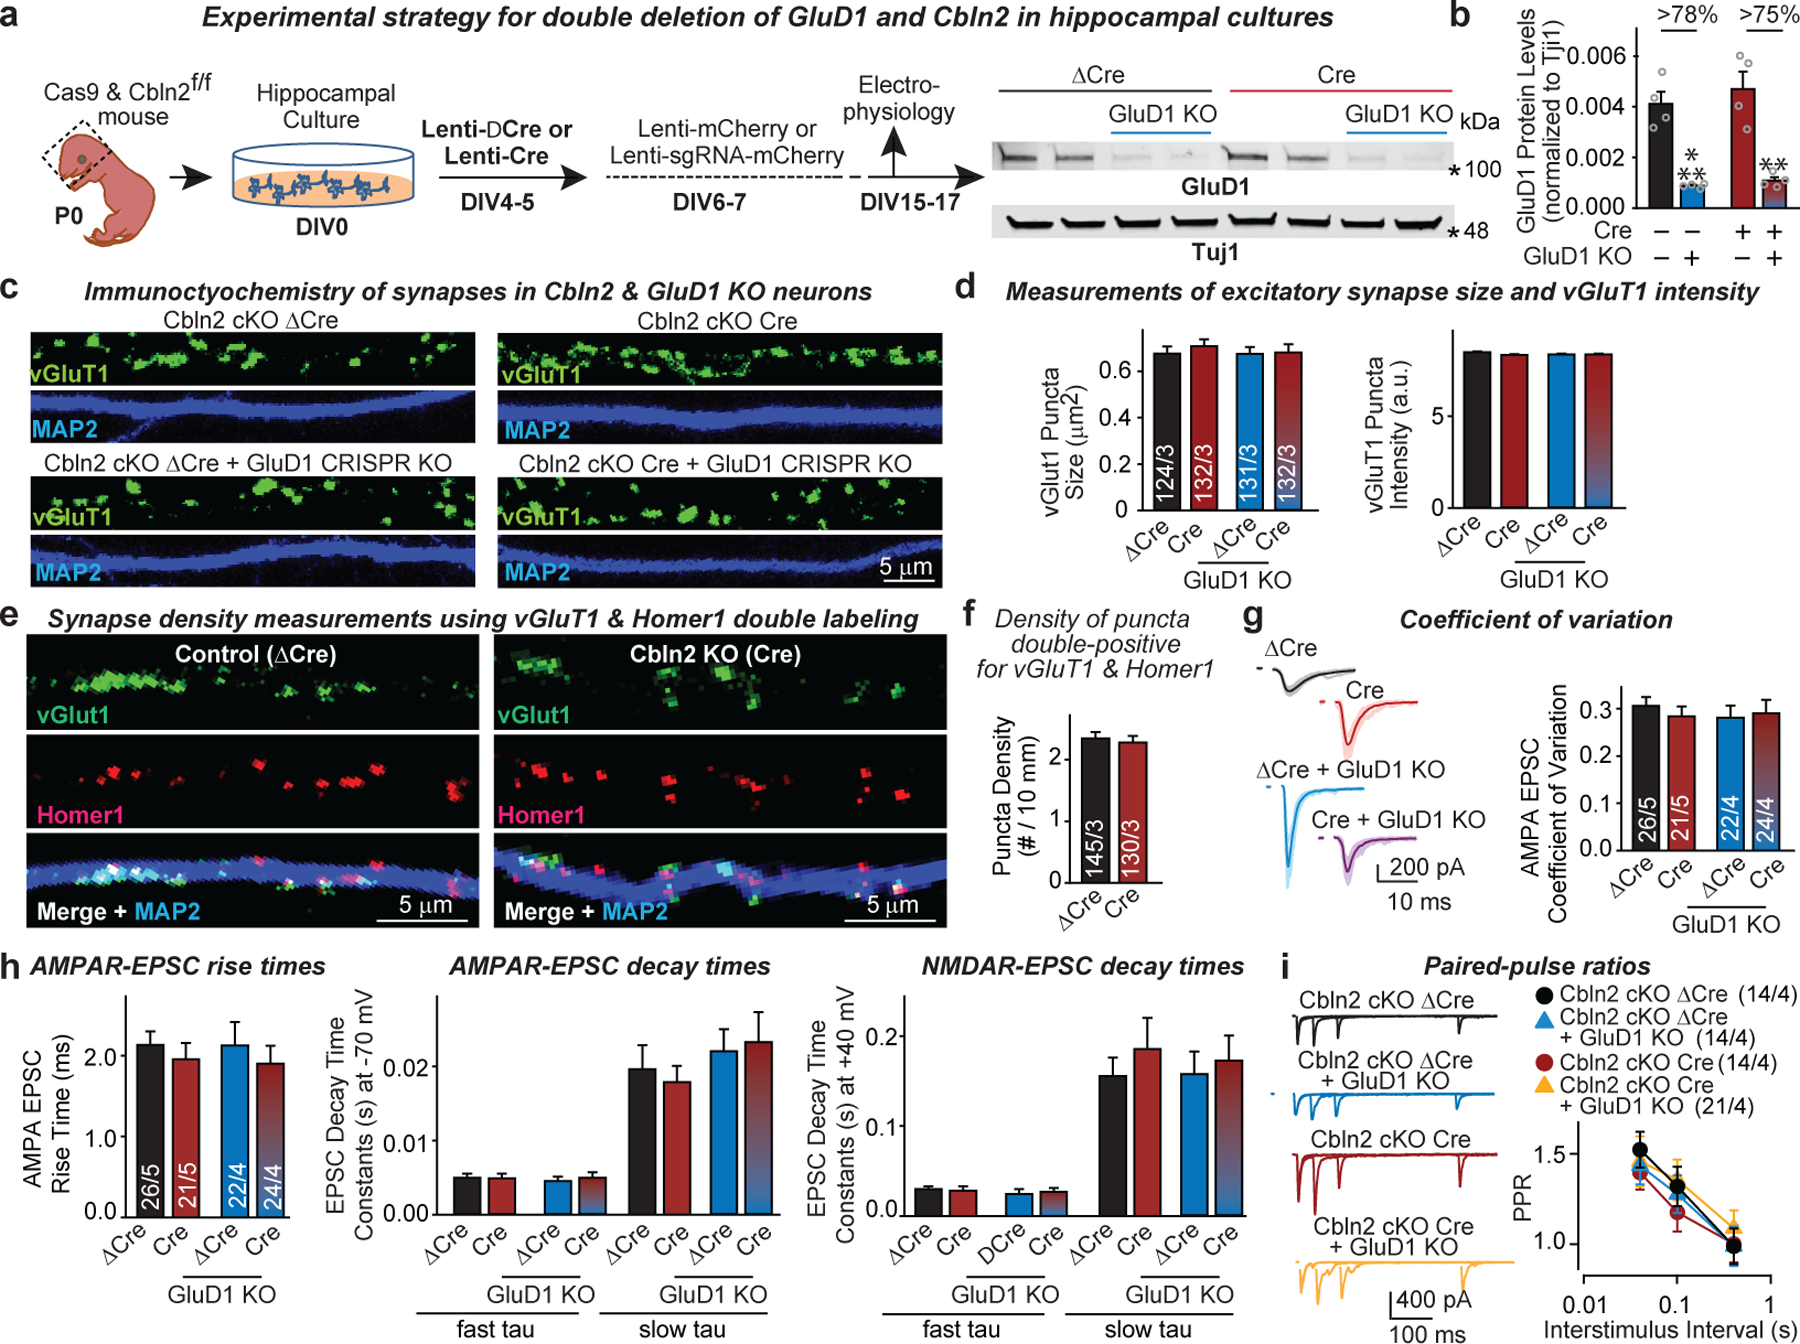
a, Experimental strategy. Hippocampal cultures from newborn mice expressing Cas9 on the Cbln2 cKO background (cas9 and Cbln2fl/fl) were infected with lentiviruses and analysed as indicated. Immunoblots on the right show that expression of the GluD1-directed sgRNA suppressed GluD1 protein levels with ΔCre or Cre co-expression (for additional data, please also see Supplementary Fig. 1b). b, Quantifications of GluD1 levels show that CRISPR-mediated deletion of GluD1 is efficient even after Cre-mediated deletion of Cbln2. GluD1 protein levels were measured by quantitative immunoblotting using fluorescent secondary antibodies in neurons of the indicated genotypes. c, Representative images of neurons stained for vGluT1 and MAP2. Merged images and analyses of synaptic properties are shown in Fig. 2h. d, Summary graphs of vGluT1 puncta size and vGluT1 staining intensity as a function of the Cbln2-GluD1 double deletion (additional analyses for Fig. 2h). e, f, Conditional Cbln2 deletion has no effect on excitatory synapse numbers in hippocampal neurons as analysed in independent experiments complementing those of Fig. 2, but using double labelling for a presynaptic (vGluT1) and postsynaptic marker (Homer1). Only double-positive puncta were quantified (representative images of neurons stained for vGluT1, Homer1 and MAP2 (e); summary graph of the density of vGluT1 & Homer1 double-positive synaptic puncta(f)). g, Double GluD1 and Cbln2 deletion does not alter the coefficient of variation of AMPAR-EPSCs (left, representative traces; right, summary graph of coefficient of variation). h, Double GluD1 and Cbln2 deletion does not alter EPSC kinetics (left, EPSC rise time (20–80%); middle, AMPAR-EPSC decay constants at −70 mV fitted with a double-exponential function; right, NMDAR-EPSC decay constants at +40 mV fitted with a double-exponential function). Data in g and h were from the experiments of Fig. 2i–l. i. Measurements of PPRs of evoked AMPAR-EPSCs show that the double GluD1 and Cbln2 deletion does not significantly alter PPRs (left, representative traces; right, summary plot of PPRs as a function of ISIs). Data are means ± s.e.m. (n’s in b, independent experiments (data points) are shown in bars; in d and f, dendrites/independent experiments; in g–i, neurons/independent experiments are listed). Statistical significance was assessed by two-tailed Student’s t-test or two-way ANOVA (**P ≤ 0.01, and ***P ≤ 0.001; for numerical P values, see source data; non-significant comparisons are not indicated).
Extended Data Fig. 4. Mechanism of Nrxn1βSS4+ and Nrxn3βSS4+ regulation of NMDARs and AMPARs.
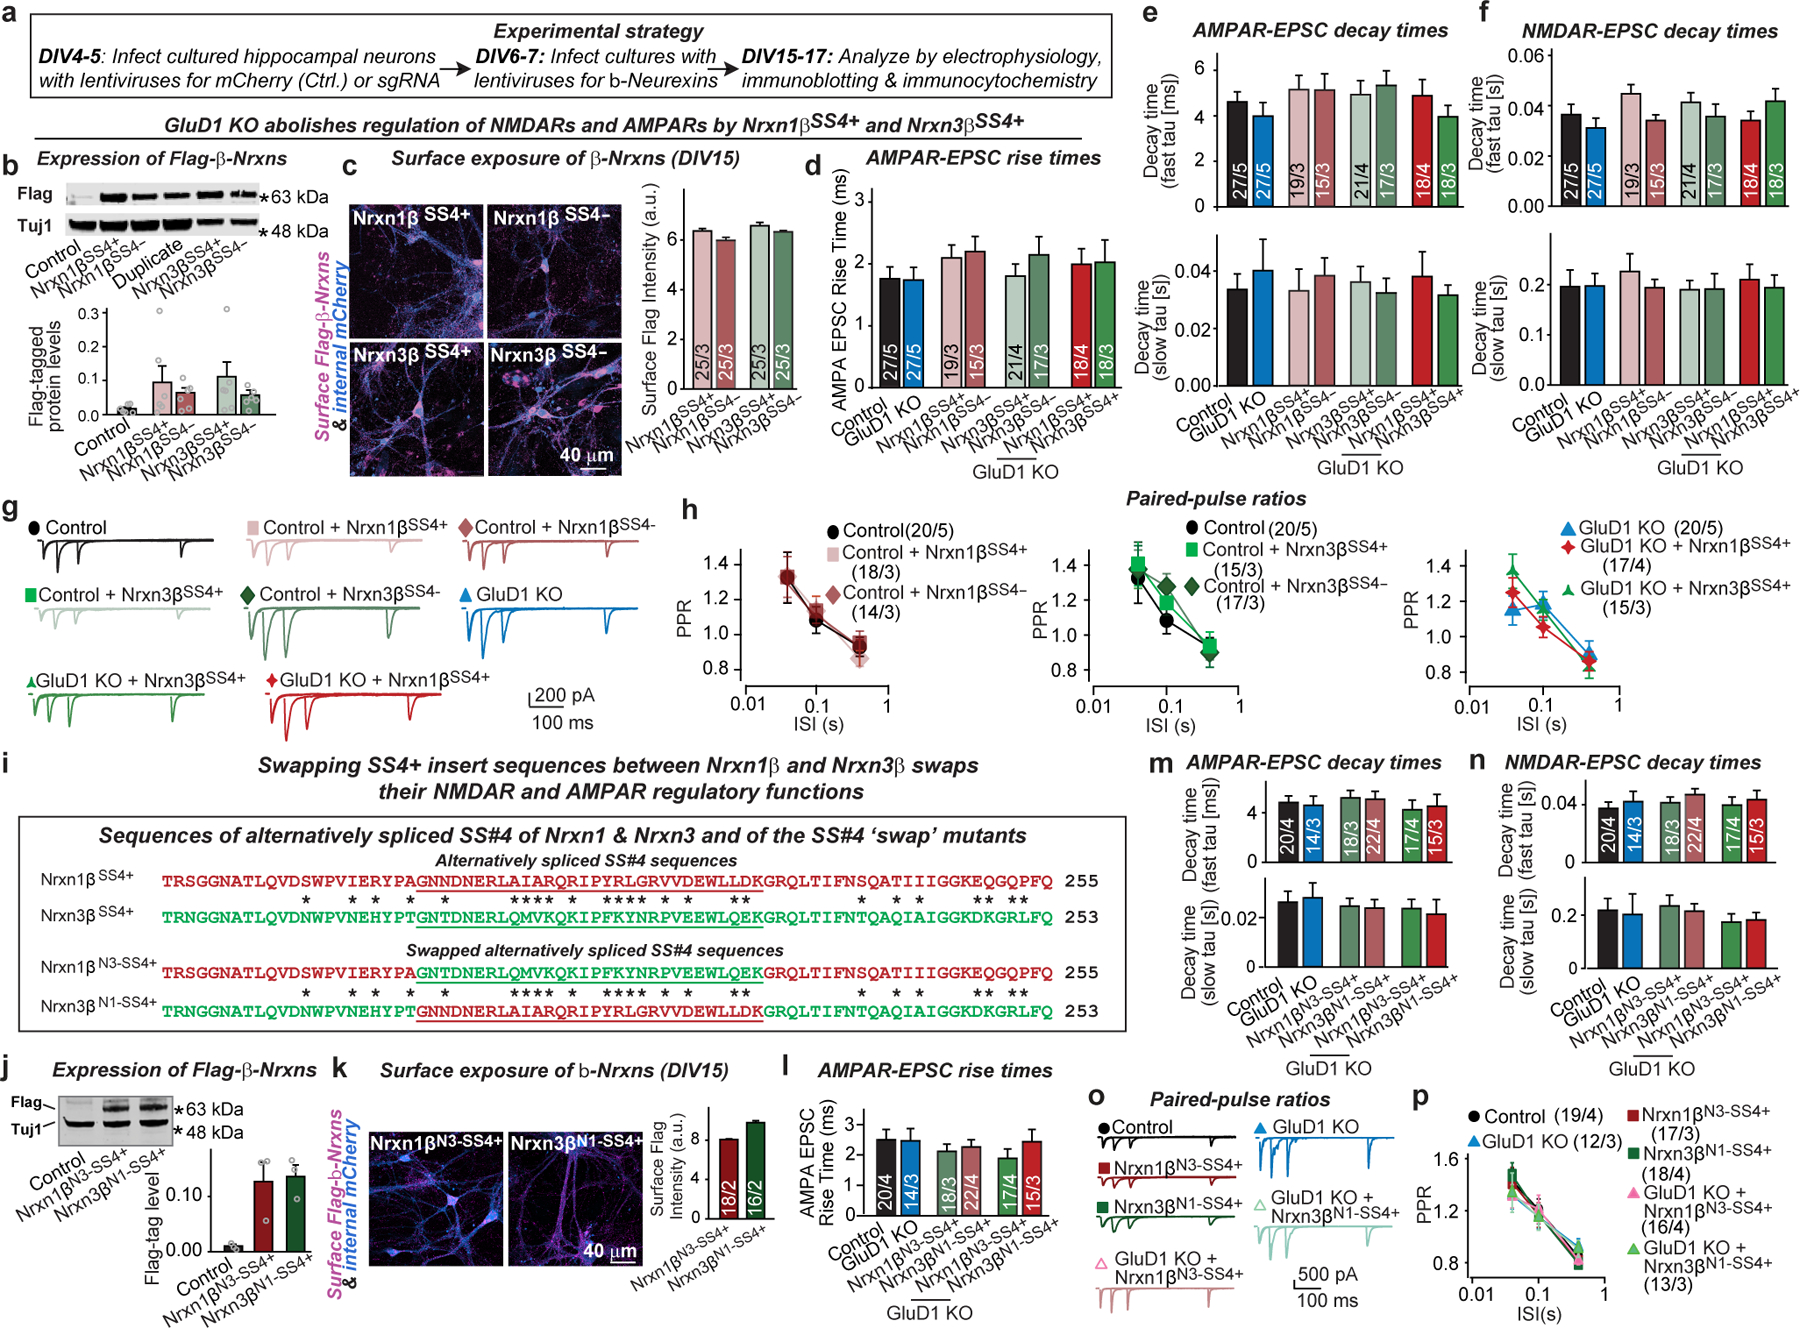
a, Experimental strategy for testing the effect of the CRISPR-mediated GluD1 deletion on Nrxn1βSS4+- and Nrxn3βSS4+-mediated signalling in hippocampal cultures. Neurons cultured from Cas9 mice were infected at DIV4–5 with lentiviruses expressing only mCherry or co-expressing mCherry and GluD1-sgRNA, and again at DIV 6–7 with lentiviruses expressing various Nrxn1β or Nrxn3β constructs. Neurons were analysed at DIV15–17. b, Nrxn1βSS4-, Nrxn1βSS4+, Nrxn3βSS4-, and Nrxn3βSS4+ are similarly expressed in hippocampal cultures (top, sample blots; bottom, quantification of protein levels using Flag-tag antibodies; for additional data, please also see Supplementary Fig. 1c). c, Quantifications of Nrxn1βSS4-, Nrxn1βSS4+, Nrxn3βSS4-, and Nrxn3βSS4+ surface levels show that all constructs are efficiently transported to the cell-surface (left, representative images; right, summary graphs of the staining intensity of surface Flag-tagged proteins). Neurons were prepared as described in a. d–h, Nrxn1βSS4-, Nrxn1βSS4+, Nrxn3βSS4-, and Nrxn3βSS4+ expression and GluD1 deletions, alone or in combination, did not change the kinetics of AMPAR- and NMDAR-EPSCs or the PPRs of AMPAR-EPSCs (AMPAR-EPSC rise time (20–80%) (d); AMPAR-EPSC decay constants at −70 mV fitted with double-exponential function [top, fast component; bottom, slow component] (e); NMDAR-EPSC decay constants at +40 mV fitted with double-exponential function [top, fast component; bottom, slow component] (f); representative PPR traces (g); summary graphs of PPRs as a function of inter-stimulus intervals (h)). Data are from experiments in Fig. 3. i, Sequences of the alternatively spliced inserts of Nrxn1βSS4+ and Nrxn3βSS4+ and of the ‘swap’ mutants of these alternatively spliced inserts, referred to as Nrxn1βN3-SS4+ and Nrxn3βN1-SS4+, in which the SS4+ sequence of Nrxn1βSS4+ is introduced into Nrxn3βSS4+, and vice versa. j, k, Same as b and c, but with expression of Nrxn1βN3-SS4+ and Nrxn3βN1-SS4+ (for additional data, please also see Supplementary Fig. 1d). l–p, Nrxn1βN3-SS4+ and Nrxn3βN1-SS4+, alone or in combination with the GluD1 KO, do not change the kinetics of AMPAR- and NMDAR-EPSCs or the paired-pulse ratio of AMPAR-EPSCs (AMPAR-EPSC rise time (20–80%) (l); AMPAR-EPSC decay constants at −70 mV fitted with a double-exponential function (m); NMDAR-EPSC decay constants at +40 mV fitted with a double-exponential function (n); representative PPR traces (o); summary graphs of PPRs as a function of inter-stimulus intervals (p)). Data are from experiments in Fig. 3. Data are means ± s.e.m.; independent experiments (data points) are shown in bars (b, j); numbers of sections/independent experiments are shown in bars (c, k); neurons/independent experiments are listed (d–f, h, l–n, p). Please see source data for details.
Extended Data Fig. 5. Design of GluD1 mutant proteins and of minimal GluD1-CD4 and GluD2-CD4 proteins.
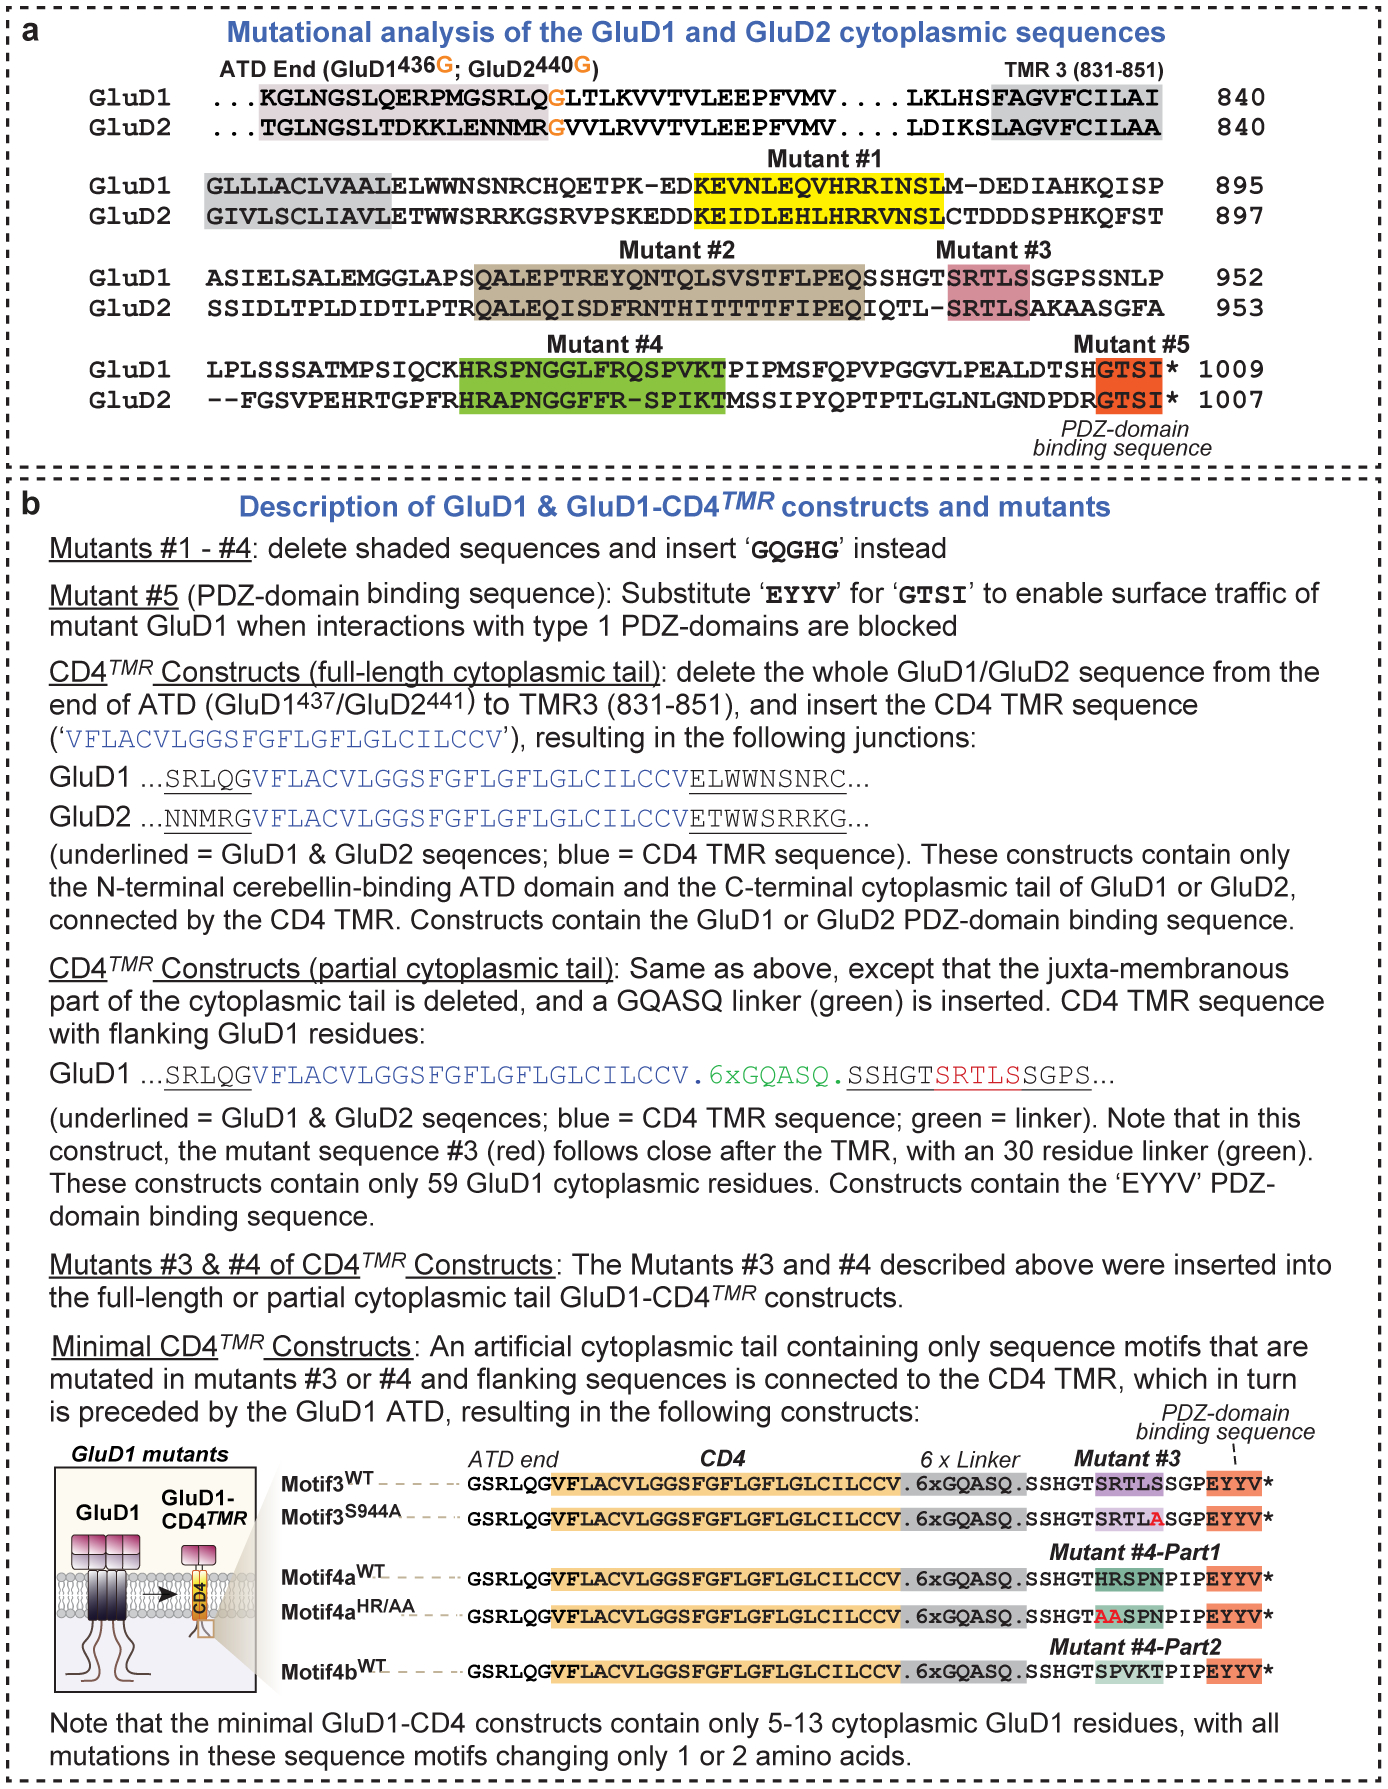
a, Alignment of the C-terminal sequences of mouse GluD1 and GluD2 to illustrate the location of cytoplasmic tail mutations in GluD1 and the positions where GluD sequences were fused to the CD4 transmembrane region in the GluD1-CD4TMR and GluD2-CD4TMR constructs (dotted lines indicate sequence not shown; ATD, amino-terminal domain; TMR 3, third transmembrane region that is followed by the cytoplasmic tail). The five highly conserved sequence motifs in the cytoplasmic C-terminal sequence that were mutated in rescue constructs are highlighted and labelled. In mutants #1–#4, the four internal sequence motifs #1–#4 were replaced by the same GQGHG sequences. The consensus sequence for type 1 PDZ domains at the very C terminus of GluD1 and GluD2 (GTSI) was replaced with a consensus sequence for type 2 PDZ domains (EYYV). This replacement blocks the interaction of the C-terminal PDZ-domain binding sequence of GluD1 with type 1 PDZ-domain proteins, an interaction that has a well documented essential function for GluD2 in cerebellar long-term synaptic plasticity31,32. b, List and description of all GluD1 and GluD2 mutants analysed. In the hybrid GluD1-CD4TMR and GluD2-CD4TMR constructs, all GluD1 and GluD2 sequences from the end of the ATD (that is, the beginning of the presumptive glutamate-binding domain) until the end of the last (3rd) TMR (for GluD1, residues 437–851; for GluD2, residues 441–851) were replaced by a linker and the TMR of CD4 (see shown sequences). As a result, GluD-CD4TMR hybrid proteins lack the TMRs and presumptive glutamate-binding domain of GluDs. In addition, GluD1-CD4TMR and GluD2-CD4TMR contain a shortened cytoplasmic tail with only 59 GluD1 residues, lacking the juxta-membranous part of the cytoplasmic tail. The minimal GluD1-CD4TMR constructs contain only short sequence motifs (5–13 residues) that are mutated in mutants #3 or #4.
Extended Data Fig. 6. GluD1 mutants and GluD1-CD4TMR and GluD2-CD4TMR constructs express well on the neuronal cell surface.

a, Experimental strategy for rescue experiments with GluD1 and GluD2 rescue constructs in GluD1-deficient in hippocampal cultures from Cas9 mice. Cells were infected at DIV4–5 with lentiviruses expressing mCherry only or mCherry together with the GluD1 sgRNA, and again at DIV 6–7 with lentiviruses expressing the wild-type and mutant GluD1 and GluD2 constructs. Neurons were analysed at DIV15–17. b–d, Most mutant GluD1 and GluD2 proteins are similarly expressed in hippocampal cultures (representative immunoblots (for additional data, please also see Supplementary Fig. 1e–g) (b, c); quantification of GluD1 and GluD2 expression using GluD1 antibodies [top] or HA-antibodies recognizing the HA-epitope tag that was added to the N terminus of the rescue proteins [bottom] (d)). Note that although some constructs do not express as well as others (for example, mutant #5), all constructs were overexpressed compared to endogenous GluD1 protein levels. e, f, Quantifications of the surface levels of GluD1 and GluD2 rescue proteins reveal efficient transport of all proteins to the cell-surface. Surface exposure was measured using staining of non-permeabilized fixed neurons with antibodies to extracellular epitopes (representative images (e); summary graphs of the staining intensity of internal HA-tagged proteins (top of panel), of surface HA-tagged proteins (middle of panel) and the ratio of surface/total proteins (bottom of panel) (f)). Neurons were stained first for surface HA before permeabilization, and then for internal HA after permeabilization using different HA antibodies. Data are means ± s.e.m. (independent experiments (data points) are shown in bars for d, sections/independent experiments are shown in the bars for f. Please see source data for details.
Extended Data Fig. 7. Analysis of EPSC kinetics and PPRs in various rescue experiments with cultured GluD1-deficient neurons.
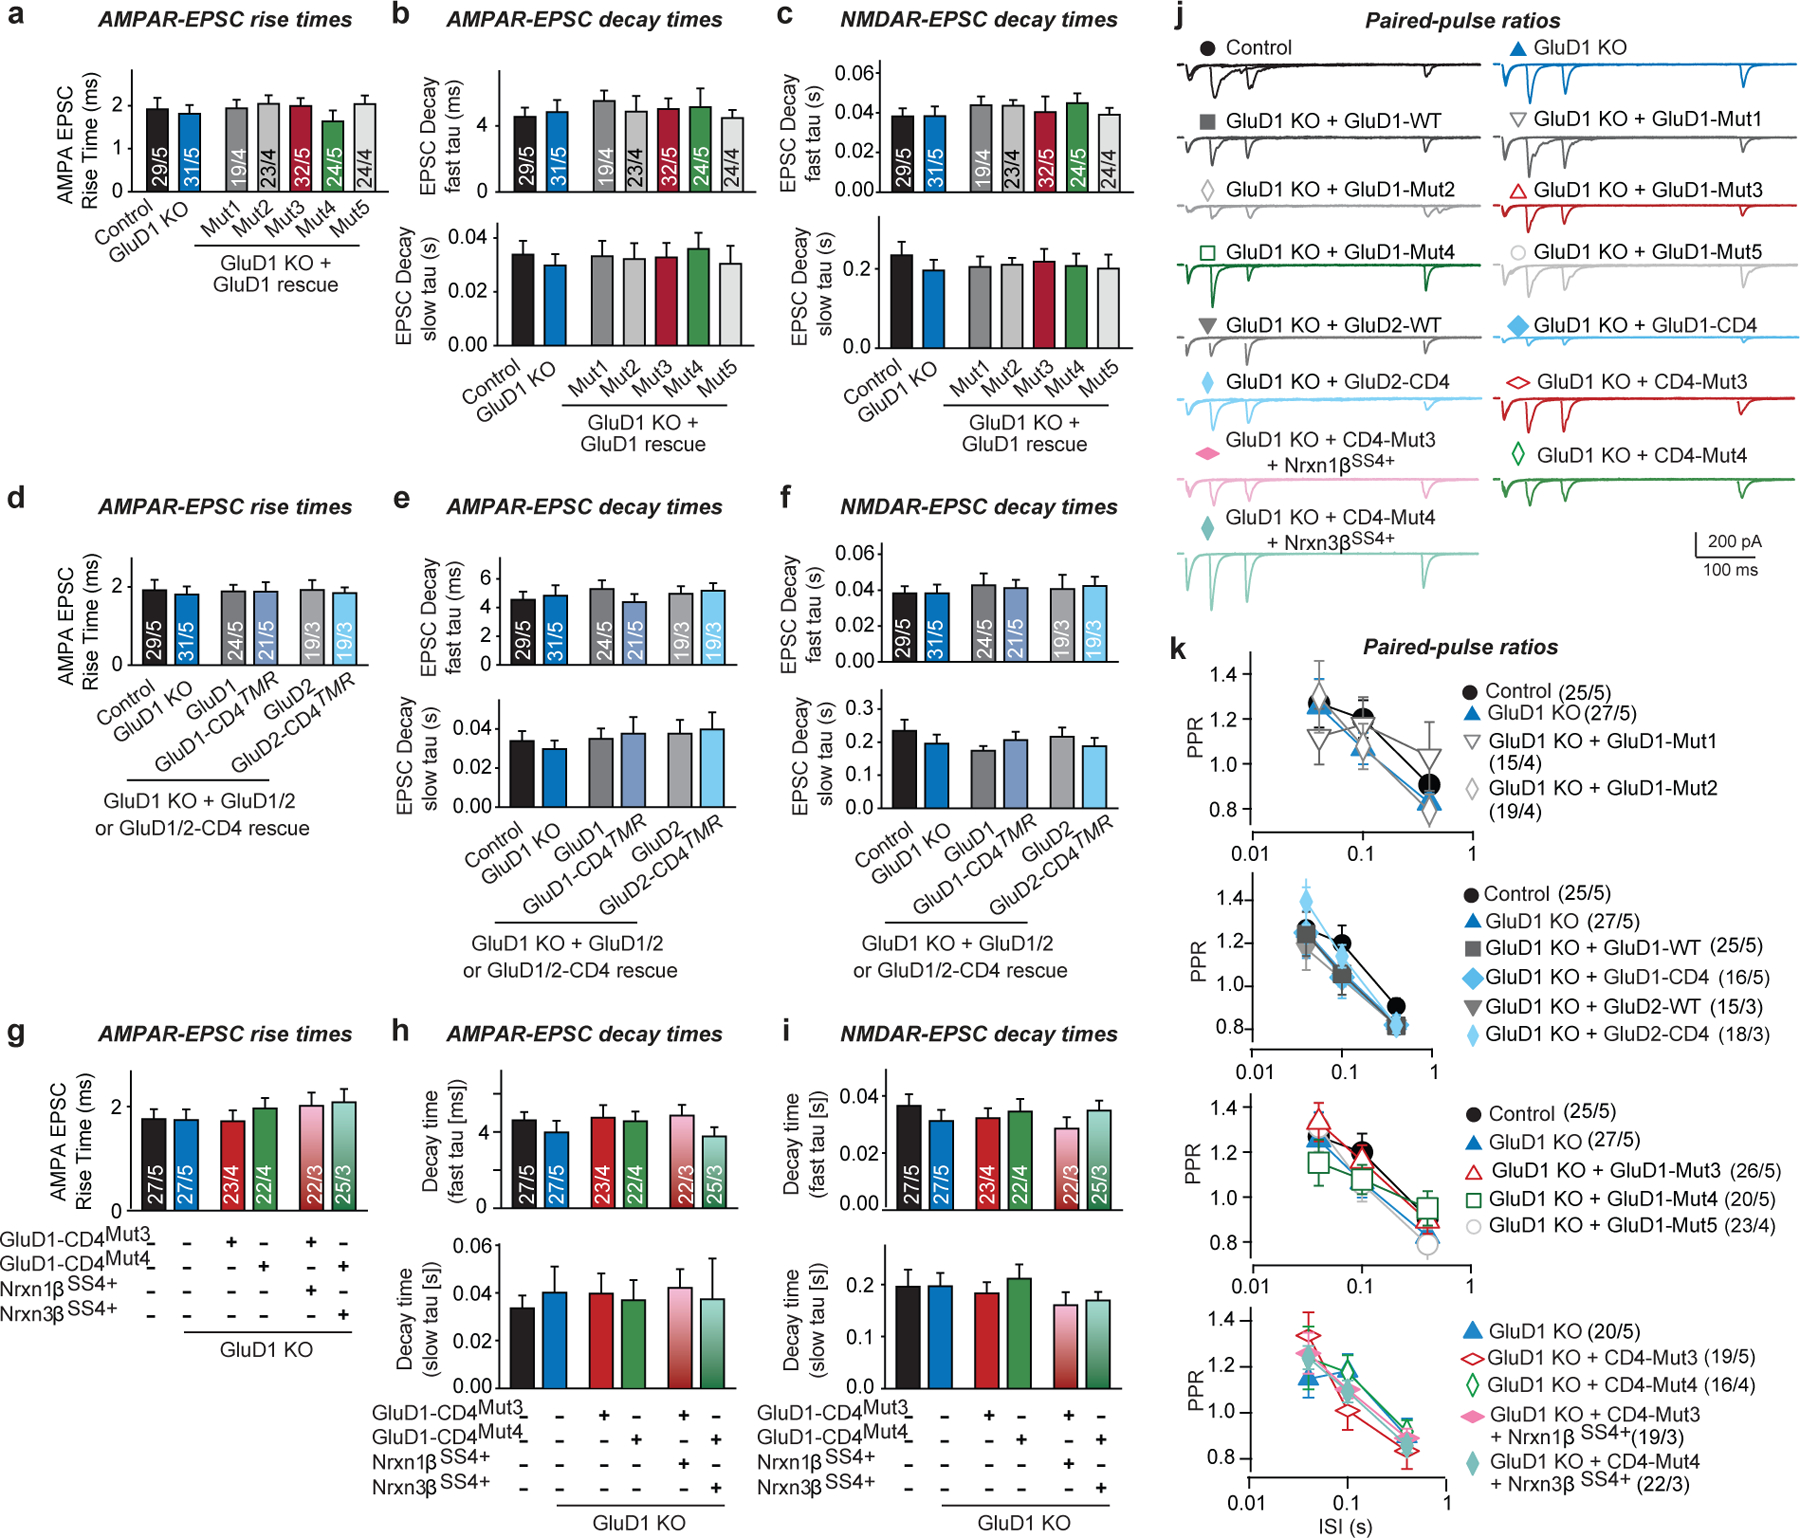
a–i, Quantification of EPSC kinetics for measurements of evoked EPSCs under various GluD1 KO and rescue conditions as indicated, demonstrating that the EPSC kinetics do not change with any experimental manipulation (EPSC rise time (20–80%) (a, d, g); AMPAR-EPSC decay constants recorded at −70 mV and fitted with a double-exponential function (top, fast component; bottom, slow component (b, e, h); NMDAR-EPSC decay constants recorded at +40 mV and fitted with a double-exponential function (top, fast component; bottom, slow component (c, f, i)). Data are from the experiments described in Figs. 4c–e, n–p, 5c–e. j, Representative traces of PPR recordings in cultured neurons under the indicated conditions. k, Summary graphs of the PPRs as a function of the inter-stimulus intervals under the indicated conditions. Data are means ± s.e.m. (for a–i, n values are shown in Figs. 4c–e, n–p, 5c–e; for j, k, neurons/independent experiments are shown in k). Statistical significance was assessed by two-tailed Student’s t-test or two-way ANOVA. No statistically significant differences were observed. Please see source data for details.
Extended Data Fig. 8. Analysis of wild-type and mutant GluD1N-CD4TMR-GluD935–993 proteins.
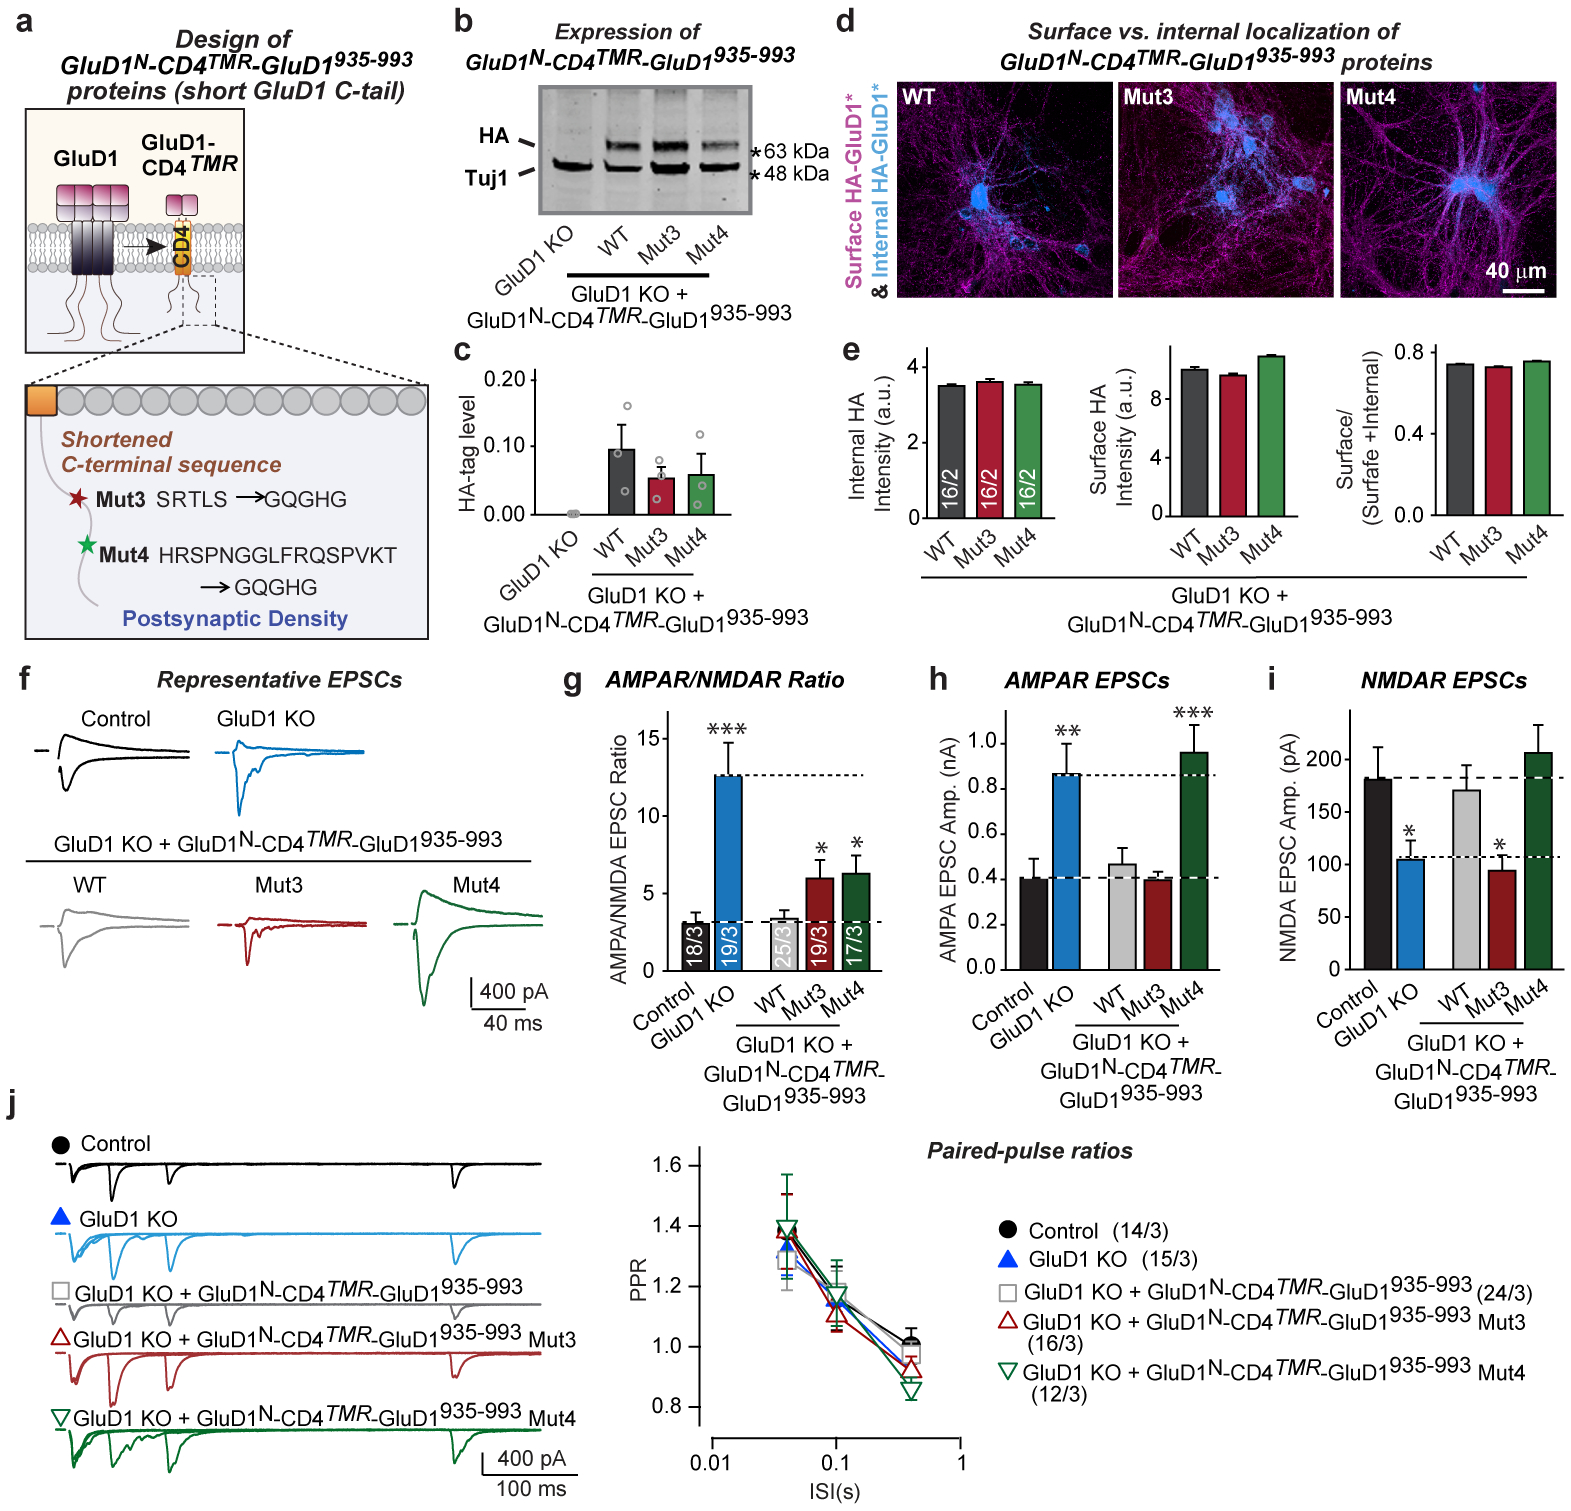
a, Design of wild-type and mutant GluD1N-CD4TMR-GluD935–993 constructs, corresponding to the GluD1-CD4TMR construct (Fig. 4l) with a greatly shortened C-terminal tail. In the Mut3 and Mut4 constructs, the internal sequence motifs were replaced by the same ‘GQGHG’ sequence, and the C-terminal ‘GTSI’ sequence was mutated to ‘EYYV’ (Extended Data Fig. 5). b, c, Immunoblotting analyses show that most mutant GluD1 proteins are similarly expressed in hippocampal cultures (representative immunoblots (b); quantification of GluD1 expression using the HA-epitope tag that was added to the N terminus of the rescue proteins (c); for additional data, please also see Supplementary Fig. 1h). d, e, Quantifications of GluD1 rescue protein surface levels show that wild-type and Mut3- and Mut4-mutant GluD1N-CD4TMR-GluD935–993 proteins are efficiently transported to the cell-surface (representative images (d); summary graphs of the staining intensity of internal HA-tagged proteins (left), of surface HA-tagged proteins (middle) and the ratio of surface/total proteins (right) (e)). Surface exposure was measured by staining neurons first for surface HA before permeabilization, and then for internal HA after permeabilization using different HA antibodies. f, Representative traces of evoked AMPAR- and NMDAR-EPSCs recorded in hippocampal cultures without or with the GluD1 deletion and rescue with WT, Mut3, and Mut4 GluD1N-CD4TMR-GluD1935–993 constructs. g, Summary graphs of the AMPA/NMDA ratio illustrating that the GluD1 deletion enhances the AMPA/NMDA ratio ~300%, that the WT GluD1N-CD4TMR-GluD1935–993 construct fully rescues this phenotype, but that Mut3- and Mut4-mutant GluD1N-CD4TMR-GluD1935–993 constructs only partly rescue. Neurons were infected with lentiviruses encoding mCherry without or with the GluD1 sgRNA at DIV4–5, re-infected with lentiviruses encoding various GluD1 constructs at DIV6–7, and analysed at DIV15–17. h, i, Summary graphs of the amplitudes of AMPAR-EPSCs (h) and NMDAR-EPSCs (i) demonstrating that the GluD1 deletion increases AMPARs (~150%) but decreases NMDARs (~40%), and that WT GluD1N-CD4TMR-GluD1935–993 fully rescues both phenotypes, whereas Mut3-mutant GluD1N-CD4TMR-GluD1935–993 rescues only the AMPAR but not the NMDAR phenotype and Mut4-mutant GluD1N-CD4TMR-GluD1935–993 rescues only the NMDAR but not the AMPAR phenotype. j, None of the GluD1 manipulations affects the PPR of AMPAR-EPSCs (left, representative traces of PPR recordings; right, summary graphs of PPRs as a function of the inter-stimulus intervals). Data are means ± s.e.m. (n values are shown in bars: independent experiments (data points) (c); sections/independent experiments (e); neurons/independent experiments (g, j)). Statistical significance was assessed by two-tailed Student’s t-test or two-way ANOVA (*P ≤ 0.05, **P ≤ 0.01, and ***P ≤ 0.001; for numerical P values, see source data; non-significant comparisons are not indicated).
Extended Data Fig. 9. Validation of minimal GluD1-CD4TMR proteins containing only short cytoplasmic GluD1 sequence motifs.
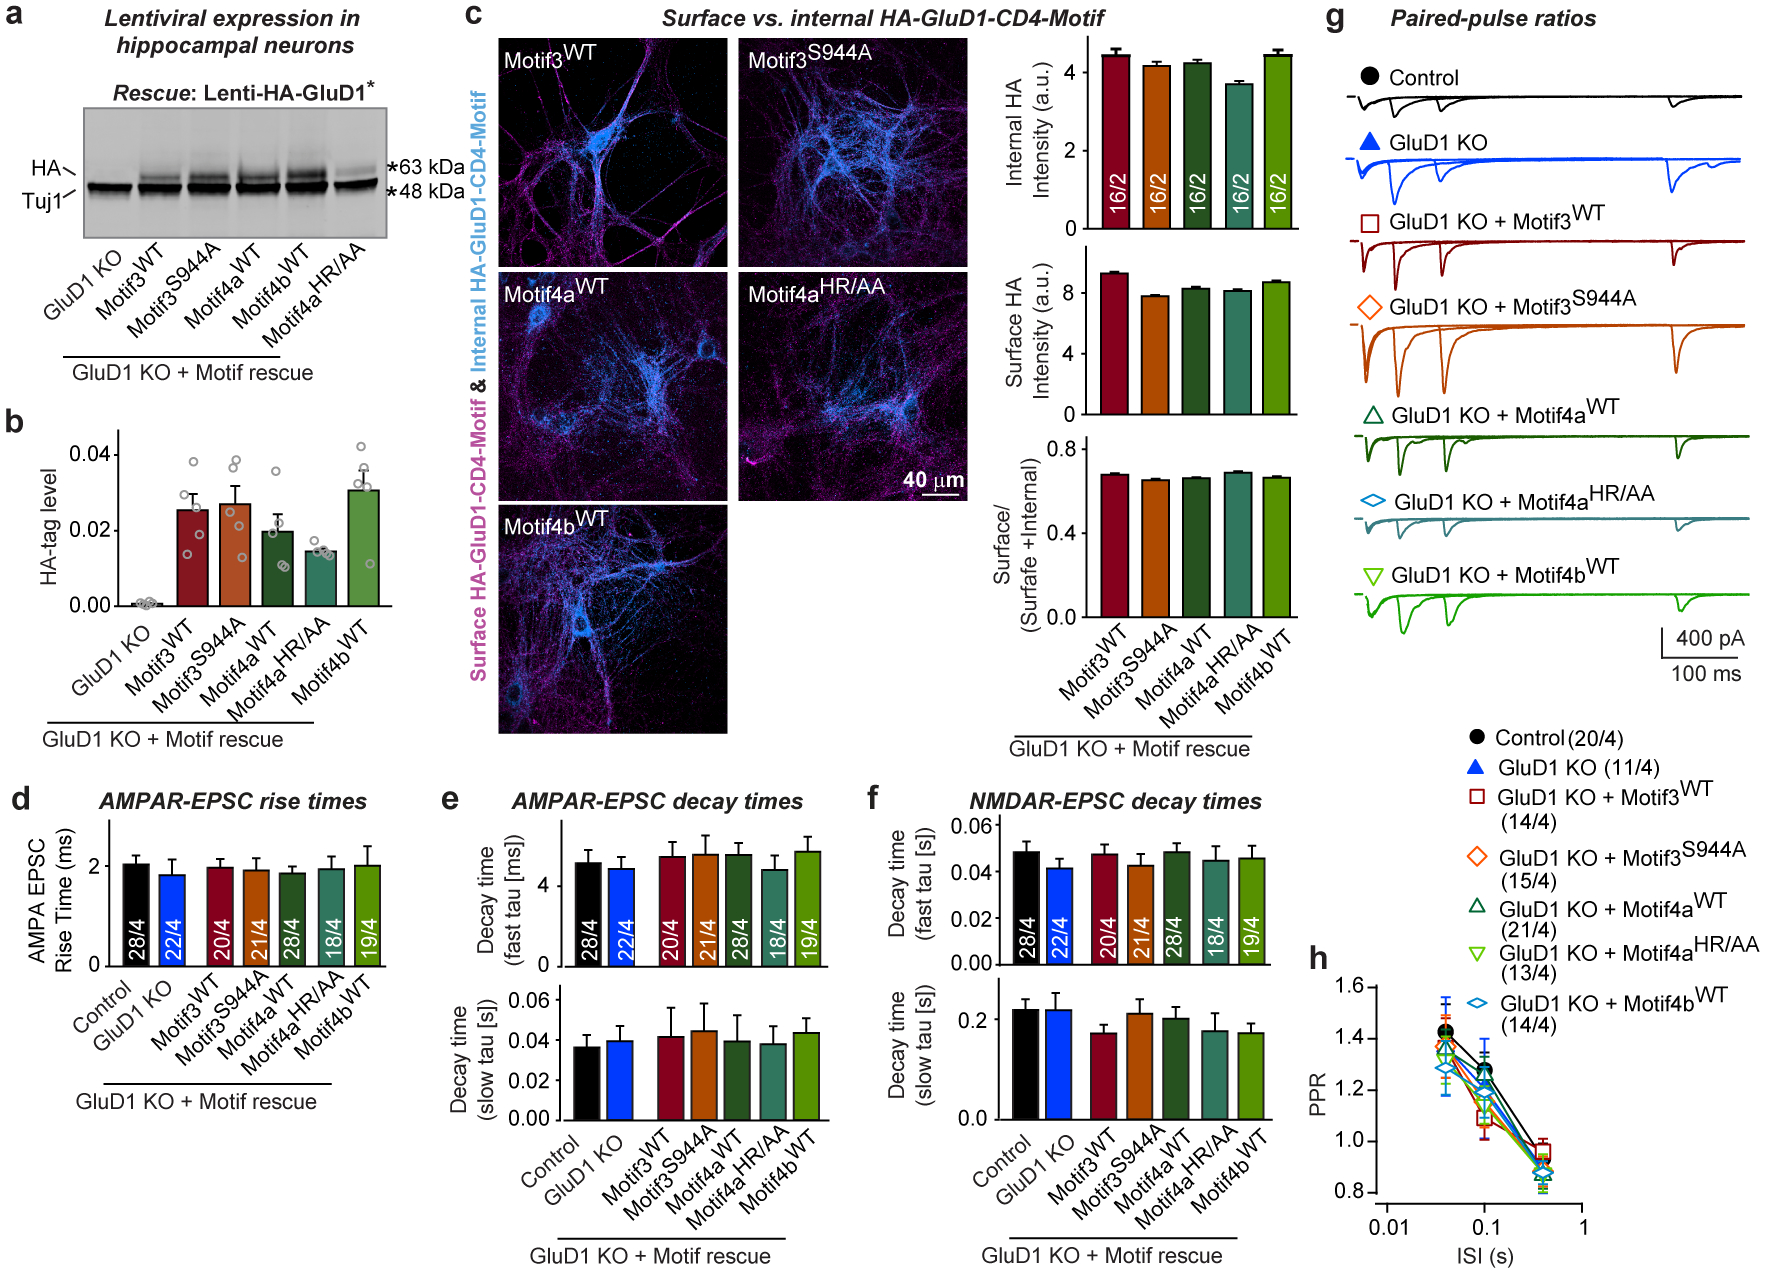
a, b, Minimal GluD1-CD4TMR proteins containing only short cytoplasmic GluD1 sequence motifs proteins are expressed at similar levels in cultured hippocampal neurons (representative immunoblots (a); quantification of GluD1 expression using the N-terminal HA-epitope tag of rescue proteins (b); for additional data, please also see Supplementary Fig. 1i). See Extended Data Fig. 5 for an explanation of the constructs used. c, Surface quantifications show that all minimal GluD1-CD4TMR proteins are efficiently transported to the cell-surface (left, representative images; right, summary graphs of the staining intensity of internal HA-tagged proteins (top), of surface HA-tagged proteins (middle) and of the ratio of surface/total proteins (bottom panel)). Surface exposure was measured by staining neurons first for surface HA before permeabilization, and then for internal HA after permeabilization using different HA antibodies. Controls demonstrated that fixed non-permeabilized cells are impermeant to antibodies. d–f, Summary graphs demonstrating that minimal GluD1-CD4TMR proteins do not change the NMDAR- or AMPAR-EPSC kinetics (AMPAR-EPSC rise times (20–80%) (d); AMPAR-EPSC decay constants at −70 mV fitted with a double-exponential function (top, fast component; bottom, slow component) (e); NMDAR-EPSC decay constants at +40 mV fitted with a double-exponential function (top, fast component; bottom, slow component) (f)). Data are from the experiments in Fig. 5g–i. g, h, The GluD1 deletion without or with expression of minimal GluD1-CD4TMR rescue constructs does not change the paired-pulse ratio (PPR) of AMPAR-EPSCs (representative traces (g); summary graphs of PPRs as a function of the inter-stimulus intervals under the indicated conditions (h)). Data are means ± s.e.m. (number in bars: independent experiments (data points) (b); sections/independent experiments (c); neurons/independent experiments (h); numbers of cells/independent experiments for d–f are given in Fig. 5). Statistical significance was assessed by two-tailed Student’s t-test or two-way ANOVA. No statistically significant differences were observed. Please see source data for details.
Extended Data Fig. 10. Mechanistic model of Nrxn1SS4+→Cbln2→GluD1→NMDAR and Nrxn3SS4+→Cbln2→GluD1→AMPAR signalling pathways.
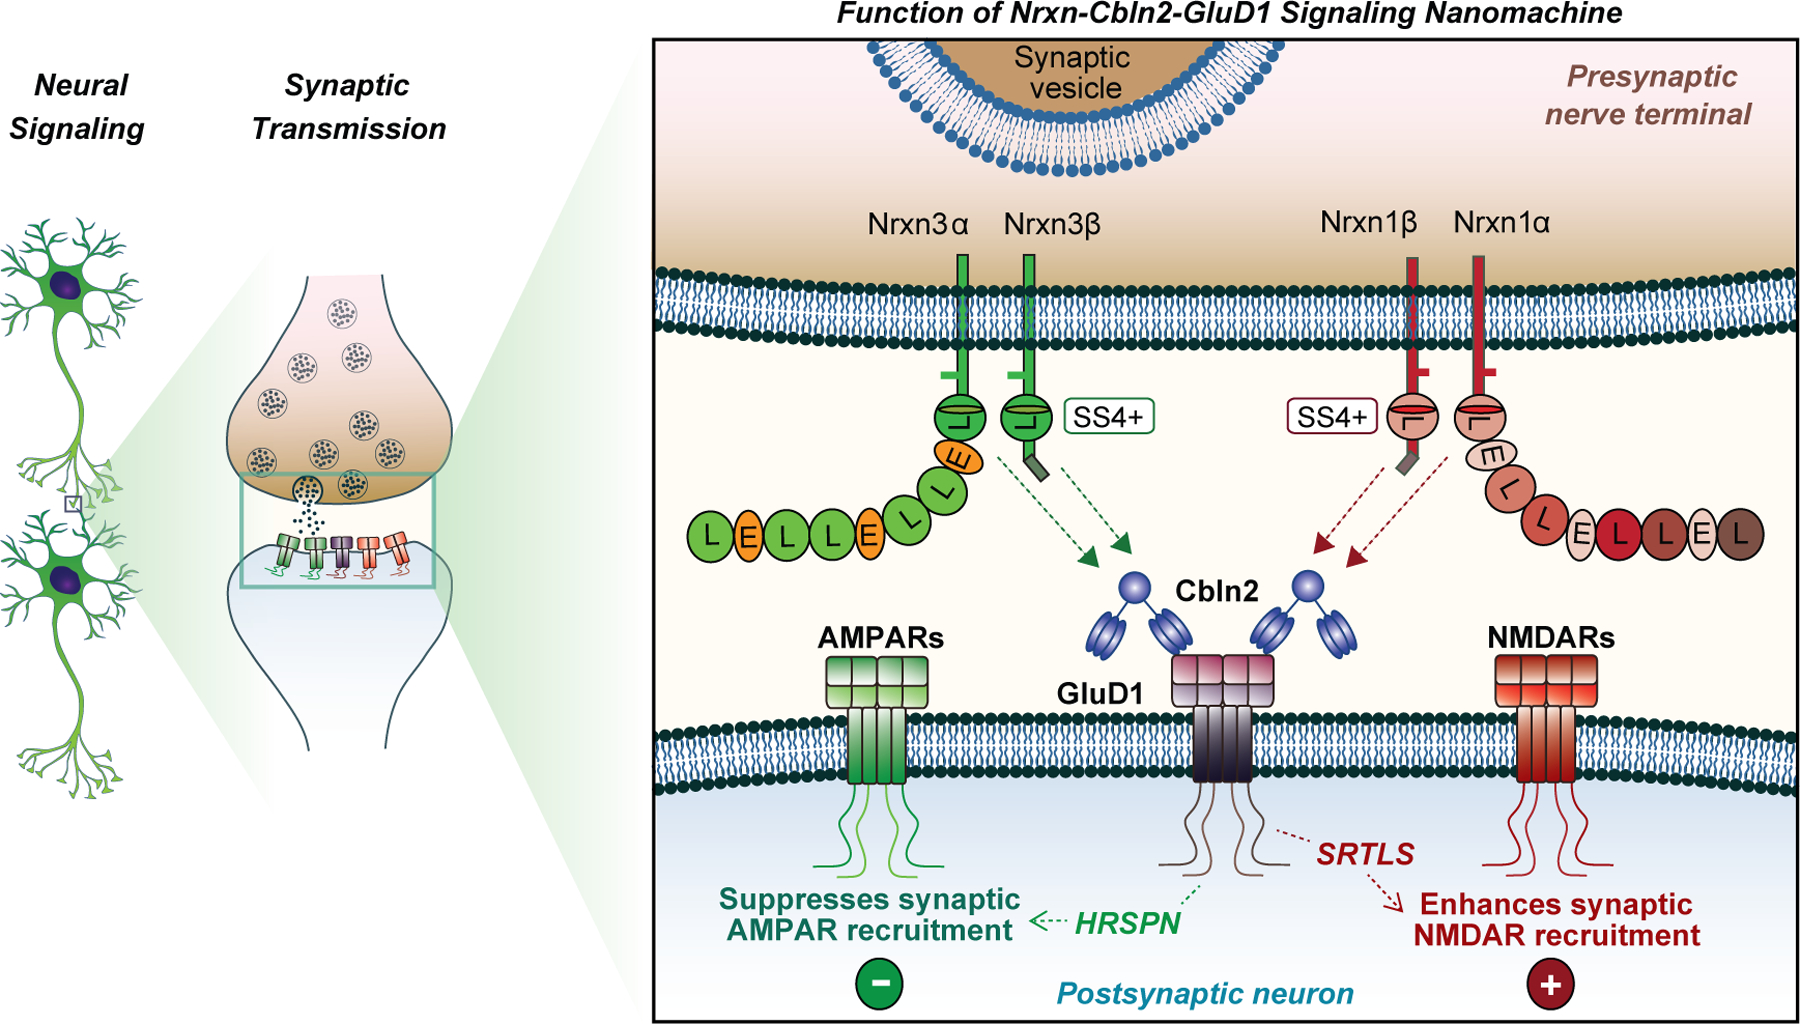
The model, based on the present data, proposes that Nrxn1- and Nrxn3-alternative splicing at SS4 regulates the postsynaptic content of AMPARs and NMDARs at hippocampal synapses in the subiculum but not the CA1 region by binding to Cbln2, which in turn binds to GluD1 (see Figs. 1 and 2). Surprisingly, binding to the same GluD1-Cbln2 complex enables Nrxn1SS4+ to enhance NMDARs but not AMPARs, whereas binding of Nrxn3SS4+ to the GluD1-Cbln2 complex suppresses AMPARs but not NMDARs (see Fig. 3). Signal transduction by the Nrxn1SS4+-Cbln2-GluD1 and Nrxn3SS4+-Cbln2-GluD1 assemblies is mediated by distinct cytoplasmic GluD1 sequences (HRSPN for AMPAR regulation by Nrxn3SS4+, SRTLS for NMDAR regulation by Nrxn1SS4+), suggesting that GluD1 couples Nrxn1SS4+ and Nrxn3SS4+ signals to distinct effector sequences (see Figs. 4 and 5). Since GluD1 and GluD2 constructs lacking the native GluD1 transmembrane architecture are fully active (see Fig. 4 and 5), binding of Nrxn1SS4+-Cbln2 and Nrxn3SS4+-Cbln2 complexes to the ATD of GluD1 (and of GluD2) activates a transmembrane signal without inducing a conformational change in the transmembrane regions of GluDs.
Supplementary Material
Acknowledgements
We thank L. Chen for advice and the laboratory of H. Hirai for plasmids. This study was supported by a grant from the NIMH (MH052804 to T.C.S.) and fellowships to K.L.-A. from the European Molecular Biology Organization (ALTF 803-2017) and the Larry L. Hillblom Foundation (2020-A-016-FEL).
Footnotes
Competing interests
The authors declare no competing interests.
Supplementary information
Original full-sized immunoblots for all protein level analyses.
Data Availability
Exact P values are included with the source data. Source data are provided with this paper.
REFERENCES
- 1.Uemura T, et al. Trans-synaptic interaction of GluRdelta2 and Neurexin through Cbln1 mediates synapse formation in the cerebellum. Cell 141, 1068–1079 (2010). [DOI] [PubMed] [Google Scholar]
- 2.Joo JY, Lee SJ, Uemura T, Yoshida T, Yasumura M, Watanabe M, & Mishina M Differential interactions of cerebellin precursor protein (Cbln) subtypes and neurexin variants for synapse formation of cortical neurons. Biochem Biophys Res Commun. 406, 627–632 (2011). [DOI] [PubMed] [Google Scholar]
- 3.Matsuda K, et al. Cbln1 is a ligand for an orphan glutamate receptor delta2, a bidirectional synapse organizer. Science 328, 363–368 (2010). [DOI] [PubMed] [Google Scholar]
- 4.Yuzaki M & Aricescu AR A GluD Coming-Of-Age Story. Trends in Neurosciences 40, 138–150 (2017). [DOI] [PMC free article] [PubMed] [Google Scholar]
- 5.Dai J, Aoto J & Südhof TC Alternative Splicing of Presynaptic Neurexins Differentially Controls Postsynaptic NMDA and AMPA Receptor Responses. Neuron (2019). [DOI] [PMC free article] [PubMed] [Google Scholar]
- 6.Aoto J, Martinelli DC, Malenka RC, Tabuchi K & Südhof TC Presynaptic neurexin-3 alternative splicing trans-synaptically controls postsynaptic AMPA receptor trafficking. Cell 154, 75–88 (2013). [DOI] [PMC free article] [PubMed] [Google Scholar]
- 7.Zhu F, et al. Architecture of the Mouse Brain Synaptome. Neuron 99, 781–+ (2018). [DOI] [PMC free article] [PubMed] [Google Scholar]
- 8.Nusser Z Creating diverse synapses from the same molecules. Current Opinion in Neurobiology 51, 8–15 (2018). [DOI] [PubMed] [Google Scholar]
- 9.Huganir RL & Nicoll RA AMPARs and synaptic plasticity: the last 25 years. Neuron 80, 704–717 (2013). [DOI] [PMC free article] [PubMed] [Google Scholar]
- 10.Nakazawa K, Sapkota K. The origin of NMDA receptor hypofunction in schizophrenia. Pharmacol Ther 205, 107426 (2020). [DOI] [PMC free article] [PubMed] [Google Scholar]
- 11.Singh T, Neale BM, & Daly MJ Exome sequencing identifies rare coding variants in 10 genes which confer substantial risk for schizophrenia. medRxiv doi: 10.1101/2020.09.18.20192815 (2020) [DOI] [Google Scholar]
- 12.Südhof TC Synaptic Neurexin Complexes: A Molecular Code for the Logic of Neural Circuits. Cell 171, 745–769 (2017). [DOI] [PMC free article] [PubMed] [Google Scholar]
- 13.Gomez AM, Traunmüller L, Scheiffele P. Neurexins: molecular codes for shaping neuronal synapses. Nat Rev Neurosci. 2021. Mar;22(3):137–151. [DOI] [PMC free article] [PubMed] [Google Scholar]
- 14.Hu ZH, Xiao X, Zhang ZH & Li M Genetic insights and neurobiological implications from NRXN1 in neuropsychiatric disorders. Mol Psychiatr 24, 1400–1414 (2019). [DOI] [PubMed] [Google Scholar]
- 15.Elegheert J, et al. Structural basis for integration of GluD receptors within synaptic organizer complexes. Science 353, 295–299 (2016). [DOI] [PMC free article] [PubMed] [Google Scholar]
- 16.Zhu S & Gouaux E Structure and symmetry inform gating principles of ionotropic glutamate receptors. Neuropharmacology 112, 11–15 (2017). [DOI] [PMC free article] [PubMed] [Google Scholar]
- 17.Nakamoto C, et al. Expression mapping, quantification, and complex formation of GluD1 and GluD2 glutamate receptors in adult mouse brain. J Comp Neurol (2019). [DOI] [PubMed] [Google Scholar]
- 18.Platt RJ, et al. CRISPR-Cas9 knockin mice for genome editing and cancer modeling.Cell 159, 440–455(2014). [DOI] [PMC free article] [PubMed] [Google Scholar]
- 19.Seigneur E & Südhof TC Cerebellins are differentially expressed in selective subsets of neurons throughout the brain. J Comp Neurol 525, 3286–3311 (2017). [DOI] [PMC free article] [PubMed] [Google Scholar]
- 20.Torashima T, et al. Rescue of abnormal phenotypes in delta2 glutamate receptor-deficient mice by the extracellular N-terminal and intracellular C-terminal domains of the delta2 glutamate receptor. Eur J Neurosci 30, 355–365 (2009). [DOI] [PubMed] [Google Scholar]
- 21.Hrvatin S, et al. Single-cell analysis of experience-dependent transcriptomic states in the mouse visual cortex. Nat Neurosci 21, 120–129 (2018). [DOI] [PMC free article] [PubMed] [Google Scholar]
- 22.Hirai H Ca2+-dependent regulation of synaptic delta2 glutamate receptor density in cultured rat Purkinje neurons. Eur J Neurosci 14, 73–82 (2001). [DOI] [PubMed] [Google Scholar]
- 23.Patzke C, et al. Neuromodulator Signaling Bidirectionally Controls Vesicle Numbers in Human Synapses. Cell 179, 498–513 e422 (2019). [DOI] [PMC free article] [PubMed] [Google Scholar]
- 24.Sando R, Jiang X & Südhof TC Latrophilin GPCRs direct synapse specificity by coincident binding of FLRTs and teneurins. Science 363 (2019). [DOI] [PMC free article] [PubMed] [Google Scholar]
- 25.Khalaj AJ, et al. Deorphanizing FAM19A proteins as pan-neurexin ligands with an unusual biosynthetic binding mechanism. J Cell Biol 219 (2020). [DOI] [PMC free article] [PubMed] [Google Scholar]
- 26.Dai J, Chen P, Tian H & Sun J Spontaneous Vesicle Release Is Not Tightly Coupled to Voltage-Gated Calcium Channel-Mediated Ca2+ Influx and Is Triggered by a Ca2+ Sensor Other Than Synaptotagmin-2 at the Juvenile Mice Calyx of Held Synapses. J Neurosci 35, 9632–9637 (2015). [DOI] [PMC free article] [PubMed] [Google Scholar]
- 27.Jiang X, Sando R & Südhof TC Multiple signaling pathways are essential for synapse formation induced by synaptic adhesion molecules. Proc Natl Acad Sci U S A 118(2021). [DOI] [PMC free article] [PubMed] [Google Scholar]
- 28.Trotter JH, et al. Synaptic neurexin-1 assembles into dynamically regulated active zone nanoclusters. J Cell Biol 218, 2677–2698 (2019). [DOI] [PMC free article] [PubMed] [Google Scholar]
- 29.Zhang B, et al. Neuroligins Sculpt Cerebellar Purkinje-Cell Circuits by Differential Control of Distinct Classes of Synapses. Neuron 87, 781–796 (2015). [DOI] [PMC free article] [PubMed] [Google Scholar]
- 30.Zhang RS, Liakath-Ali K & Südhof TC Latrophilin-2 and latrophilin-3 are redundantly essential for parallel-fiber synapse function in cerebellum. Elife 9(2020). [DOI] [PMC free article] [PubMed] [Google Scholar]
- 31.Kakegawa W, et al. Differential regulation of synaptic plasticity and cerebellar motor learning by the C-terminal PDZ-binding motif of GluRdelta2. J Neurosci 28, 1460–1468 (2008). [DOI] [PMC free article] [PubMed] [Google Scholar]
- 32.Uemura T, Mori H & Mishina M Direct interaction of GluR delta 2 with Shank scaffold proteins in cerebellar Purkinje cells. Molecular and Cellular Neuroscience 26, 330–341 (2004). [DOI] [PubMed] [Google Scholar]
Associated Data
This section collects any data citations, data availability statements, or supplementary materials included in this article.
Supplementary Materials
Data Availability Statement
Exact P values are included with the source data. Source data are provided with this paper.


