Abstract
In this study, we aim to identify the clinical significance of basonuclin 1 (BNC1) expression in ovarian carcinoma (OV) and to explore its latent mechanisms. Via integrating in-house tissue microarrays, gene chips, and RNA-sequencing data, we explored the expression and clinical value of BNC1 in OV. Immunohistochemical staining was utilized to confirm the protein expression status of BNC1. A combined SMD of –2.339 (95% CI: –3.649 to –1.028, P < 0.001) identified that BNC1 was downregulated based on 1346 samples, and the sROC (AUC = 0.93) showed a favorable discriminatory ability of BNC1 in OV patients. We used univariate and multivariate Cox regulation to evaluate the prognostic role of BNC1 for OV patients, and a combined hazard ratio of 0.717 (95% CI: 0.445–0.989, P < 0.001) revealed that BNC1 was a protective factor for OV. Furthermore, the fraction of infiltrating naive B cells, memory B cells, and other immune cells showed statistical differences between the high- and low-BNC1 expression groups through cell-type identification by estimating relative subsets of RNA transcripts (CIBERSORT) algorithm. Enrichment analysis showed that BNC1 may have a relationship with immune-related items in OV. By predicting the potential regulatory transcription factors (TFs) of BNC1, friend leukemia virus integration 1 (FLI1) may be a potential upstream TF of BNC1. Corporately, a decreasing trend of BNC1 may serve as a tumor suppressor and prognostic biomarker in OV patients. Moreover, BNC1 may take part in immune-related pathways and influence the fraction of tumor-infiltrating immune cells.
Keywords: Basonuclin 1, ovarian carcinoma, tumorigenesis, prognosis
Impact statement
In our study, basonuclin 1 (BNC1) was identified as a crucial tumor suppressor in ovarian carcinoma (OV) based on a large sample size of 1346 in total (n of OV = 1086, n of non-OV = 260), which has been never reported before. Furthermore, it is suggested that BNC1 may serve as a prognostic biomarker for OV patients. Through evaluation the fraction of tumor-infiltrating immune cells, we found that high-BNC1 expression may be related to high fraction of B cells in OV. The enrichment analysis based on six cohorts revealed that BNC1 may participate in some immune-related pathways, such as “negative regulation of interleukin 1 production.” Moreover, by utilizing the ChIP-seq data, we identified FLI1 may be an upstream TF regulating BNC1. Summarily, BNC1 might be a prospective prognostic and therapeutic biomarker in OV for further exploiting.
Introduction
Ovarian carcinoma (OV) is a kind of malignant tumor in the ovary, most of which originate from the epithelium of ovary. As the fifth largest type of cancer causing female death, it is estimated that there will be 21,410 new cases of OV and may cause 13,779 deaths in the United States in 2021.1,2 For most patients with advanced OV, surgery is the most important treatment, and chemotherapy can be used as an adjuvant treatment.3–5 As there are often no obvious symptoms in the early stage of OV, many patients with epithelial OV are in the advanced stage of cancer when they are diagnosed, which also leads to the relatively low five-year survival rate of OV.6,7 If OV can be detected in the early stage, the survival rate and quality of life of OV patients can be improved, and the cost of treatment and related economic burden can be reduced. 8
Basonucillin 1 (BNC1) is a gene located on chromosome 15. The protein encoded by BNC1 can participate in the transcription process of germ cells and play a vital role in the growth of germ cells. 9 One study showed that BNC1 deficiency is one of the causes of primary ovarian insufficiency. 10 People who lack BNC1 are more likely to lose fertility with age. 11 Recently, García-Díez et al. found that BNC1 may be a driving factor for cutaneous squamous cell carcinoma. 12 One study found that increased BNC1 expression may enhance the metastatic potential of breast cancer cells and may participate in the process of advanced breast cancer metastasis to the brain. 13 Another study showed that BNC1 can play a role in the early diagnosis of pancreatic cancer and have a relationship with the prognosis for pancreatic cancer patients. 14 However, the role of BNC1 in the occurrence and development of OV has not yet been reported in the literature, and its molecular mechanisms need further elucidation.
In this study, the expression of BNC1 in OV and its clinical significance were investigated by integrating high-throughput databases and in-house immunohistochemical (IHC) staining. Through Gene Ontology (GO), Kyoto Encyclopedia of Genes and Genomes (KEGG) enrichment analysis, and prediction of transcription factors binding upstream of BNC1, the latent molecular mechanism of BNC1 in OV was explored. In addition, we also studied the relationship between BNC1 and immune cell infiltration. All these will help us clearly understand the molecular mechanisms of BNC1 in OV and explore a potential prognostic biomarker and therapy for OV.
Materials and methods
The expression level of BNC1 protein from tissue microarrays
All the tissue microarrays (OVC1021 and OVC2281) were provided by Pantomics, Inc. (Richmond, CA 94806). And other 24 cases of OV tissues and 28 cases of non-cancerous controls were collected from the First Affiliated Hospital of Guangxi Medical University, China. Permission for the study was officially acquired from the ethics committee of the First Affiliated Hospital of Guangxi Medical University (No. 2020-KY-E-095). One-hundred fifty (150) OV tissues and 46 non-cancerous ovarian tissues were collected to conduct IHC staining to identify the expression of BNC1 protein. Two pathologists chose 20 fields in the stained microarray at random and evaluated the number of positive cells in the field independently. The staining intensity and positive cells were scored with the following criteria: integers 0–3 points, respectively, for no, light, and strong staining; the score of positive cells in visual field was 0 point (0–5%), 1 point (6–25%), 2 point (26–50%), 3 point (51–75%), and 4 point (>75%), respectively. The total IHC score was calculated by multiplying the intensity score and the positive cells score.15,16
Data mining from public databases
In order to evaluate the expression of BNC1 mRNA in OV, we searched Gene Expression Omnibus, ArrayExpress, Oncomine, and Sequence Read Archive databases to collect microarrays. The search keywords were: (ovarian carcinoma) AND (mRNA OR gene). All the included studies contained three or more pairs of OV and non-cancerous ovarian tissues or cell lines. For the raw data that had not been processed by a robust multi-array average (RMA) algorithm, we used an affy package of R to integrate the raw data and complete the background correction. 17 We combined those microarrays of the same platforms and removed the batch effect with the sva package. 18 Furthermore, we also collected the level 3 RNA-sequencing (RNA-seq) data of OV and normal ovarian samples from The Cancer Genome Atlas (TCGA) and The Genotype-Tissue Expression (GTEx) databases. As of 1 February 2021, 16 datasets from nine platforms were collected (Table 1).
Table 1.
General characteristics of microarray and RNA-sequencing datasets on ovarian carcinoma.
| Study | Test method/Platform | Country | Year | OV group | Non-cancerous ovary controls |
|---|---|---|---|---|---|
| GSE26712 | GPL96 | USA | 2011 | 185 | 10 |
| GSE6008 | GPL96 | USA | 2007 | 99 | 4 |
| GSE105437 | GPL570 | South Korea | 2017 | 10 | 5 |
| GSE29450 | GPL570 | USA | 2011 | 10 | 10 |
| GSE18520 | GPL570 | USA | 2009 | 53 | 10 |
| GSE10971 | GPL570 | Canada | 2008 | 13 | 24 |
| GSE54388 | GPL570 | USA | 2017 | 16 | 6 |
| GSE14407 | GPL570 | USA | 2009 | 12 | 12 |
| GSE36668 | GPL570 | Norway | 2012 | 4 | 4 |
| GSE119054 | GPL19615 | China | 2019 | 6 | 3 |
| GSE66957 | GPL15048 | USA | 2015 | 57 | 12 |
| GSE146553 | GPL6244 | USA | 2020 | 46 | 9 |
| GSE124766 | GPL6480 | Germany | 2020 | 20 | 8 |
| GSE132289 | GPL20301 | UK | 2020 | 5 | 3 |
| GSE155310 | GPL18573 | UK | 2020 | 21 | 6 |
| TCGA_GTEx_ovary | RNA-seq | USA | 2021 | 379 | 88 |
OV: ovarian carcinoma.
The expression and clinicopathological significance of BNC1 in OV
We used Student’s t-test to compare the expression level of BNC1 between OV and non-cancerous ovarian tissues. GraphPad Prism 8(CA, USA) was used to draw the scatter plots and receiver operating characteristic (ROC) curves. We performed an integrated evaluation of data from in-house IHC, RNA-seq, and gene chips. Stata software version 15.1 (TX, USA) was used to conduct a subgroup analysis, to calculate the standard mean difference (SMD), and to draw the summary ROC (sROC).
The Mann-Whitney U-test was utilized to explore the difference of BNC1 expression in different groups of clinical parameters in OV patients. The patients with follow-up times of no less than 90 days were brought into survival analysis. The Kaplan-Meier (K-M) curves were completed by survival package. The log-rank test was used to identify the difference in survival rate between the high-BNC1 and low-BNC1 expression groups. Hazard ratio (HR) was used to assess the prognostic significance of BNC1 for patients with OV.
The relationship of BNC1 and tumor-infiltrating immune cells in OV
One study found that tumor-infiltrating immune cells (TIICs) are related to the progression and prognosis of OV. 19 A deconvolution algorithm and cell-type identification by estimating relative subsets of RNA transcripts (CIBERSORT) can estimate the cell composition based on gene profiles from tissue samples with support vector regression. 20 We performed the CIBERSORT algorithm with TCGA-OV samples in R software (v3.6.3). The violin plots of immune cells were used to show the proportion of TIICs between the high-BNC1 and low-BNC1 expression groups.
Gene set enrichment analysis
Gene set enrichment analysis (GSEA) software (v4.1.0) 21 was used to explore the underlying mechanisms of BNC1 in OV. We divided the TCGA-OV samples into high-BNC1 and low-BNC1 expression groups by median value of BNC1 expression. Then we used GSEA to perform GO terms and KEGG pathways enrichment analysis. The gene sets used in our study contained “c2.cp.kegg.v7.2.symbols,” “c5.go.bp.v7.2.symbols,” “c5.go.cc.v7.2.symbols,” and “c5.go.mf.v7.2.symbols.” The top 50% normalized enrichment score (NES) and adjusted p < 0.05 was chosen for our work. To obtain convincing results, we repeated the same procedure in six other datasets: GSE124766, GSE146533, GSE155310, GSE66957, GPL570-OV, and GPL96-OV (GSE132289 and GSE119054 were excluded for small sample size). We also selected the GO terms and KEGG pathways that appeared in at least three datasets for further research.
Upstream transcription factors of BNC1 in OV
In order to explore the molecular regulatory mechanisms of BNC1 in OV, the transcription factors (TFs) that regulate BNC1 expression were predicted from Cistrome Data Browser (Cistrome DB).22,23 Furthermore, we screened the positive-correlated genes of BNC1 in OV with the limma package of R. The criteria were Pearson’s r ≥ 0.4 and P < 0.05. We used the same standards and methods to screen positive correlated genes of BNC1 in nine datasets incorporated in our study: GSE124766, GSE132289, GSE146533, GSE155310, GSE119054, GSE66957, GPL570-OV, GPL96-OV, and TCGA_GTEx_ovary. Genes that appeared in at least three datasets were chosen as the candidate positive correlated genes of BNC1. Then, we overlapped the predicted TFs and positive correlated genes of BNC1. The pooled SMD and Pearson’s r were also utilized to filtrate the initial TFs of BNC1. The JASPAR database was used to obtain the motifs of initial TFs 24 ; the FIMO tool in the MEME suite was applied to find the binding sequences between the upstream transcription start site (TSS) and these motifs.25,26 The seqlogo of the motifs was drawn with the ggseqlogo package of R. Moreover, we used the data of chromatin immunoprecipitation-sequencing (ChIP-seq) from Cistrome DB to confirm whether there were ChIP-seq peaks of initial TFs before TSS of BNC1.
Statistical analysis
SPSS version 25.0 software (IBM Corp., Armonk, NY, USA) was used to conduct Student’s t-test and Mann-Whitney U-test. We utilized Stata software version 15.1 (TX, USA) to draw the forest plot with SMD and 95% confidence interval (CI). When the 95% CI of SMD did not contain 0, the pooled SMD was statistically significant. The chi-squared-based Q-test and the I2 statistics value were utilized to assess the heterogeneity. When I2 ≤ 50% and P ≥ 0.05, it meant that the heterogeneity was low and a fixed effects model should be used; otherwise, we chose the random effects model. The publication bias was examined via Egger’s test, and P ≥ 0.05 indicated no publication bias. The area under the curve (AUC) of ROC and sROC were utilized to evaluate the ability of BNC1 to distinguish OV from non-OV. Stata software version 15.1 (TX, USA) was used to perform univariate and multivariate Cox regression and to combine HR of BNC1. While 0 was out of the 95% CI of HR, it meant that the combined HR was statistically significant.
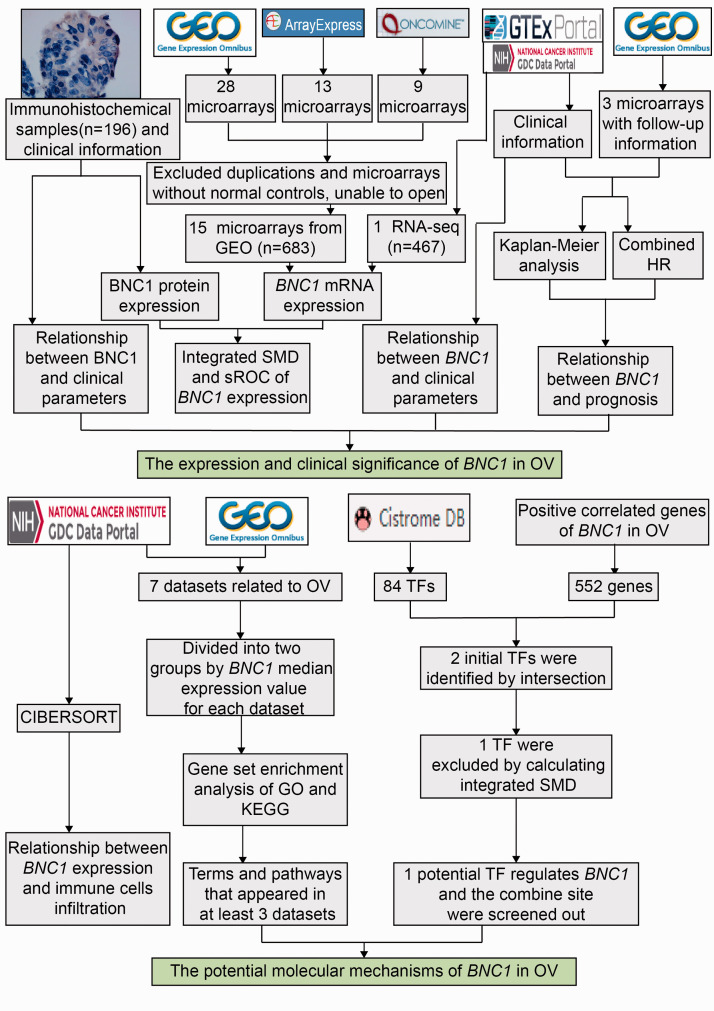
In this work, P < 0.05 indicated that the difference is statistically significant. The flow chart of this work is illustrated in Figure 1.
Figure 1.
The flow chart of the present study. (A color version of this figure is available in the online journal.)
OV: ovarian carcinoma; SMD: standard mean difference; sROC: summary receiver operating characteristic curve; HR: hazard ratio; CIBERSORT: cell-type identification by estimating relative subsets of RNA transcripts; TF: transcription factor; GSEA: Gene Set Enrichment Analysis; GO: Gene Ontology; KEGG: Kyoto Encyclopedia of Genes and Genomes.
Results
Data extraction
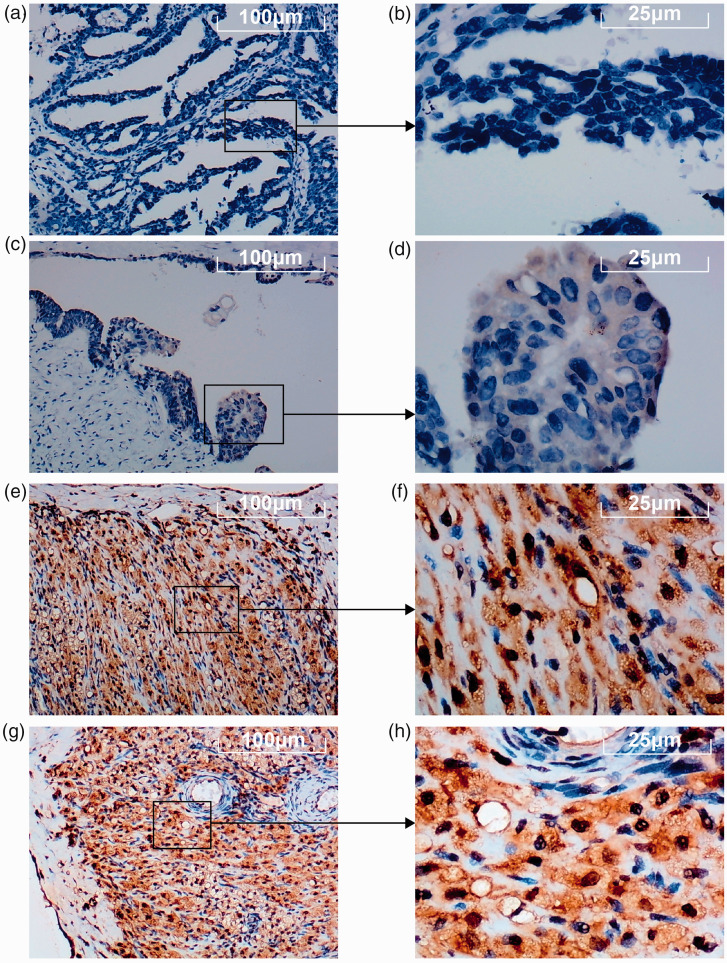
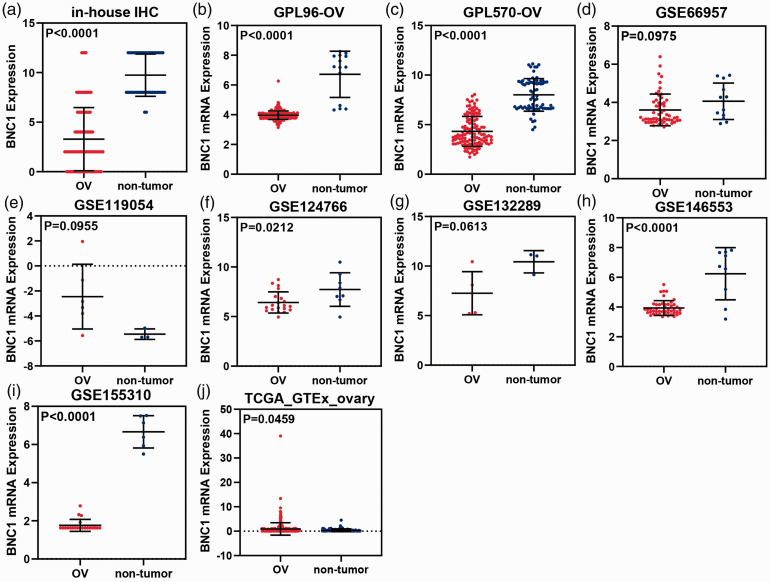
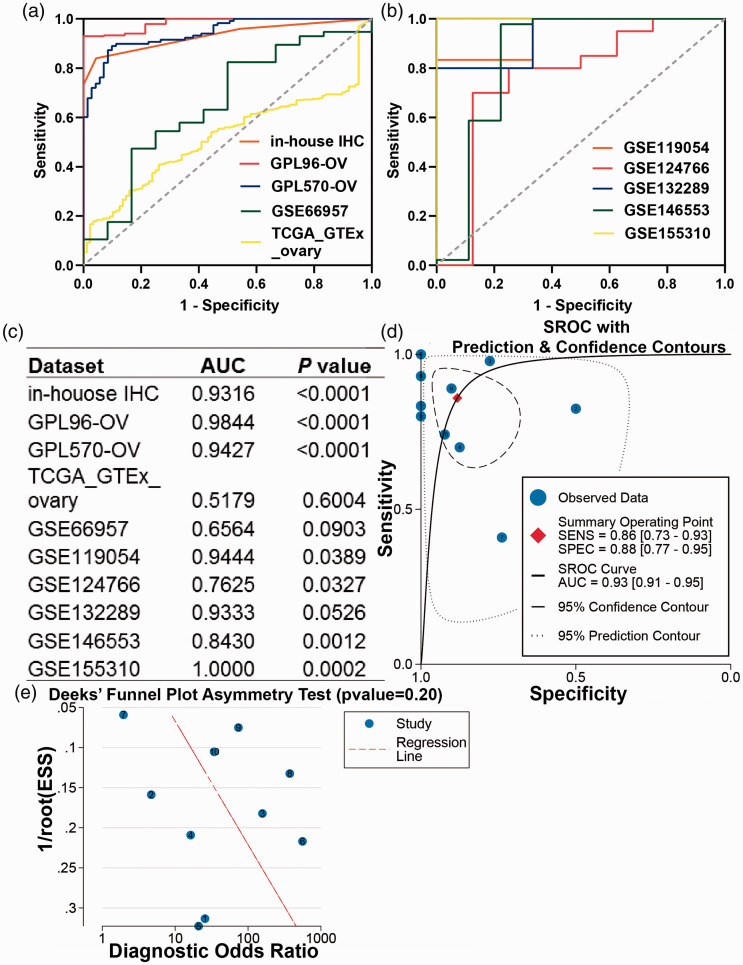
The results of IHC staining showed that BNC1 protein expression in OV tissues was lower than that in non-OV tissues (Figure 2), and the difference was statistically significant (P < 0.0001, Figure 3(a)). The visualized results of BNC1 mRNA expression levels were represented by scatter plots (Figure 3(b) to (j)). Out of the nine datasets, five showed that the expression of BNC1 mRNA in OV tissues was lower than that in non-OV tissues, and the difference was statistically significant (GPL96-OV, P < 0.0001; GPL570-OV, P < 0.0001; GSE124766; P = 0.0212; GSE146553, P < 0.0001; GSE155310, P < 0.0001). Two datasets showed that the expression level of BNC1 mRNA in OV tissues was lower than that in non-OV tissues, but the difference was not statistically significant (GSE66957, P = 0.0975; GSE132289, P = 0.0613). By contrast, there were two datasets showing that the expression of BNC1 mRNA in OV tissues was higher than that in corresponding normal tissues (GSE119054, P = 0.0955; TCGA_GTEx_ovary, P = 0.0459). The ROC curves of BNC1 and the table of AUC are shown in Figure 5(a) to (c).
Figure 2.
The expression of BNC1 protein in ovarian carcinoma (OV) tissues through immunohistochemical (IHC) staining. (a–d) The expression level of BNC1 protein in OV tissues. (e–h) The expression level of BNC1 protein in non-OV tissues. (A color version of this figure is available in the online journal.)
Figure 3.
Scatter plots of BNC1 expression. (a) The expression of BNC1 protein in ovarian carcinoma (OV) and the corresponding normal controls. B-J: The expression of BNC1 mRNA (b–j) in OV and the corresponding normal controls. (A color version of this figure is available in the online journal.)
Figure 5.
The discriminatory capacity of BNC1 in ovarian carcinoma. (a, b) The receiver operating characteristic curves (ROCs) of BNC1 in ovarian carcinoma. (c) Area under curve (AUC) of ROCs. (d) Summary ROC (sROC) curve of BNC1 in ovarian carcinoma. (e) Deek’s test for publication bias test. (A color version of this figure is available in the online journal.)
Integrated analysis
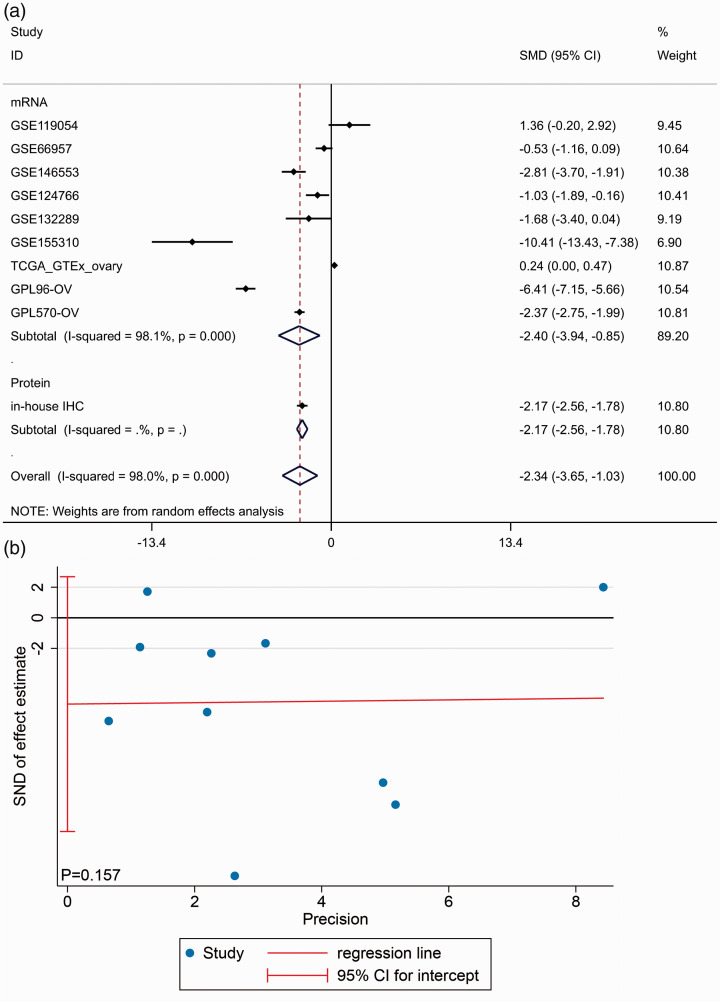
Due to the existing heterogeneity (I2 = 98.0%, P < 0.001), we used the random effects model to combine the SMD. The subgroup analysis showed that BNC1 was downregulated in OV tissues at both mRNA (SMD = –2.397, 95% CI: –3.940 to –0.853, P < 0.001) and protein level (SMD = –2.170, 95% CI: –2.564 to –1.775, P < 0.001). An overall SMD of –2.339 (95% CI: –3.649 to –1.028, P < 0.001, Figure 4(a)) confirmed the downregulation of BNC1 in OV tissues and Egger’s test showed that there was no publication bias (P = 0.157, Figure 4(b)). The AUC of the sROC curve was 0.93 (95% CI: 0.93–0.95, Figure 5(d)). Deek’s test also found no publication bias (P = 0.20, Figure 5(e)).
Figure 4.
Integrating study of BNC1 expression in ovarian carcinoma (OV). (a) Integrated standard mean difference (SMD) of BNC1 expression between OV group and non-OV group. (b) Egger’s test for publication bias test. (A color version of this figure is available in the online journal.)
Clinical significance of BNC1 in OV
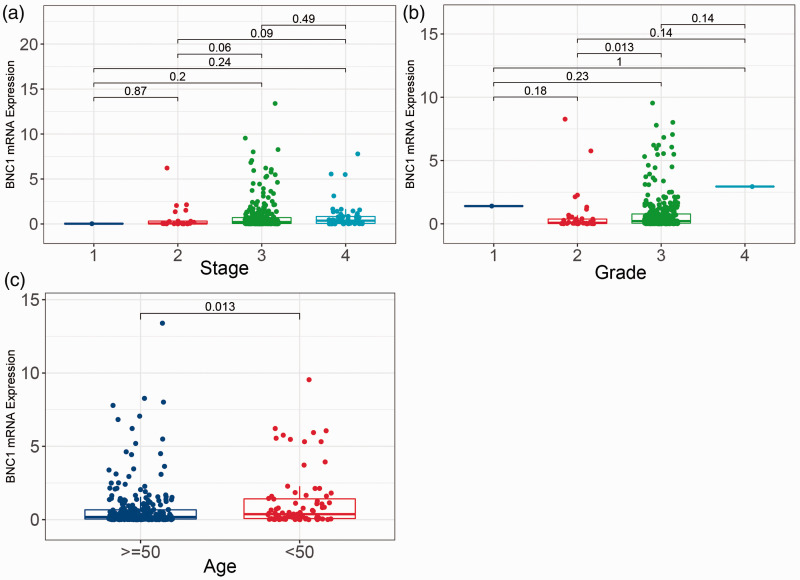
By analyzing the relationship between BNC1 mRNA expression and clinical parameters in the TCGA-OV dataset, we found that there was no significant difference in BNC1 expression among different stages of OV (Figure 6(a)). Compared with patients with a degree of differentiation, OV patients with grade 3 had lower BNC1 expression levels than patients with grade 2 (P = 0.013; Figure 6(b)). Compared with patients under 50 years old, patients over 50 years old had lower BNC1 expression levels, and the difference was statistically significant (P = 0.013, Figure 6(c)).
Figure 6.
Boxplots of BNC1 mRNA expression in different groups of clinical parameters of ovarian carcinoma patients. (a) BNC1 mRNA expression in different clinical stage of ovarian carcinoma patients. (b) BNC1 mRNA expression in different grade of ovarian carcinoma patients. (c) BNC1 mRNA expression in different ages of ovarian carcinoma patients (age <50 and age ≥50). (A color version of this figure is available in the online journal.)
However, through the analysis of the relationship between BNC1 protein expression and histological subtype, only clear cell OV and mucinous OV showed significant differences in BNC1 protein expression (P = 0.033, Supplementary Material 1(f)). There were no significant differences among other clinical parameters.
The prognostic value of BNC1 in OV
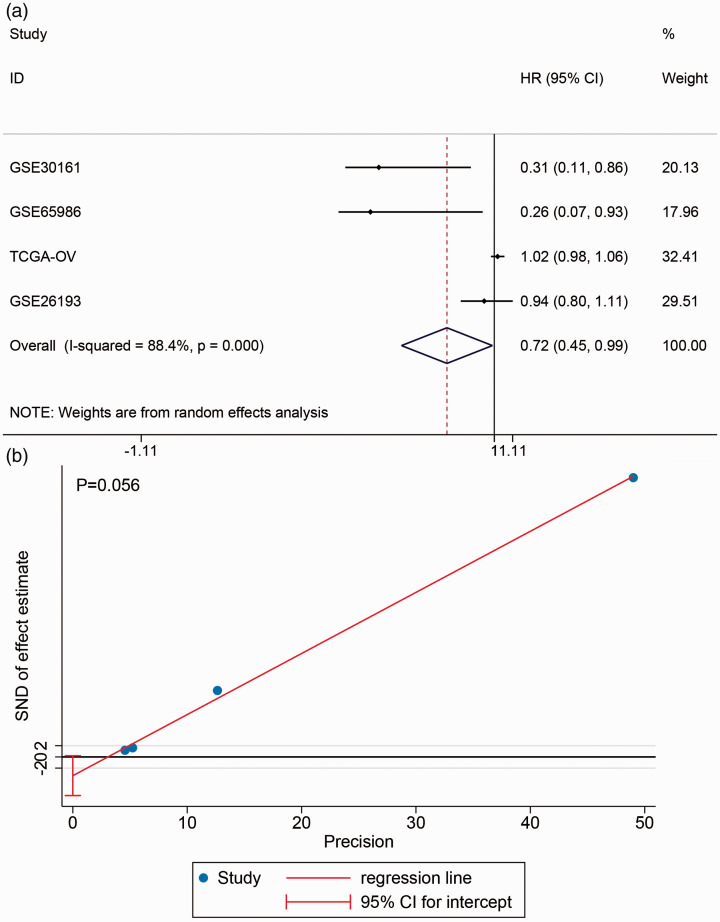
In the included datasets, four datasets containing PFS information were selected: GSE30161, GSE65986, TCGA-OV, and GSE26193 (Supplementary Material 2). Kaplan–Meier curves showed that the survival rate between high- and low-BNC1 expression groups was not different (Supplementary Material 3). The forest plot showed a combining HR of 0.717 (95% CI: 0.445–0.989, P < 0.001, Figure 7), which indicated that BNC1 may be a protective factor for PFS in OV patients.
Figure 7.
The prognostic value of BNC1 in ovarian carcinoma. (a) Forest plot of combined hazard ratio (HR) of progress-free survival in ovarian carcinoma patients. (b) Egger’s test for publication bias test. (A color version of this figure is available in the online journal.)
Relationship between BNC1 expression and immune cell infiltration
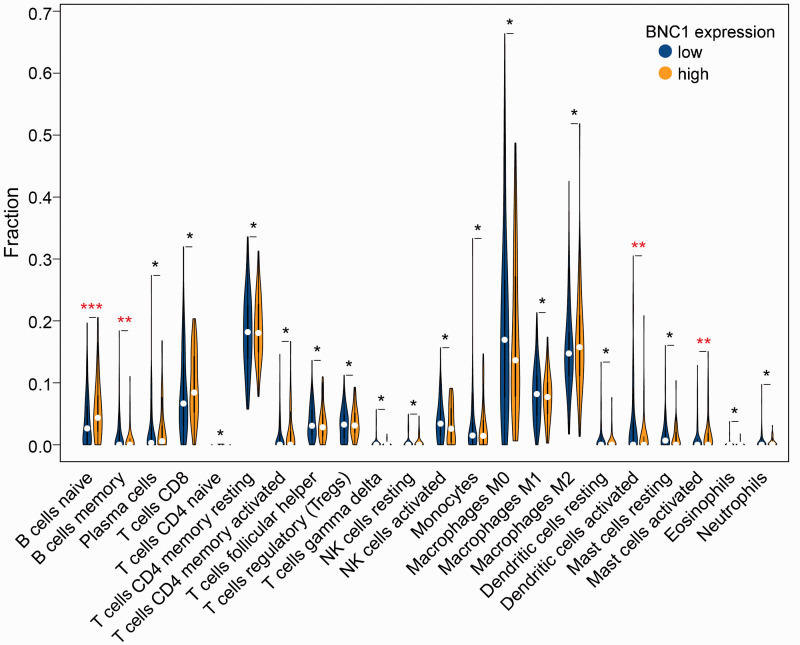
The results indicated that there were significant differences in the expression level of BNC1 among naive and memory B cells, activated mast cells, and activated dendritic cells (P < 0.05, Figure 8).
Figure 8.
The relationship between BNC1 expression and the fraction of immune cell infiltration in ovarian carcinoma (****P ≤ 0.0001; ***P ≤ 0.001; **P < 0.05; *P ≥ 0.05). (A color version of this figure is available in the online journal.)
GO enrichment analysis, KEGG pathway analysis
Through GO and KEGG enrichment analysis based on GSEA, we found that the gene set of the high BNC1 expression group was enriched in some GO functional terms related to immunity. The highly enriched GO functional terms mainly included “negative regulation of interleukin 1 production,” “interleukin 17 production,” and “interleukin 6 production.” The “cytokine cytokine receptor interaction” was the closely related KEGG pathway in the high BNC1 expression group. The GO functional terms of the low BNC1 expression group were highly enriched in “ribonucleoprotein complex subunit organization,” “U2 type spliceosomal complex,” and “protein methyltransferase activity.” The closely KEGG pathway of the low BNC1 expression group was “RNA degradation” (Table 2).
Table 2.
GO terms and KEGG pathways enrichment: based on the gene set enrichment results of samples with high (H) and low (L) BNC1 expression.
| Category | Name | Count |
|---|---|---|
| BP-H | GO_NEGATIVE_REGULATION_OF_INTERLEUKIN_1_PRODUCTION | 5 |
| GO_INTERLEUKIN_17_PRODUCTION | 5 | |
| GO_POSITIVE_REGULATION_OF_HEMOPOIESIS | 5 | |
| GO_INTERLEUKIN_6_PRODUCTION | 5 | |
| GO_PROTEIN_PROCESSING | 5 | |
| CC-H | GO_PODOSOME | 4 |
| GO_TERTIARY_GRANULE_MEMBRANE | 4 | |
| GO_ENDOCYTIC_VESICLE | 4 | |
| GO_MEMBRANE_REGION | 4 | |
| GO_RUFFLE | 3 | |
| MF-H | GO_CYTOKINE_ACTIVITY | 4 |
| GO_NON_MEMBRANE_SPANNING_PROTEIN_TYROSINE_KINASE_ACTIVITY | 4 | |
| GO_PROTEIN_TYROSINE_KINASE_BINDING | 4 | |
| GO_OXIDOREDUCTASE_ACTIVITY_ACTING_ON_THE_CH_NH2_GROUP_OF_DONORS_OXYGEN_AS_ACCEPTOR | 4 | |
| GO_AMIDE_BINDING | 4 | |
| KEGG-H | KEGG_CYTOKINE_CYTOKINE_RECEPTOR_INTERACTION | 4 |
| KEGG_JAK_STAT_SIGNALING_PATHWAY | 4 | |
| KEGG_TOLL_LIKE_RECEPTOR_SIGNALING_PATHWAY | 4 | |
| KEGG_NEUROACTIVE_LIGAND_RECEPTOR_INTERACTION | 3 | |
| KEGG_NOD_LIKE_RECEPTOR_SIGNALING_PATHWAY | 3 | |
| BP-L | GO_RIBONUCLEOPROTEIN_COMPLEX_SUBUNIT_ORGANIZATION | 4 |
| GO_SPLICEOSOMAL_SNRNP_ASSEMBLY | 4 | |
| GO_PEPTIDYL_LYSINE_METHYLATION | 4 | |
| GO_PROTEIN_CONTAINING_COMPLEX_LOCALIZATION | 4 | |
| GO_NUCLEOSIDE_TRIPHOSPHATE_METABOLIC_PROCESS | 3 | |
| CC-L | GO_U2_TYPE_SPLICEOSOMAL_COMPLEX | 5 |
| GO_PRECATALYTIC_SPLICEOSOME | 4 | |
| GO_SPLICEOSOMAL_COMPLEX | 4 | |
| GO_SM_LIKE_PROTEIN_FAMILY_COMPLEX | 4 | |
| GO_U1_SNRNP | 4 | |
| MF-L | GO_PROTEIN_METHYLTRANSFERASE_ACTIVITY | 4 |
| GO_N_METHYLTRANSFERASE_ACTIVITY | 4 | |
| GO_S_ADENOSYLMETHIONINE_DEPENDENT_METHYLTRANSFERASE_ACTIVITY | 4 | |
| GO_SNRNA_BINDING | 3 | |
| GO_NUCLEAR_IMPORT_SIGNAL_RECEPTOR_ACTIVITY | 3 | |
| KEGG-L | KEGG_RNA_DEGRADATION | 3 |
GO: gene ontology; BP: biological processes; CC: cell components; MF: molecular functions; KEGG: Kyoto Encyclopedia of Genes and Genomes.
Screening initial TFs regulating the expression of BNC1
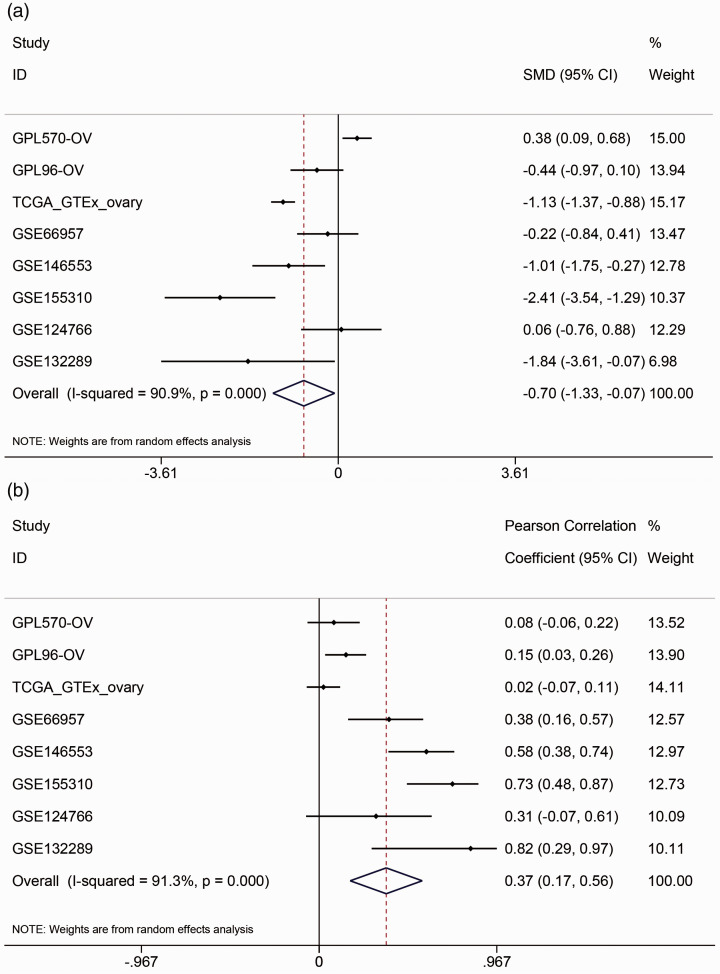
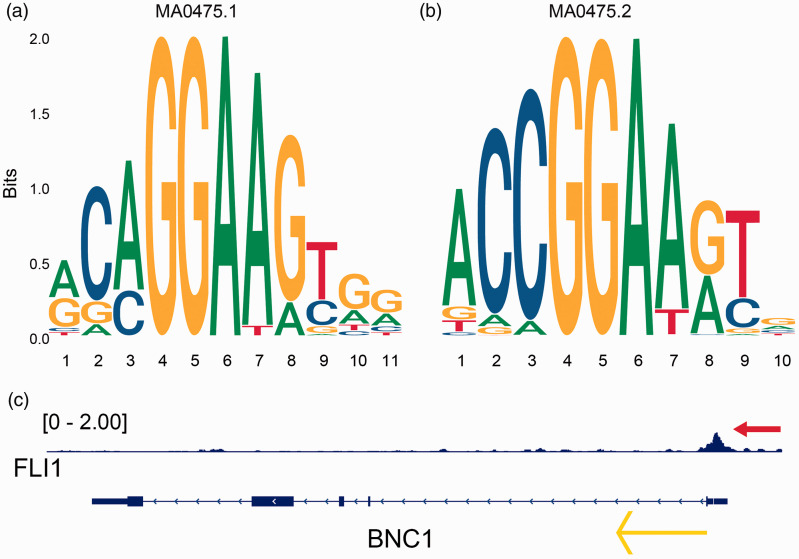
Two transcription factors, FLI1 and NR3C1, were obtained by overlapping the transcription factors predicted by Cistrome DB with BNC1-positive-related genes (Supplementary Material 4a). The combined SMD of FLI1 is –0.70 (95% CI: –1.33 to –0.07, P < 0.001, Figure 9(a)), and the comprehensive Pearson’s r is 0.37 (95% CI: 0.17–0.56, P < 0.001, Figure 9(b)). These results indicated that FLI1 expression is downregulated in OV and positively correlated with BNC1 expression. The combined SMD of NR3C1 was –0.38 (95% CI: –1.03–0.27, P > 0.05, Supplementary Material 4B), which indicated that there was no significant difference in the expression of NR3C1 between OV and non-OV tissues, so NR3C1 was not included in our study. The two motifs of FLI1 were shown in Figure 10(a) and (b). By combining the JASPAR and FIMO tools, we found two matching binding sequences of FLI1 motifs before the TSS of BNC1: AGAGGAAGCAG and ACCGGATAAC. Furthermore, a ChIP-seq peak of FLI1 was found and can be seen before the TSS of BNC1 (Figure 10(c)), which indicated that FLI1 may be an upstream TF that regulates the expression of BNC1.
Figure 9.
The expression of transcription factor FLI1 in ovarian carcinoma (OV). (a) Combined standard mean difference (SMD) of FLI1 expression between OV group and non-OV group. (b) Combined Pearson’s correlation coefficient between FLI1 and BNC1 in OV. (A color version of this figure is available in the online journal.)
Figure 10.
Underlying transcription factor FLI1 of BNC1 in ovarian carcinoma. (a, b) Seqlogos of the two motifs of FLI1 (MA0475.1 and MA0475.2). (c) ChIP-seq peak (see red arrow) of FLI1 in the upstream of the transcription start site of BNC1 and the yellow arrow indicates the transcription direction of BNC1. (A color version of this figure is available in the online journal.)
Discussion
In this study, we confirmed the downregulation of BNC1 at the protein level with tissue microarrays (n of OV = 150, n of non-OV = 46). Based on the large sample size (n of OV = 936, n of non-OV = 214) and multiple approaches (t-test and SMD integration), we verified this finding at the mRNA level. At the same time, we found that the expression of BNC1 mRNA in patients of high grade was lower than that of low grade. Through survival analysis and combined HR, we identified BNC1 serves as a protective role of PFS in patients with OV. Furthermore, GO and KEGG enrichment revealed that BNC1 may participate in some immune-related pathway and play as a tumor suppressor. Moreover, we found FLI1 may be a potential upstream TF of BNC1.
The aberrant expression of BNC1 in some malignant tumors was reported previously. For example, the expression of BNC1 was downregulated in hepatocellular carcinoma 27 and pancreatic cancer tissues. 28 On the contrary, the expression of BNC1 in cancerous tissues was higher than that in normal tissues in cutaneous squamous cell carcinoma 12 and in head and neck squamous cell carcinoma (HNSCC). 29 However, the difference in the expression of BNC1 in OV has not been reported before (based on the PubMed database, as of 31 July 2021). In this study, by performing a subgroup analysis to integrate SMD, we found that BNC1 expression in OV tissues was a decreasing trend at both mRNA and protein levels with 1346 samples.
The clinicopathological significance of the decreasingly expressed BNC1 in OV is tempting. In former studies, the relationship between the dysregulation of BNC1 and the clinical parameters of malignant tumors was less reported. For example, BNC1 was found to have the ability to distinguish lung adenocarcinoma from lung squamous cell carcinoma. 30 The methylation of BNC1, which was studied much in tumors, was related to the poor prognosis of patients with renal cell carcinoma.31,32 However, there were no studies that reported the prognostic value of BNC1 expression. In our study, we drew ROCs and sROC and an AUC of 0.93 (95% CI: 0.91–0.95), which indicated that BNC1 may have a favorable ability to distinguish OV from non-OV tissues. Based on the TCGA-OV cohort, we found that the expression of BNC1 mRNA was related to the age and tumor grade of OV patients. However, this trend was not found at the protein level, probably due to the small sample size. Furthermore, by calculating a pooled HR = 0.717 (95% CI: 0.445–0.989, P < 0.001) from four cohorts, we draw a conclusion that the expression of BNC1 was a protective factor of PFS in patients with OV, which was not reported ever before. In other words, the current study indicates that BNC1 may be a latent diagnostic, prognostic, and treatment target in OV.
The correlation of TIICs in the tumor microenvironment (TME) and the prognosis of OV patients has been proven.33,34 In previous studies,35–37 CD20+ B-cell infiltrating in TME was proven to be related to positive outcomes of patients with malignant tumors, such as OV and cervical cancer. Existing evidence shows that tumor-infiltrating B-cell (TIB) may play a tumor-suppressing role by directly killing tumor cells, promoting T-cell response, and secreting immunoglobulin. 38 TIB could increase the expression of HLA-II and costimulatory molecules (such as CD80 and CD86) to accelerate the presentation of tumor antigens, which stimulates the function of T-cells. 39 Former studies identified that TIB maintained the tertiary lymphoid structure that can induce cytotoxic T lymphocyte infiltrating into TME and contributing a potent tumor-suppressing response, which may result in good outcomes for patients.38,40,41 In our study, we observed that the fraction of infiltrating naive and memory B-cells was higher in the high-BNC1 expression group than in the low-BNC1 expression group. This increasing trend might be related to the protective role of BNC1 in OV.
Although the dysregulation and abnormal methylation of BNC1 in cancer are common,28,29,31,32,42,43 the latent molecular mechanisms still need further exploration. One former study identified that BNC1 can influence the expression of genes related to the TGF-β1 signaling pathway and some epithelial towards mesenchymal (EMT)-related TFs, and the expression of BNC1 can affect the outcome of TGF-β1 signaling and regulate epithelial plasticity. 44 As a member of the TGF-β family, TGF-β1 signaling has been proven to affect many biological processes, such as epithelial cell death, dedifferentiation, and EMT, which are cogently associated with tumorigenesis.45,46 Moreover, Cheon et al. found that genes modulated by TGF-β1 signaling were related to poor outcomes in serous OV. 47 However, in our study, we did not find the items related to TGF-β1 in OV via GSEA in multiple datasets. Instead, the genes of OV samples with low BNC1 expression were enriched in some items associated with epigenetic regulation. Multiple studies have identified that the activity of methyltransferase plays a crucial part in the tumorigenesis and progress of OV.48–50 Interestingly, the results of GSEA appearing in at least three datasets show that the genes of OV samples with high BNC1 expression were significantly enriched in the immune-related and cytokine-related GO terms and KEGG pathways. Interleukin 1 (IL-1) was considered a tumorigenesis-related cytokine in former research,51,52 which identified that IL-1 promoted tumorigenesis, metastasis, and invasion of tumor and recruitment of myeloid cells. Toll-like receptor (TLR) was reported to play a tumor-suppressing role through polarizing and activating M1 macrophages,53–55 which facilitate tumoricidal effects in TME.56,57 The high expression level of BNC1 may disturb the production of IL-1 and facilitate the TLR signaling pathway to exert its protective effects in OV, but this still needs further verification.
To further study the molecular mechanisms of BNC1 in OV, we explored the upstream regulatory TF of BNC1. Formerly, Boldrup et al. identified that p63 was a regulatory TF of BNC1 and validated that p63 bonded to the promoter of BNC1 in HNSCC. 29 However, there were still very few studies exploring the TFs that regulated the expression of BNC1. In our current study, we predicted that FLI1 may be an upstream regulatory TF of BNC1 specifically in OV for the first time, which boosts the understanding of the underlying molecular mechanisms of BNC1 to some extent.
Corporately, the results of our work indicate a low expression level of BNC1 at both mRNA and protein in OV, and this trend of BNC1 may play a promoting role in tumorigenesis. However, some limitations still exist. First, the collection of clinicopathological parameters for patients with OV was limited; thus, the clinical significance of BNC1 for OV has not been entirely studied. Second, although the molecular mechanisms of BNC1 in OV were explored in the pathways and upstream TFs, it still needs further study and validation via in vivo and in vitro experiments. In summary, BNC1 can be a novel treatment biomarker for OV patients, but further studies are necessary.
Conclusions
In summary, through combining data from in-house IHC, RNA-seq, and gene chips databases, we confirmed the downregulation of BNC1 in OV. This decreasing trend may relate to the clinical parameters, and the survival analysis revealed the protective role of BNC1 in OV. Furthermore, the enrichment analysis showed that BNC1 may be concerned with immune-related pathways in OV, but this still needs further exploration.
Supplemental Material
Supplemental material, sj-pdf-1-ebm-10.1177_15353702211052036 for Clinicopathological significance and underlying molecular mechanism of downregulation of basonuclin 1 expression in ovarian carcinoma by Zi-Qian Liang, Lu-Yang Zhong, Jie Li, Jin-Hai Shen, Xin-Yue Tu, Zheng-Hong Zhong, Jing-Jing Zeng, Jun-Hong Chen, Zhu-Xin Wei, Yi-Wu Dang, Su-Ning Huang and Gang Chen in Experimental Biology and Medicine
ACKNOWLEDGEMENTS
The authors would like to thank The Cancer Genome Atlas (TCGA), Gene Expression Omnibus (GEO), Cistrome Data Browser, JASPAR database and Guangxi Key Laboratory of Medical Pathology for technical support.
AUTHORS’ CONTRIBUTIONS: All authors participated in the interpretation of the studies and review of the article; ZQL, YWD, and GC designed the study; ZQL, LYZ, and JL performed statistical analysis, prepared the figures and tables, and wrote original draft; JHS, XYT, and ZHZ collected data; ZXW, JHC, SNH, and JJZ conducted the experiments.
DECLARATION OF CONFLICTING INTERESTS: The author(s) declared no potential conflicts of interest with respect to the research, authorship, and/or publication of this article.
FUNDING: The author(s) disclosed receipt of the following financial support for the research, authorship and/or publication of this article: This work was supported by: the Fund of Future Academic Star of Guangxi Medical University (grant number: WLXSZX21117), Guangxi Educational Science Planning Key Project (grant number: 2021B167), Guangxi Zhuang Autonomous Region Health Commission Self-financed Scientific Research Project (grant number: Z20180979), Guangxi Higher Education Undergraduate Teaching Reform Project (grant number: 2020JGA146), Guangxi Medical University Education and Teaching Reform Project (grant number: 2019XJGZ04), Guangxi Medical High-level Key Talents Training “139” Program (grant number: 2020), Medical Excellence Award Funded by the Creative Research Development Grant from the First Affiliated Hospital of Guangxi Medical University (grant number: 2016), Guangxi Medical University 2021 Undergraduate Innovation and Entrepreneurship Training Program (grant number: 202110598124).
ORCID iDs: Zi-Qian Liang https://orcid.org/0000-0001-9806-5424
Zhu-Xin Wei https://orcid.org/0000-0003-0630-1165
Gang Chen https://orcid.org/0000-0003-2402-2987
Supplement material: Supplemental material for this article is available online.
References
- 1.Siegel RL, Miller KD, Fuchs HE, Jemal A. Cancer statistics, 2021. CA A Cancer J Clin 2021; 71:7–33 [DOI] [PubMed] [Google Scholar]
- 2.Torre LA, Trabert B, DeSantis CE, Miller KD, Samimi G, Runowicz CD, Gaudet MM, Jemal A, Siegel RL. Ovarian cancer statistics, 2018. CA Cancer J Clin 2018; 68:284–96 [DOI] [PMC free article] [PubMed] [Google Scholar]
- 3.Kuroki L, Guntupalli SR. Treatment of epithelial ovarian cancer. Bmj 2020; 371:m3773. [DOI] [PubMed] [Google Scholar]
- 4.Li D, Hong X, Zhao F, Ci X, Zhang S. Targeting Nrf2 may reverse the drug resistance in ovarian cancer. Cancer Cell Int 2021; 21:116. [DOI] [PMC free article] [PubMed] [Google Scholar]
- 5.Florent R, Weiswald L-B, Lambert B, Brotin E, Abeilard E, Louis M-H, Babin G, Poulain L, NM. Bim, puma and noxa upregulation by naftopidil sensitizes ovarian cancer to the BH3-mimetic ABT-737 and the MEK inhibitor trametinib. Cell Death Dis 2020; 11:380. [DOI] [PMC free article] [PubMed] [Google Scholar]
- 6.Sun T, Bi F, Liu Z, Yang Q. TMEM119 facilitates ovarian cancer cell proliferation, invasion, and migration via the PDGFRB/PI3K/AKT signaling pathway. J Transl Med 2021; 19:111. [DOI] [PMC free article] [PubMed] [Google Scholar]
- 7.Ding B, Yuan F, Damle PK, Litovchick L, Drapkin R, Grossman SR. CtBP determines ovarian cancer cell fate through repression of death receptors. Cell Death Dis 2020; 11:286. [DOI] [PMC free article] [PubMed] [Google Scholar]
- 8.Delgado-Ortega L, Gonzalez-Dominguez A, Borras JM, Oliva-Moreno J, Gonzalez-Haba E, Menjon S, Perez P, Vicente D, Cordero L, Jimenez M, Simon S, Hidalgo-Vega A, Moya-Alarcon C. The economic burden of disease of epithelial ovarian cancer in Spain: the OvarCost study. Eur J Health Econ 2019; 20:135–47 [DOI] [PMC free article] [PubMed] [Google Scholar]
- 9.Ma J, Zeng F, Schultz RM, Tseng H. Basonuclin: a novel mammalian maternal-effect gene. Development 2006; 133:2053–62 [DOI] [PubMed] [Google Scholar]
- 10.Zhang D, Liu Y, Zhang Z, Lv P, Liu Y, Li J, Wu Y, Zhang R, Huang Y, Xu G, Qian Y, Qian Y, Chen S, Xu C, Shen J, Zhu L, Chen K, Zhu B, Ye X, Mao Y, Bo X, Zhou C, Wang T, Chen D, Yang W, Tan Y, Song Y, Zhou D, Sheng J, Gao H, Zhu Y, Li M, Wu L, He L, Huang H. Basonuclin 1 deficiency is a cause of primary ovarian insufficiency. Hum Mol Genet 2018; 27:3787–800 [DOI] [PubMed] [Google Scholar]
- 11.Li JY, Liu YF, Xu HY, Zhang JY, Lv PP, Liu ME, Ying YY, Qian YQ, Li K, Li C, Huang Y, Xu GF, Ding GL, Mao YC, Xu CM, Liu XM, Sheng JZ, Zhang D, Huang HF. Basonuclin 1 deficiency causes testicular premature aging: BNC1 cooperates with TAF7L to regulate spermatogenesis. J Mol Cell Biol 2020; 12:71–83 [DOI] [PMC free article] [PubMed] [Google Scholar]
- 12.García-Díez I, Hernández-Muñoz I, Hernández-Ruiz E, Nonell L, Puigdecanet E, Bódalo-Torruella M, Andrades E, Pujol RM, Toll A. Transcriptome and cytogenetic profiling analysis of matched in situ/invasive cutaneous squamous cell carcinomas from immunocompetent patients. Genes Chromosomes Cancer 2019; 58:164–74 [DOI] [PubMed] [Google Scholar]
- 13.Pangeni RP, Channathodiyil P, Huen DS, Eagles LW, Johal BK, Pasha D, Hadjistephanou N, Nevell O, Davies CL, Adewumi AI, Khanom H, Samra IS, Buzatto VC, Chandrasekaran P, Shinawi T, Dawson TP, Ashton KM, Davis C, Brodbelt AR, Jenkinson MD, Bieche I, Latif F, Darling JL, Warr TJ, Morris MR. The GALNT9, BNC1 and CCDC8 genes are frequently epigenetically dysregulated in breast tumours that metastasise to the brain. Clin Epigenetics 2015; 7:57. [DOI] [PMC free article] [PubMed] [Google Scholar]
- 14.Gheorghe G, Bungau S, Ilie M, Behl T, Vesa CM, Brisc C, Bacalbasa N, Turi V, Costache RS, Diaconu CC. Early diagnosis of pancreatic cancer: the key for survival. Diagnostics (Basel ) 2020; 10:869. [DOI] [PMC free article] [PubMed] [Google Scholar]
- 15.Liang L, Zhao K, Zhu J-H, Chen G, Qin X-G, Chen J-Q. Comprehensive evaluation of FKBP10 expression and its prognostic potential in gastric cancer. Oncol Rep 2019; 42:615–28 [DOI] [PMC free article] [PubMed] [Google Scholar]
- 16.Hou X, Yang L, Jiang X, Liu Z, Li X, Xie S, Li G, Liu J. Role of microRNA-141-3p in the progression and metastasis of hepatocellular carcinoma cell. Int J Biol Macromol 2019; 128:331–9 [DOI] [PubMed] [Google Scholar]
- 17.Gautier L, Cope L, Bolstad BM, Irizarry RA. Affy – analysis of affymetrix GeneChip data at the probe level. Bioinformatics 2004; 20:307–15 [DOI] [PubMed] [Google Scholar]
- 18.Leek JT, Johnson WE, Parker HS, Jaffe AE, Storey JD. The sva package for removing batch effects and other unwanted variation in high-throughput experiments. Bioinformatics 2012; 28:882–3 [DOI] [PMC free article] [PubMed] [Google Scholar]
- 19.Liu R, Hu R, Zeng Y, Zhang W, Zhou H-H. Tumour immune cell infiltration and survival after platinum-based chemotherapy in high-grade serous ovarian cancer subtypes: a gene expression-based computational study. EBioMedicine 2020; 51:102602. [DOI] [PMC free article] [PubMed] [Google Scholar]
- 20.Newman AM, Liu CL, Green MR, Gentles AJ, Feng W, Xu Y, Hoang CD, Diehn M, Alizadeh AA. Robust enumeration of cell subsets from tissue expression profiles. Nat Methods 2015; 12:453–7 [DOI] [PMC free article] [PubMed] [Google Scholar]
- 21.Subramanian A, Tamayo P, Mootha VK, Mukherjee S, Ebert BL, Gillette MA, Paulovich A, Pomeroy SL, Golub TR, Lander ES, Mesirov JP. Gene set enrichment analysis: a knowledge-based approach for interpreting genome-wide expression profiles. Proc Natl Acad Sci USA 2005; 102:15545–50 [DOI] [PMC free article] [PubMed] [Google Scholar]
- 22.Zheng R, Wan C, Mei S, Qin Q, Wu Q, Sun H, Chen C-H, Brown M, Zhang X, Meyer CA, Liu XS. Cistrome data browser: expanded datasets and new tools for gene regulatory analysis. Nucleic Acids Res 2019; 47:D729–35 [DOI] [PMC free article] [PubMed] [Google Scholar]
- 23.Mei S, Qin Q, Wu Q, Sun H, Zheng R, Zang C, Zhu M, Wu J, Shi X, Taing L, Liu T, Brown M, Meyer CA, Liu XS. Cistrome data browser: a data portal for ChIP-Seq and chromatin accessibility data in human and mouse. Nucleic Acids Res 2017; 45:D658–62 [DOI] [PMC free article] [PubMed] [Google Scholar]
- 24.Fornes O, Castro-Mondragon JA, Khan A, van der Lee R, Zhang X, Richmond PA, Modi BP, Correard S, Gheorghe M, Baranašić D, Santana-Garcia W, Tan G, Chèneby J, Ballester B, Parcy F, Sandelin A, Lenhard B, Wasserman WW, Mathelier A. JASPAR 2020: update of the open-access database of transcription factor binding profiles. Nucleic Acids Res 2020; 48:D87–92 [DOI] [PMC free article] [PubMed] [Google Scholar]
- 25.Grant CE, Bailey TL, Noble WS. FIMO: scanning for occurrences of a given motif. Bioinformatics 2011; 27:1017–8 [DOI] [PMC free article] [PubMed] [Google Scholar]
- 26.Bailey TL, Boden M, Buske FA, Frith M, Grant CE, Clementi L, Ren J, Li WW, Noble WS. MEME SUITE: tools for motif discovery and searching. Nucleic Acids Res 2009; 37:W202–W08 [DOI] [PMC free article] [PubMed] [Google Scholar]
- 27.Wu Y, Zhang X, Liu Y, Lu F, Chen X. Decreased expression of BNC1 and BNC2 is associated with genetic or epigenetic regulation in hepatocellular carcinoma. Ijms 2016; 17:153. [DOI] [PMC free article] [PubMed] [Google Scholar]
- 28.Yi JM, Guzzetta AA, Bailey VJ, Downing SR, Van Neste L, Chiappinelli KB, Keeley BP, Stark A, Herrera A, Wolfgang C, Pappou EP, Iacobuzio-Donahue CA, Goggins MG, Herman JG, Wang TH, Baylin SB, Ahuja N. Novel methylation biomarker panel for the early detection of pancreatic cancer. Clin Cancer Res 2013; 19:6544–55 [DOI] [PMC free article] [PubMed] [Google Scholar]
- 29.Boldrup L, Coates PJ, Laurell G, Nylander K. p63 transcriptionally regulates BNC1, a pol I and pol II transcription factor that regulates ribosomal biogenesis and epithelial differentiation. Eur J Cancer 2012; 48:1401–6 [DOI] [PubMed] [Google Scholar]
- 30.Yuan F, Lu L, Zou Q. Analysis of gene expression profiles of lung cancer subtypes with machine learning algorithms. Biochim Biophys Acta Mol Basis Dis 2020; 1866:165822. [DOI] [PubMed] [Google Scholar]
- 31.Morris MR, Ricketts C, Gentle D, Abdulrahman M, Clarke N, Brown M, Kishida T, Yao M, Latif F, Maher ER. Identification of candidate tumour suppressor genes frequently methylated in renal cell carcinoma. Oncogene 2010; 29:2104–17 [DOI] [PMC free article] [PubMed] [Google Scholar]
- 32.Ricketts CJ, Hill VK, Linehan WM. Tumor-specific hypermethylation of epigenetic biomarkers, including SFRP1, predicts for poorer survival in patients from the TCGA kidney renal clear cell carcinoma (KIRC) project. PLoS One 2014; 9:e85621. [DOI] [PMC free article] [PubMed] [Google Scholar]
- 33.Ghisoni E, Imbimbo M, Zimmermann S, Valabrega G. Ovarian cancer immunotherapy: Turning up the heat. Ijms 2019; 20:2927. [DOI] [PMC free article] [PubMed] [Google Scholar]
- 34.Pagès F, Galon J, Dieu-Nosjean MC, Tartour E, Sautès-Fridman C, Fridman WH. Immune infiltration in human tumors: a prognostic factor that should not be ignored. Oncogene 2010; 29:1093–102 [DOI] [PubMed] [Google Scholar]
- 35.Gupta P, Chen C, Chaluvally-Raghavan P, Pradeep S. B cells as an immune-regulatory signature in ovarian cancer. Cancers (Basel ) 2019; 11:894. [DOI] [PMC free article] [PubMed] [Google Scholar]
- 36.Gunderson AJ, Coussens LM. B cells and their mediators as targets for therapy in solid tumors. Exp Cell Res 2013; 319:1644–9 [DOI] [PMC free article] [PubMed] [Google Scholar]
- 37.Nielsen JS, Sahota RA, Milne K, Kost SE, Nesslinger NJ, Watson PH, Nelson BH. CD20+ tumor-infiltrating lymphocytes have an atypical CD27-memory phenotype and together with CD8+ T cells promote favorable prognosis in ovarian cancer. Clin Cancer Res 2012; 18:3281–92 [DOI] [PubMed] [Google Scholar]
- 38.Tokunaga R, Naseem M, Lo JH, Battaglin F, Soni S, Puccini A, Berger MD, Zhang W, Baba H, Lenz H-J. B cell and B cell-related pathways for novel cancer treatments. Cancer Treat Rev 2019; 73:10–9 [DOI] [PMC free article] [PubMed] [Google Scholar]
- 39.Wang S-S, Liu W, Ly D, Xu H, Qu L, Zhang L. Tumor-infiltrating B cells: their role and application in anti-tumor immunity in lung cancer. Cell Mol Immunol 2019; 16:18. [DOI] [PMC free article] [PubMed] [Google Scholar]
- 40.Zhu W, Germain C, Liu Z, Sebastian Y, Devi P, Knockaert S, Brohawn P, Lehmann K, Damotte D, Validire P, Yao Y, Valge-Archer V, Hammond SA, Dieu-Nosjean M-C, Higgs BW. A high density of tertiary lymphoid structure B cells in lung tumors is associated with increased CD4 T cell receptor repertoire clonality. Oncoimmunology 2015; 4:e1051922. [DOI] [PMC free article] [PubMed] [Google Scholar]
- 41.Germain C, Gnjatic S, Tamzalit F, Knockaert S, Remark R, Goc J, Lepelley A, Becht E, Katsahian S, Bizouard G, Validire P, Damotte D, Alifano M, Magdeleinat P, Cremer I, Teillaud J-L, Fridman W-H, Sautès-Fridman C, Dieu-Nosjean M-C. Presence of B cells in tertiary lymphoid structures is associated with a protective immunity in patients with lung cancer. Am J Respir Crit Care Med 2014; 189:832–44 [DOI] [PubMed] [Google Scholar]
- 42.Eissa MAL, Lerner L, Abdelfatah E, Shankar N, Canner JK, Hasan NM, Yaghoobi V, Huang B, Kerner Z, Takaesu F, Wolfgang C, Kwak R, Ruiz M, Tam M, Pisanic TR, 2nd, Iacobuzio-Donahue CA, Hruban RH, He J, Wang TH, Wood LD, Sharma A, Ahuja N. Promoter methylation of ADAMTS1 and BNC1 as potential biomarkers for early detection of pancreatic cancer in blood. Clin Epigenetics 2019; 11:59. [DOI] [PMC free article] [PubMed] [Google Scholar]
- 43.Shames DS, Girard L, Gao B, Sato M, Lewis CM, Shivapurkar N, Jiang A, Perou CM, Kim YH, Pollack JR, Fong KM, Lam C-L, Wong M, Shyr Y, Nanda R, Olopade OI, Gerald W, Euhus DM, Shay JW, Gazdar AF, Minna JD. A genome-wide screen for promoter methylation in lung cancer identifies novel methylation markers for multiple malignancies. PLoS Med 2006; 3:e486. [DOI] [PMC free article] [PubMed] [Google Scholar]
- 44.Feuerborn A, Mathow D, Srivastava PK, Gretz N, Gröne HJ. Basonuclin-1 modulates epithelial plasticity and TGF-β1-induced loss of epithelial cell integrity. Oncogene 2015; 34:1185–95 [DOI] [PubMed] [Google Scholar]
- 45.Lamouille S, Xu J, Derynck R. Molecular mechanisms of epithelial-mesenchymal transition. Nat Rev Mol Cell Biol 2014; 15:178–96 [DOI] [PMC free article] [PubMed] [Google Scholar]
- 46.Kalluri R, Weinberg RA. The basics of epithelial-mesenchymal transition. J Clin Invest 2009; 119:1420–8 [DOI] [PMC free article] [PubMed] [Google Scholar]
- 47.Cheon D-J, Tong Y, Sim M-S, Dering J, Berel D, Cui X, Lester J, Beach JA, Tighiouart M, Walts AE, Karlan BY, Orsulic S. A collagen-remodeling gene signature regulated by TGF-β signaling is associated with metastasis and poor survival in serous ovarian cancer. Clin Cancer Res 2014; 20:711–23 [DOI] [PMC free article] [PubMed] [Google Scholar]
- 48.Kanakkanthara A, Kurmi K, Ekstrom TL, Hou X, Purfeerst ER, Heinzen EP, Correia C, Huntoon CJ, O'Brien D, Wahner Hendrickson AE, Dowdy SC, Li H, Oberg AL, Hitosugi T, Kaufmann SH, Weroha SJ, Karnitz LM. BRCA1 deficiency upregulates NNMT, which reprograms metabolism and sensitizes ovarian cancer cells to mitochondrial metabolic targeting agents. Cancer Res 2019; 79:5920–9 [DOI] [PMC free article] [PubMed] [Google Scholar]
- 49.Eckert MA, Coscia F, Chryplewicz A, Chang JW, Hernandez KM, Pan S, Tienda SM, Nahotko DA, Li G, Blaženović I, Lastra RR, Curtis M, Yamada SD, Perets R, McGregor SM, Andrade J, Fiehn O, Moellering RE, Mann M, Lengyel E. Proteomics reveals NNMT as a master metabolic regulator of cancer-associated fibroblasts. Nature 2019; 569:723–8 [DOI] [PMC free article] [PubMed] [Google Scholar]
- 50.Karakashev S, Zhu H, Wu S, Yokoyama Y, Bitler BG, Park P-H, Lee J-H, Kossenkov AV, Gaonkar KS, Yan H, Drapkin R, Conejo-Garcia JR, Speicher DW, Ordog T, Zhang R. CARM1-expressing ovarian cancer depends on the histone methyltransferase EZH2 activity. Nat Commun 2018; 9:631. [DOI] [PMC free article] [PubMed] [Google Scholar]
- 51.Mantovani A, Barajon I, Garlanda C. IL-1 and IL-1 regulatory pathways in cancer progression and therapy. Immunol Rev 2018; 281:57–61 [DOI] [PMC free article] [PubMed] [Google Scholar]
- 52.Voronov E, Shouval DS, Krelin Y, Cagnano E, Benharroch D, Iwakura Y, Dinarello CA, Apte RN. IL-1 is required for tumor invasiveness and angiogenesis. Proc Natl Acad Sci USA 2003; 100:2645–50 [DOI] [PMC free article] [PubMed] [Google Scholar]
- 53.Zeng Q, Jewell CM. Directing toll-like receptor signaling in macrophages to enhance tumor immunotherapy. Curr Opin Biotechnol 2019; 60:138–45 [DOI] [PMC free article] [PubMed] [Google Scholar]
- 54.Rodell CB, Arlauckas SP, Cuccarese MF, Garris CS, Li R, Ahmed MS, Kohler RH, Pittet MJ, Weissleder R. TLR7/8-agonist-loaded nanoparticles promote the polarization of tumour-associated macrophages to enhance cancer immunotherapy. Nat Biomed Eng 2018; 2:578–88 [DOI] [PMC free article] [PubMed] [Google Scholar]
- 55.Urban-Wojciuk Z, Khan MM, Oyler BL, Fåhraeus R, Marek-Trzonkowska N, Nita-Lazar A, Hupp TR, Goodlett DR. The role of TLRs in anti-cancer immunity and tumor rejection. Front Immunol 2019; 10:2388. [DOI] [PMC free article] [PubMed] [Google Scholar]
- 56.Mantovani A, Marchesi F, Malesci A, Laghi L, Allavena P. Tumour-associated macrophages as treatment targets in oncology. Nat Rev Clin Oncol 2017; 14:399–416 [DOI] [PMC free article] [PubMed] [Google Scholar]
- 57.Dehne N, Mora J, Namgaladze D, Weigert A, Brüne B. Cancer cell and macrophage cross-talk in the tumor microenvironment. Curr Opin Pharmacol 2017; 35:12–9 [DOI] [PubMed] [Google Scholar]
Associated Data
This section collects any data citations, data availability statements, or supplementary materials included in this article.
Supplementary Materials
Supplemental material, sj-pdf-1-ebm-10.1177_15353702211052036 for Clinicopathological significance and underlying molecular mechanism of downregulation of basonuclin 1 expression in ovarian carcinoma by Zi-Qian Liang, Lu-Yang Zhong, Jie Li, Jin-Hai Shen, Xin-Yue Tu, Zheng-Hong Zhong, Jing-Jing Zeng, Jun-Hong Chen, Zhu-Xin Wei, Yi-Wu Dang, Su-Ning Huang and Gang Chen in Experimental Biology and Medicine


