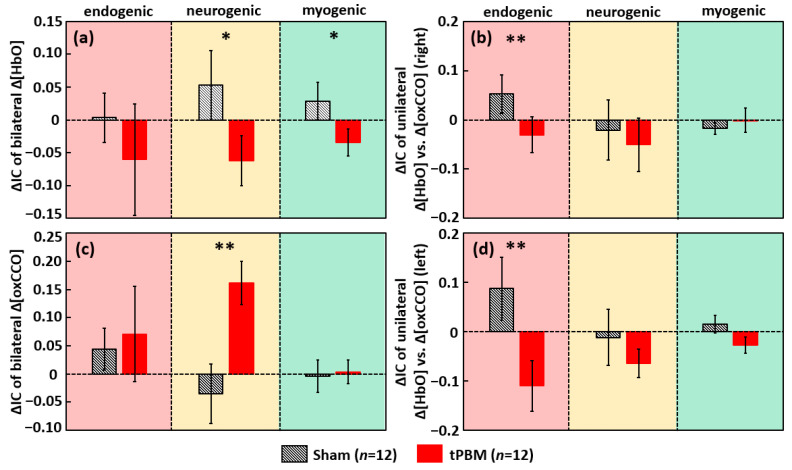
Figure 4.
Baseline-subtracted changes of IC, ΔIC, for (a) bilateral Δ[HbO] coherence, (b) unilateral Δ[HbO] vs. Δ[oxCCO] coherence (right), (c) bilateral Δ[oxCCO] coherence, and (d) unilateral Δ[HbO] vs. Δ[oxCCO] coherence (left). tPBM- and sham-induced ΔIC values are marked by red and black bars, respectively (n = 12). Error bars indicate the standard error of the mean in each case. The red, yellow, and green-shaded boxes denote the endogenic, neurogenic, and myogenic bands, respectively. “*” indicates p < 0.05, and “**” indicates p < 0.01 based on paired t-tests between tPBM and sham experiments.

