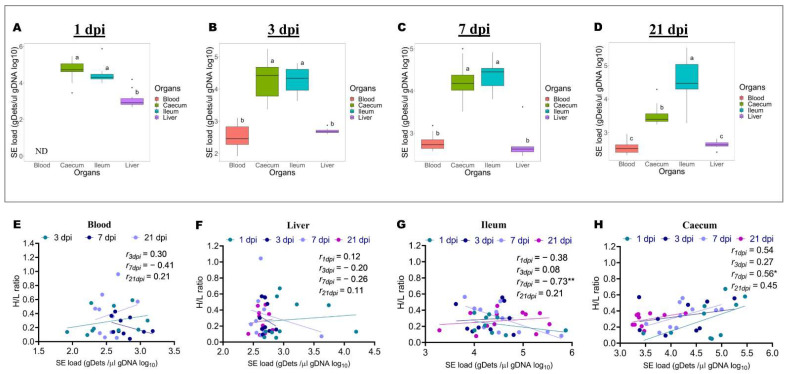
Figure 2.
The bacterial load in the blood, liver, ileum, and caecum differs significantly during the infective cycle, and the bacterial loads in the ileum and caecum at 7 dpi are significantly and inversely correlated to the H/L ratio. (A–D) represent the bacterial among the blood, liver, ileum, and caecum at 1, 3, 7, and 21 dpi, respectively, except the bacterial load in the blood at 1 dpi, which was not determined (n = 10). (E–H) represent the correlation between the H/L ratio and the bacterial load in the blood, liver, ileum, and caecum, respectively. Comparisons of bacterial loads between different organs were analyzed by one-way ANOVA with Tukey’s post-test, and the correlations between the H/L ratio and the bacterial load were analyzed by Pearson correlation with Student’s t-test (one tail). a,b Means at each time point post-infection with no common superscript indicate significant difference (p < 0.05). * p < 0.05 and ** p < 0.01.

