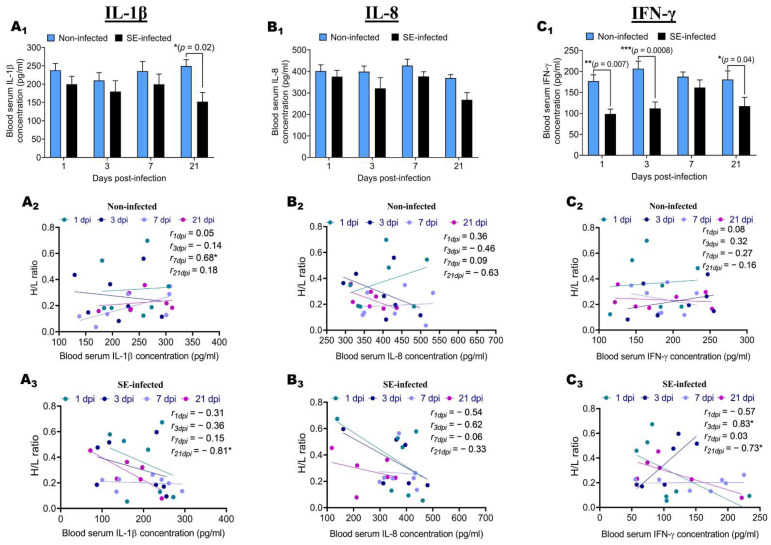
Figure 4.
Determination of blood serum IL-1β, IL-8, and IFN-γ concentration during the infective cycle and association with the H/L ratio. After infection, the quantification of IL-1β (A1), IL-8 (B1), and IFN-γ (C1) in the blood serum was performed using enzyme-linked immunosorbent assays (ELISAs) (six to seven birds were used per group at each time point). (A2,A3) Correlation between H/L ratio and IL-1 β blood serum concentration in non-infected and SE-infected, respectively. (B2,B3) Correlation between H/L ratio and IL-8 blood serum concentration in non-infected and SE-infected, respectively. (C2,C3) Correlation between H/L ratio and IFN-γ blood serum concentration in non-infected and SE-infected, respectively. One-way ANOVA with Tukey’s post-test (α = 0.05) was used to compare different time points post-infection, and the results showed no significant differences for the three cytokines. Comparisons between the two groups during the infective cycle were performed by two-way ANOVA with Sidak’s post-test α = 0.05; correlations between the H/L ratio and the blood serum immune indicator were analyzed by Pearson correlation with Student’s t-test (one tail). * p < 0.05, ** p < 0.01 and *** p < 0.001.

