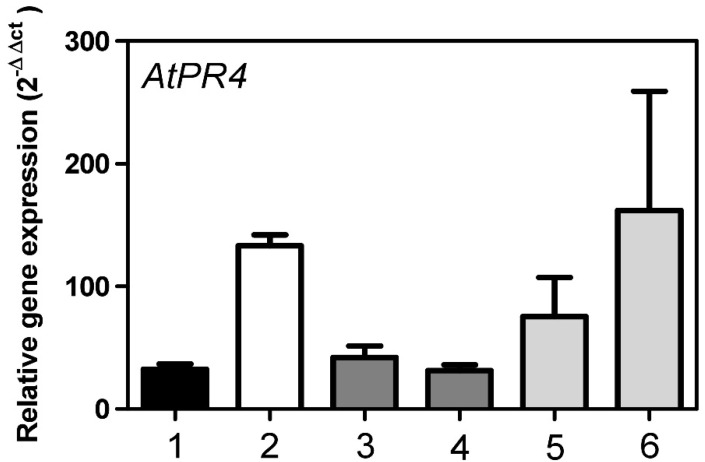
Figure 8.
Expression of AtPR4 in A. thaliana leaves under MVK treatment in relation to AtPR4 expression in untreated Ath Col-0 wt. (1) Ath Col-0 wt, (2) AtStR1-, (3) 35S:AtStR1/AtStR1-1, (4) 35S:AtStR1/AtStR1-2, (5) 35S:AtStR2/AtStR1-1, (6) 35S:AtStR2/AtStR1-2. Mean ± STD (n = 3), normalized on Act2 and EF1α (* = p < 0.05).

