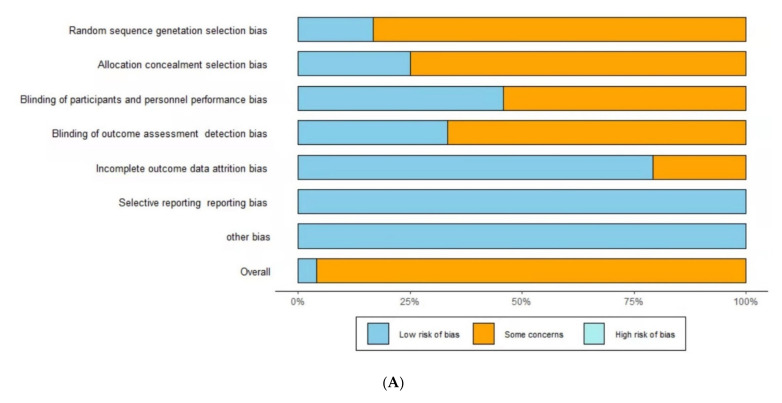
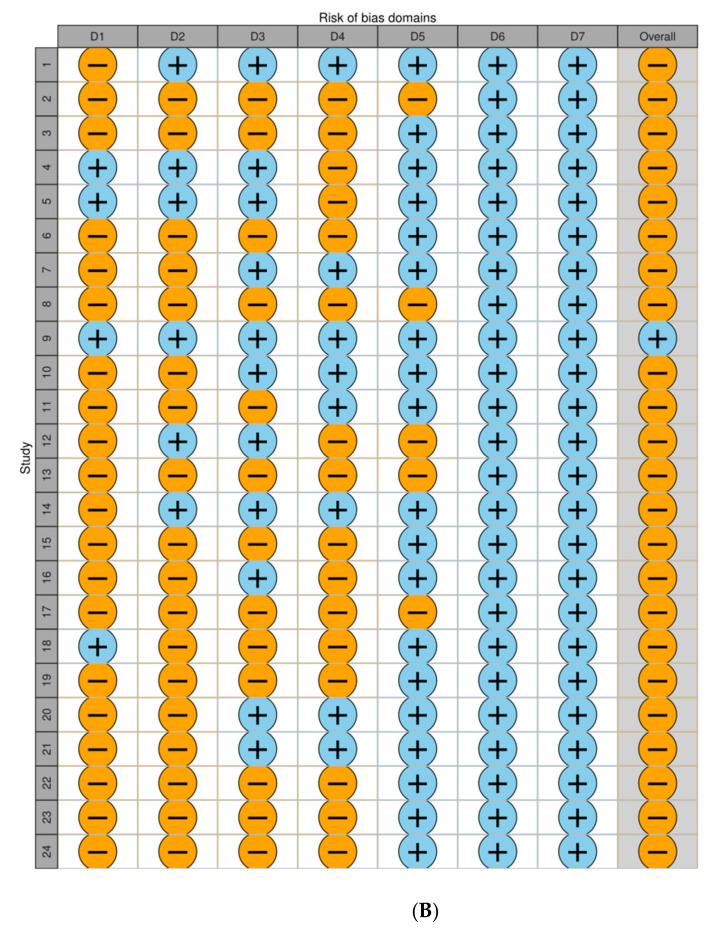
Figure 2.
Risks of bias for the included studies. (A): Risk of bias graph; (B): risk of bias summary. D1 = Random sequence generation (selection bias), D2 = Allocation concealment (selection bias), D3 = Blinding of participants and personnel (performance bias), D4 = Blinding of outcome assessment (detection bias), D5 = Incomplete outcome data (attrition bias), D6 = Selective reporting (reporting bias), D7 = other bias. Sky blue (+) = low risk of bias, Orange (−) = unclear risk of bias, Turquoise (×) = high risk of bias.


