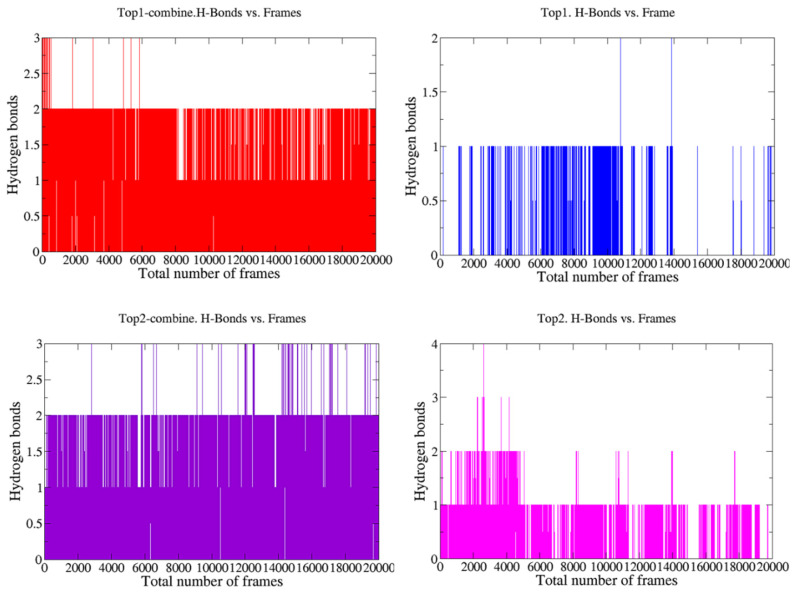
Figure 4.
Hydrogen bond analysis of simulated dock complexes at different time intervals. Top1 and Top2 represent the hydrogen bond assessment of the top 1 and top 2 compounds bonded with the Ggp of HEV, respectively, while Top1-combine and Top2-combine show the hydrogen bond examination of the top 1 and top 2 compounds bonded with the Ggp of HEV attached to Ephrin-B2 receptors.

