Figure 3.
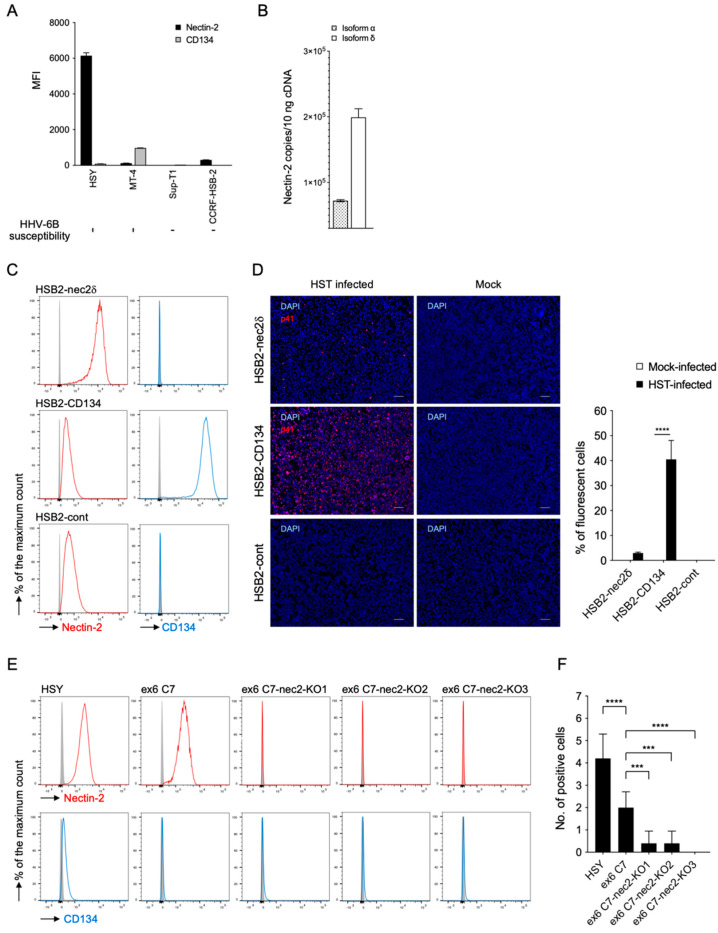
Nectin-2 is expressed on HSY cells, and HHV-6B-infected cells express different levels of nectin-2. (A) Median fluorescence intensity (MFI) of nectin-2 expressed on the cell surface. HSY cells had a greater intensity of nectin-2 staining when compared with the T-cell lines, MT-4, Sup-T1, and CCRF-HSB-2 cells. Error bars represent standard deviations (n = 3 per cell). (B) Mean copy numbers of nectin-2 isoforms-α and -δ mRNA. Isoform δ was dominantly detected in HSY cells. Error bars represent standard deviations (n = 3 per cell). (C) Nectin-2 and CD134 expression levels in MMLV-transduced cells and parent CCRF-HSB-2 cells. (D) Cells were infected with HHV-6B HST and treated with cold acetone at 96 h post-infection (left panel). HHV-6 p41 protein (red) was detected in HSB2-nec2δ cells and HSB2-CD134 cells with an immunofluorescence assay. Nuclei of cells were stained with DAPI (blue). Scale bars represent 50 μm. Virus-infected cells (red) were counted (right panel). Error bars represent standard deviations (n = 3 per cell). Asterisks indicate statistical significance (**** p < 0.001, Bonferroni’s multiple comparison test). (E) Nectin-2 and CD134 expression levels in HSY cells, ex6 C7 cells, and three lines of NECTIN2 gene-specific mutated ex6 C7 cells (ex6 C7-nec2-KO cells) were detected using FACS. (F) HSY cells, ex6 C7 cells, and ex6 C7-nec2-KO cells were inoculated with the HHV-6B HST strain. HHV-6 p41 protein (red) was detected at 48 h post-infection by IFA. Positive cells were determined by counting the number of red signals in a microscopic field. Error bars represent standard deviations (n = 5 per cell). Asterisks indicate statistical significance when compared with the parent ex6 C7 cells (*** p < 0.001, **** p < 0.0001, Dunnett’s multiple comparison test).

