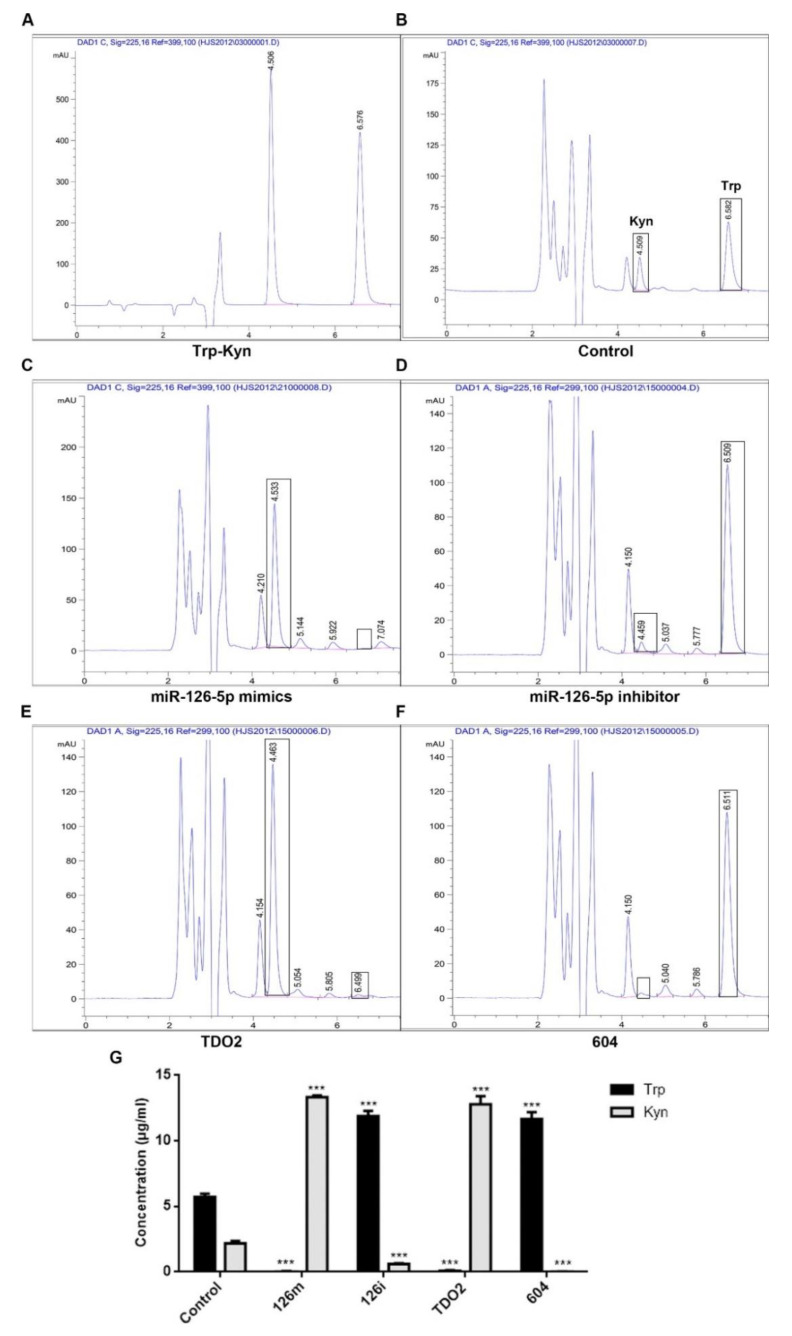
Figure 4.
The contents of tryptophan and kynurenine in each group after transfection were determined by HPLC. The X-axis is time (min), and the Y-axis is mAU. The peak at 4.5 min is kynurenine, and the peak at 6.5 min is tryptophan. (A) The peak diagram of tryptophan and kynurenine standard. (B) The peak diagram of DMEM medium containing 10% FBS. (C–F) The peak diagram of cell transfection with miR-126-5p mimics, miR-126-5p inhibitor, TDO2 and siRNA-TDO2(604). (G) Statistical results of the peak area of each elution peak. Data are shown as mean ± SD, n = 3; *** p < 0.001 vs. control.

