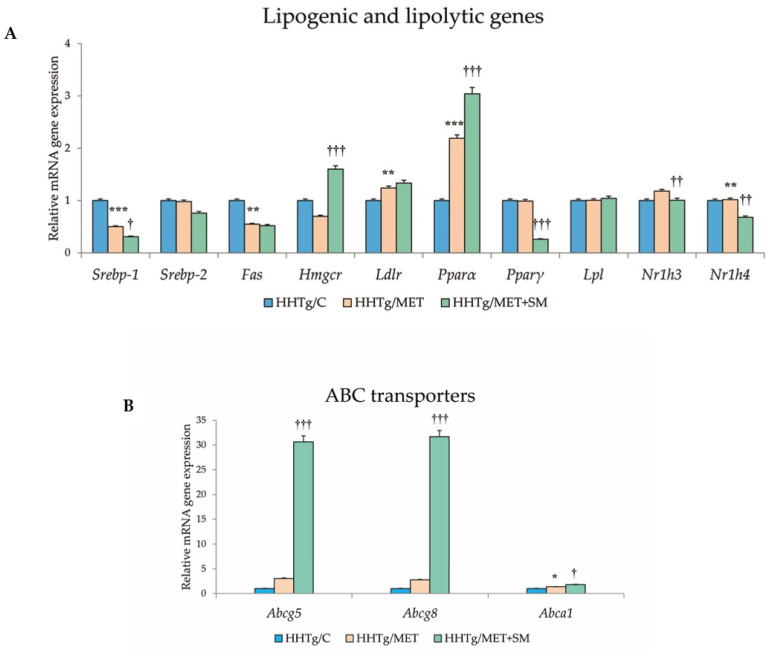
Figure 4.
Effect of MET+SM combination therapy on the relative mRNA expression of (A) hepatic cytochrome P450 family protein genes and (B) ABC transporters. Values are expressed as means ± SEM; n = 6 for HHTg/C, n = 7 for HHTg/MET, n = 8 for HHTg/MET+SM; * p < 0.05, ** p < 0.01, *** p < 0.001 probability reflecting the effect of MET monotherapy vs. the control group without treatment; † p < 0.05, †† p < 0.01, ††† p < 0.001 probability reflecting the effect of MET therapy vs. MET+SM combination therapy.

