

Abstract
High-cost situations need to be avoided. However, occasionally, cost may only be learned by experience. Here, we tested whether an artificially induced unstable and invisible high-cost region, a “limit-push” force field, might reshape people’s motion distributions. Healthy and neurologically impaired (chronic stroke) populations attempted 600 interceptions of a projectile while holding a robot handle that could render forces to the hand. The “limit-push,” in the middle of the study, pushed the hand outward unless the hand stayed within a box-shaped region. Both healthy and some stroke survivors adapted through selection of safer actions, avoiding the high-cost regions (outside the box); they stayed more inside and even kept a greater distance from the box’s boundaries. This was supported by other measures that showed subjects distributed their hand movements within the box more uniformly. These effects lasted a very short time after returning to the no-force condition. Although most robotic teaching approaches focus on shifting the mean, this limit-push treatment demonstrates how both mean and variance might be reshaped in motor training and neurorehabilitation.
Index Terms–: Movement variability, obstacle avoidance, stroke, sensory motor learning, motor planning
I. Introduction
We negotiate dynamically changing environments every day, which tasks our nervous system to adjust in a reactive manner. Movement variability we exhibit in daily situations can endanger us if the nervous system is not able to keep it within certain limits dependent upon the environment. Such danger exists in the form of falls [1], trips [2] and accidents in the workplace [3]. These incidents are examples of high-cost events, events that the nervous system would seek to avoid encountering. Excessive movement variability can lead to high-cost events and hence pose a significant problem; even more so in stroke survivors who have increased variability in upper limb motions while executing actions such as drinking a hot cup of coffee [4], [5]. The nervous system naturally tries to minimize such encounters by adapting from experience and constructing limits to movement variability [6].
Research suggests that movement decisions consider previous high-cost errors. Safeguards prevent the system from repeating mistakes, and come in the form of velocity safety margins about the ankle and foot [7], energy during transport of coffee [8] and acceleration [9] in lower and upper extremities. The cortex may govern such safeguards. For instance, a “safety margin”, or defensive peripersonal space, is evidenced [10], [11] through electrical stimulation of the Pre-motor ventral and caudal (PMVc) regions located in M1. Furthermore, excessive motor variability due to noise and other factors can lead to a high-cost event. It is imperative that the nervous system considers noise, inaccuracies, and other factors that contribute variation from ideal trajectories and build in safety factors that will avoid high-cost events.
Many sources of noise contribute to the resulting distribution of movements and their associated variability, such as imperfections in the motor plan and signal-dependent noise during motor execution. Such trial-to-trial movement variability is prevalent in all aspects of movement and well-studied in motor control [12]. Specifically, variability in spiking activity in the premotor cortex seems to correlate with variability in movement planning [13]. The outcome of the variability in movement planning is evidenced by selection of bundles of trajectories chosen to execute a movement as demonstrated in fast reaches around obstacles [14]. This suggests that there is very little direct control of variability. In different contexts, movement variability can be regarded as beneficial or detrimental - regardless we want to be able to alter movement distributions and the associated variability given varying contexts.
Previous attempts at changing movement variability focused on improving performance by reducing the variability related to error, and they were met with only moderate success. For instance, employment of different forms of haptic feedback such as noise disturbances and pulse perturbations have shown promise in reducing subject error [15], [16]. In addition, error-augmenting haptic forces have proven to be helpful for novices in skill learning [16], but not always [17].
We believe that reshaping movement distributions along with the associated variability may be accomplished by employing principles of obstacle avoidance. Obstacles have been shown to dramatically influence the motor plan to reshape movement trajectories [14], [18], [19], and people seek to move around these obstacles with some clearance (or safety margin), dependent upon the cost of encounter. This creates limits of safety in movement around them [14], [20], [21]. Robotic obstacle avoidance is accomplished when the environment is represented as a potential energy field in which the robot moves, and neighborhood of obstacles are represented as regions of higher potential, or “repulsors” that deflect motion, while the target destination acts as a low energy “attractor” in the workspace [22]. Actions are planned as a particle’s motion on the energy landscape, merely seeking lower-energy states. We hypothesize that humans will behave and form patterns of learning an analogous manner when presented with such an environment.
In this paper, we establish a novel method to reshape movement distributions. We impose an indirect constraint on subjects by pushing the subject’s hand away from the workspace whenever they are outside of a pre-defined region in a 3d interception task using robots and virtual reality. We considered many possible choices for force conditions to recondition movement distributions. Some possible choices included noise during movement [23] or unstable equilibrium points where forces push subjects away from a fixed location. However, these methods tend to simply alter the effective stiffness of the limbs through co-contraction of muscles, and do very little to trigger an adaptive response, because subjects are continually disturbed by distracting forces. Alternatives are forces that push subjects either back inside or further outside a region (“tolerance” or “limit-push” in Fig. 1), allowing for the possibility of avoiding these disturbances completely by learning to stay within a region. While tolerance approaches can directly reduce variation, they can be used as assistive elements in the task, and thus may introduce a reliance on the boundaries of the region. Instead, training with limit-push forces might influence an adaptation that might be retained after its removal by removing any reliance on the boundaries of the region. In this study, we employed such a limit-push force field that acts only when the subject’s hand was outside the boundaries of a box-shaped region. Using such a method was a variation on the ideas in previous research that showed changes in movement patterns in response to Error Augmentation [24].
Fig. 1.
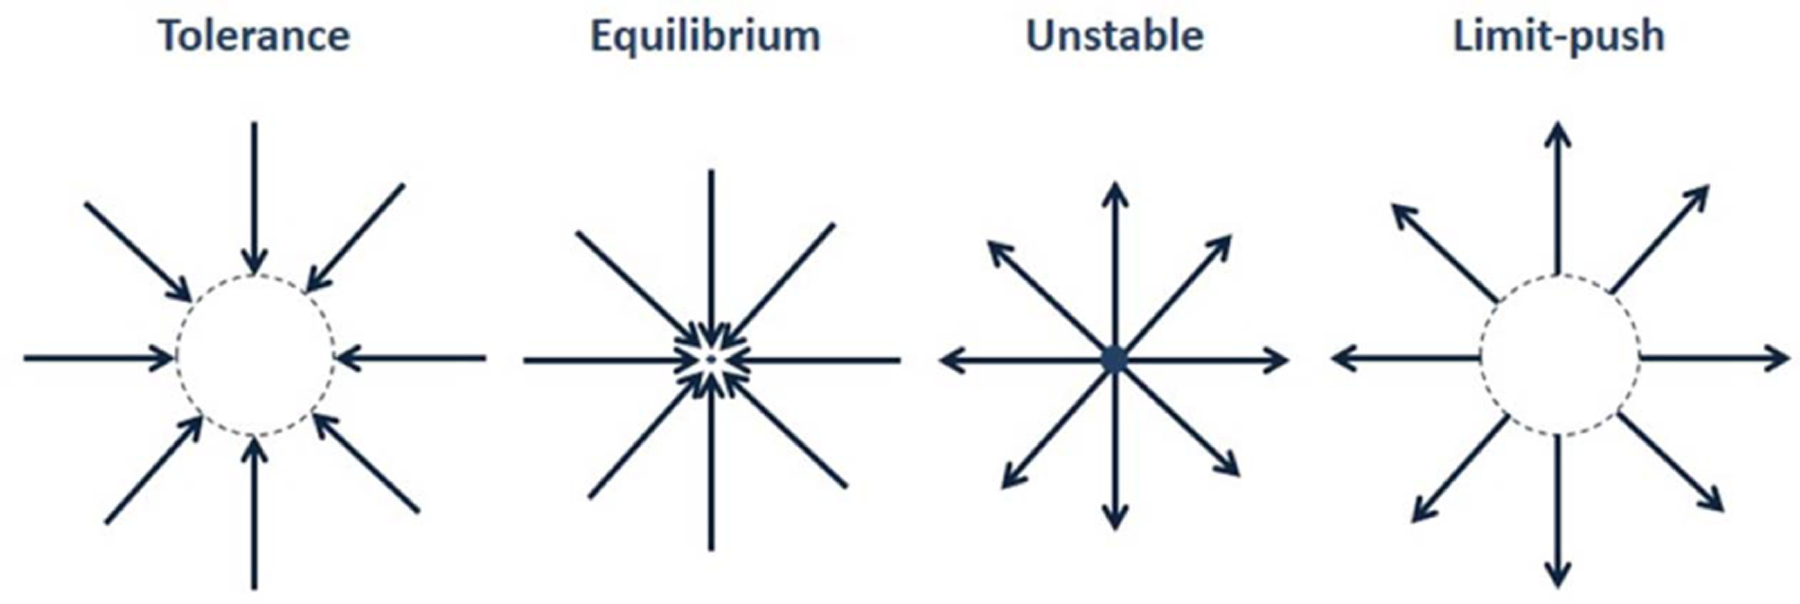
Several Classes of Force Fields. Limit-push forces push subjects away from a region once subject is outside the region.
Such forces are relatively catastrophic, similar to falling off a cliff or striking an obstacle. In contrast to robotic obstacle avoidance, our paradigm allowed operators to cross into high-cost regions. The task becomes unwieldy in the high-cost region. However, it was possible for the subject to recover by counteracting the forces and return to the inside of the box. We hypothesized that in response to the high-cost forces experienced outside the box, subject will adapt their behaviors to avoid high-cost, and therefore move more within the box region. If so, this would demonstrate a method that can be used to reshape the distribution of motions by selectively altering both central tendencies and variability.
Our approach to assessing if subjects reshaped their movement variability was to examine the spatiotemporal distribution of their movements with respect to the box. We particularly looked at how the position distributions were changed after experiencing the high-cost region. Previous work showed how the endpoints of trajectories were distributed with exposure to a high-cost region in healthy subjects [25]; however, here we present work on how both healthy and chronic stroke survivors distribute their entire set of motions with exposure to limit-push. A preliminary version of this work was presented elsewhere [26].
II. Methods
A. Subjects
The Healthy Cohort consisted of 18 able-bodied adult volunteers, the majority of whom were college-age and ranged between 21 and 28 years. Subjects gave informed, written consent to participate in this study in accordance with Northwestern and the University of Illinois at Chicago Institutional Review Boards (IRB), which specifically approved this study and follows the principles expressed in the Declaration of Helsinki. Subjects were randomly divided into Control and Treatment groups, each group consisting of 9 subjects.
The Stroke Cohort consisted of 10 subjects who had experienced a stroke incident at least 6 months prior to the study (50 +/− 9.3 years of age, ranging from 33 to 58). They were randomly assigned to Control and Treatment groups, and there were 5 subjects in each group. Inclusion criteria included a Fugl-Meyer score that ranged from 25 to 50 to ensure the subject could have some control of the limb and the ability to intercept the projectile within the experiment. Exclusion Criteria were: individuals with multiple lesions or stroke events, bilateral paresis, severe spasticity as assessed by the Ashworth score or evidenced by severe contracture of the arm, concurrent medical problems, severe sensory deficits, severe ataxia in the hemiparetic arm, significant reported pain greater than or equal to 5 on a 10-point scale with active or passive arm motion, or a Botox injection within the past 3 months.
For simplicity and privacy, data collected was restricted to motion and force data measured by the robot for the Healthy Cohort; however, we also collected age, weight, and height for the Stroke Cohort.
The Control groups practiced the same task for the same number of trials, but received no limit-push forces (“treatment”) associated with the box-shaped region.
B. Apparatus
Subjects sat at the center of the VRROOM (Virtual Reality and Robotic Optical Operations Machine) which provided a 3D, stereoscopic image of a large virtual space super-imposed on a robotic workspace. A cinema-quality digital projector (Christie Mirage 3000 DLP) produced a five-foot-wide 1280×1024 pixel image with a 110° field of view [27]. Subjects viewed the environment in stereo using CrystalEyes shutter glasses (StereoGraphics Inc.). The handheld robot (Whole Arm Manipulator, WAM, from Barrett Technologies, Cambridge, MA, USA) rendered forces throughout its large workspace that overlapped mostly with the arm workspace of the human. Motion data was logged at 100 Hz by the WAM to an Ubuntu PC. The benefits of this virtual reality system include safety, large adjustability of parameters and the overlap of the visual and robotic workspace.
C. Protocol
The experiment lasted approximately 35 minutes (matching a typical therapy session), and consisted of repetitive attempts to intercept projectiles in a pitch-black room, which reduces distraction. Note our task requires intercepting (rather than avoiding) projectiles. Subjects were instructed to intercept a projectile cube (1 kg; 5 cm) that traveled to their body, launched from a “home” region, approximately 1 m anterior to their chest. Subjects were warned that they may experience forces from the robot, but they were not informed as to when these forces would occur, nor were they informed as to the cause of these forces. The haptic feel of the collision was rendered as a pulse of force at the handle, at which point the object would halt and return to its home region. This pulse and the visual cue of the projectile’s interception were the only sources of feedback of success that subjects received, and failure was perceived as the absence of these cues. The experiment consisted of the following states: The projectile remained at rest for 0.1 seconds in the home region, and then was launched in a random direction at a velocity of 0.8 m/s toward the subject. After being hit or missed by the subject’s hand, the projectile moved in the reverse direction towards the home region. The total trial time varied, depending on the subject’s performance (approximately 1–4 seconds per trial). Subjects began each trial from the last position of the previous trial.
To artificially create regions of high-cost, we created this limit-push algorithm, which was a simple vector force field that pushed the hand further outside a rectangular region only if the hand exited the region (Fig. 2A and B):
| (1) |
where the vector W was the instantaneous location of the handle of the hand measured from the workspace center, C (Fig. 2B).
Fig. 2.

(A) Experimental Setup: Gray shaded box (3.75 cm depth along anterior-posterior axis) denotes the invisible low-cost region. Virtual projectile is launched along anterior-posterior axis approximately 0.8 m from workspace. The subject manipulated the robot in a 3d environment within a workspace (sphere). (B) Top-down View of Task During Treatment. Shaded region is the invisible box-like region. Arrows show direction of forces when hand is outside the box. The distribution of trajectory paths of the projectiles is shown as yellow shaded horizontal lines.
The resulting force of 4 N magnitude was always directed radially away from C. The limit-push magnitudes were a constant 4 N outside the box. This value was deemed to be safe, used in previous experiments [28] to significantly deflect the hand, and still allow recovery. To test how the shape of this box might influence adaptation, the box had infinite height and larger width (25 cm) than depth (3.75 cm) (Fig. 2A). The top of the box was aligned at a slight angle, 20 degrees rotated from vertical toward the subject, not associated with any particular anatomical axis. All projectile trajectories were designed to intersect within the width of the box (Fig. 2B). Subjects were not informed in any way about the box region, and were simply informed that the robot may push on their hand during the task.
The protection of our research subjects was a priority. In addition to hardware stops, the robot had position, velocity, and torque limits in robotic firmware. Additionally, an invisible virtual haptic “wall” (1 Newton/meter stiffness) was placed just anterior to the subject. When (rarely) encountered, all forces were subsequently turned off, the system was reset, and the protocol was resumed at that trial. To prevent motions near extremes of the workspace, we also displayed a large, semi-transparent green sphere, of 25 cm diameter, which changed color to red if subjects exited the box during treatment.
The experiment consisted of 200 trials each of a pre-treatment phase, treatment phase (limit-push forces were present for the treatment groups), and post-treatment phase. Subjects were given a 15-second rest every 25 trials, during which they could release the handle.
D. Preprocessing of Data
Continuously recorded robot endpoint positions (including between trials) were linearly resampled to 50 Hz and smoothed at 64 Hz using a LOESS filter. Trials where the subject position was beyond the workspace were removed from analyses. At most, 10 such trials were removed for a subject, and most of these were in the first several trials of the experiment when the subject was adjusting their position and learning the task.
E. Determining Reshaping of Distributions
The primary objective of this experiment was to assess whether subjects shifted and reshaped their motion distributions along the most constraining (narrowest) dimension of the box, the anterior-poster axis, to accommodate the invisible boundary established by the limit-push forces. We hypothesized that if subjects’ movements could be reshaped we might observe that:
They would shift their distribution of hand movements within the bounded region.
Their movements along the anterior-posterior axis would become more uniformly distributed within the bounded region.
To visualize the movement distributions along the anterior-posterior axis across 25 trial blocks (between rests), we estimated the probability density of subject motions using an 8-component multi-Gaussian model with MATLAB’s GMDistribution toolbox, referred to as distributions.
Our primary performance metric assessed how motions were situated in relation to the haptic box. We used the Measure of Safety (MoS), which was derived from previous literature on assessing safety-margins with respect to high-cost states [7], [8], [29]. Essentially, MoS measured how far subjects’ hands remained away from high cost for a trial.
| (2) |
The metric MoStrial measured safety as the minimum observed distance between the robot position and the nearest boundary edge along the anterior-posterior axis in an interception attempt, i.e. trial. For positions observed inside the boundary, the distances closest to the edge were least safe, because they created the greatest risk of entering the high-cost region. However, for positions observed outside the boundary, the least safe distances were furthest from the edge because they had the lowest probability for leaving the high-cost region, i.e. crossing back into safety. Hence, to construct MoS, the distances calculated for positions outside of the boundary were assigned a negative value while distances for positions inside the boundary were left positive. The MoS is the minimum of these signed distance values for each trial. The maximum value of MoS is the half-width of the boundary along the anterior-posterior axis, i.e., 0.0188 m. Low MoS values were more “risky” while high MoS values were more “safe”. Essentially, MoS assesses the “safety-margin” and spread of the positions observed with respect to the boundary.
Several secondary measures also were used to further test if subjects were adapting to avoid the high-cost regions. Percent Time Outside: we took the time spent outside the bounded box during the interception trial and divided it by the total trial time of interception to calculate this metric. Movement distributions of both stroke and healthy subjects were assessed through standard deviation and 95% confidence interval range of positions sampled across each dimension (horizontal, inferior-superior, and anterior-posterior) across the duration of the interception trial. We also measured uniformity of movement distributions within the bounds of the box. Multi-Gaussian mixture models fit a probability density function (PDF) to the movement distributions using a sliding 25-trial window (shortened as needed near the start and end of each phase). These density functions were compared to that of an ideal bounded uniform distribution situated over the box and we use the formula of R2, but adapted it for our purposes to assess how close the distribution was in both shape and position to the invisible box. R2 has an upper bound of 1, which would indicate the distribution of the hand was perfectly uniform within the box. R2 was not lower bounded for our purposes with negative values indicating subjects distributed their motions outside the box. Thus, we define the metric as the coefficient of determination (CoD),
| (3) |
where y is the PDF profile, f is the ideal distribution and is the PDF mean.
F. Statistical Analysis
For each 200-trial phase of the experiment, we fit the evolution of each subject’s performance metric to an exponential that assessed how well a subject distributed his or her motions within the box, over the entire phase (three phases, consisting of 200 trials: pre-treatment, treatment, post-treatment, respectively). Each phase of the experiment (pre-treatment: trials 1–200, treatment for Treatment group: trials 201–400, and post-treatment for Treatment group: trials 401–600) was best fit to an exponential model, and the resulting endpoints of the fit to each phase were considered the best estimate of subject performance at the start and end of a phase. Using these endpoints, our focus was on (1) how subjects changed during treatment – the treatment effect (2) how subjects were affected by treatment – the pre-to-post effect, and (3) how subjects changed after treatment – the post-to-final effect.
We assessed normality using the Shapiro-Wilk test, and if measurements were normal, we performed a mixed model Repeated Measures ANOVA with post-hoc comparisons. Non-normal measures were aligned-rank transformed and retested for normality, and if not normal, we subsequently only report the Friedman and Mann-Whitney analyses. If measures were normally distributed after an Aligned-Rank Transform, we reported the ANOVA results of the Aligned-Rank Transform and the results of the interaction tests [30], which were unpaired t-tests of the comparisons used for the Mann-Whitney analysis. We used IBM SPSS Statistics 21 for the Repeated Measures ANOVA and R for all other statistical tests. These tests were Bonferroni-Holm corrected.
III. Results
All subjects were initially able to manipulate the robot handle and successfully intercept most projectiles. However, unbeknownst to them, the focus of our experiment was to investigate changes in movement distributions when exposed to limit-push forces. As we hoped in this study, subjects’ baseline behavior was highly variable across both populations of healthy and stroke survivors, reflecting a luxury of choices for intercepting the projectile (Fig. 3 & 4). They typically began with the most variation, and after approximately 50 trials they established a baseline (Fig. 5 & 6). This variance in baseline was accounted for in ANOVA and the pre to post treatment change statistics.
Fig. 3.

Typical screenshot view (A) and three representative interception trials from pre-treatment (B), early treatment (C), and late treatment (D). The projectile (blue cube) and the hand (red cube) are shown at interception. The circles represent the subject’s initial position at launch of the projectile.
Fig. 4.

2D Projections of Healthy Treatment Subjects. Each colored dot is a different subject. Columns are snapshots of phases where pre-treatment represents the last 25 trials before the forces, end-treatment represents the last 25 trials of the treatment phase, early post-treatment represents the first 25 trials after the forces are deactivated and late post-treatment is the final 25 trials. The first row is top-down view, bottom row is side view. Note how the variability in position along anterior-posterior axis reduces with active limit-push forces by the end of treatment phase, but starts to increase once forces are off in the post-treatment phase. Variability in position is not visibly constrained along any other dimension.
Fig. 5.

Two Typical Healthy Subjects (Treatment, Control). Anterior-posterior position distribution of healthy treatment and healthy control subject. Gray shaded region indicates forces were on and the presence of a high-cost region. The red shaded and blue shaded curves are the resultant probability distributions of the anterior-posterior hand positions over 25 trial windows for a typical (A) treatment and (B) control subjects. When forces were on subjects clustered their distribution within the box-shaped low-cost region, but washed out when turned off. Black dots are the raw position data along the anterior-posterior axis. The minimum and maximum value along that axis were plotted along with every 20th sample.
Fig. 6.

Two Exemplary Stroke Subjects. Plot feature explanations are the same as Fig. 5. Behavior is similar to the healthy subjects shown before. The chosen stroke treatment subject was the best in the group at staying within the box.
A. Results From the Healthy Population
The limit-push treatment phase indeed caused an adaptive response where healthy subjects reduced the extent of departure from the haptic box boundaries. This was best seen as nearest distances from the box boundaries, measured by MoS (Repeated Measures ANOVA: F(3.422, 54.755) = 3.262; p = 0.017. Shapiro-Wilk: p = 0.2045). The treatment group’s movement extremes shifted more within the boundaries of the box region across the limit-push treatment phase (trials 201–400), reflected by an increase in MoS by 4.92+/− 5.84 cm (95% CI = [1.73, 9.25], p = 0.0279) (Fig. 8). Upon removal of the forces in the final phase (trials 401–600), we failed to see a residual change in behavior with reference to pre-treatment. Due to high inter- and intra-subject variability post-treatment, the training-induced changes of MoS did not detectably fade away, but we also did not detect any after-effect (comparing MoS values pre-to-post training phases).
Fig. 8.

MoS Group and Population Changes Across Experiment. Red = treatment; blue = control. Wings are 95% confidence intervals. (A) Measure of Safety (MoS) is plotted for each phase from the healthy population. MoS slightly decreases upon onset of forces before it increases after prolonged exposure for the treatment group. The control group is worse across this similar period. The change across treatment was statistically significant between groups. No effect is evident during post-treatment as subjects return to pre-treatment variability once forces are off. (B) The stroke population MoS is plotted for each phase. No statistically significant change was found across treatment phase for the treatment group, though a positive trend is visible. There was a sharp decrease in MoS upon onset of forces before some improvement compared to pre-treatment levels. Stroke subjects were more variable in their response to the forces than the healthy population as indicated by the large confidence intervals by end of treatment.
Treatment subjects also distributed their motions more uniformly within the box; this was additional evidence to indicate that subjects responded to the treatment. Hand distributions more closely resembled an idealized bounded-uniform distribution, as measured by our coefficient of determination (Repeated Measures ANOVA: F(3.925,62.799) = 11.093; p < 0.001. Shapiro-Wilk: p = 0.6736). Limit-push significantly improved CoD 1.77 +/− 0.902 [95% CI = [1.09, 2.433], p = 1.23e-6) more than the controls (Fig. 9). However as before, we failed to detect any lasting effect once forces were removed.
Fig. 9.

CoD Group and Population Changes Across Experiment. Red = treatment; blue = control. Wings are 95% confidence intervals. (A) CoD increases after prolonged exposure for the treatment group. The control group is worse across this similar period. The change was statistically significant across the treatment phase between groups. No effect is evident during post-treatment as subjects return to pre-treatment variability once forces are off. (B) Bar plots of Stroke population plotting CoD for each phase. No statistically significant change was found across treatment phase for the treatment group, though a positive trend is visible. Subjects were more variable in their response to the forces compared to the healthy population as indicated by the large confidence intervals by end of treatment.
We speculated that these limit-push effects might also be observed in the amount of time spent outside the box. Percent Time Outside was not normally distributed (Shapiro-Wilk: p = 0.01175), and an Aligned-Rank Transform did not help to normalize this data. The treatment group significantly reduced the Percent Time Outside the Box between baseline and the end of treatment by an average of 56.9% (Friedman: χ2(4): 13.156, p = 0.011), while the control group did not exhibit a meaningful change. We did not detect differences between treatment and control groups from the Mann-Whitney tests. Nevertheless, treatment subjects reduced the percent time outside the box from 73.9 +/− 11.8% at the end of baseline to 17 +/− 9.15% by end of the treatment phase. Once the forces were turned off subjects increased to 29.1 +/− 38.8% followed by a rise to 67.8 +/− 36% by the end of the experiment. There was no such change for the control group, which never dipped below 60% of time spent outside the box during the experiment, suggesting treated subjects were avoiding exposure to the forces.
We expected that by distributing motions within the box, subjects may have a constricted variance along the anterior-posterior axis (Figs. 5 and 6) measured by standard deviation and range. Standard deviations were indeed reduced after the limit-push training (Repeated Measures ANOVA: F(4,64) = 2.585; p = 0.045; normally distributed by the Shapiro-Wilk test, p = 0.0545). Healthy subjects decreased the standard deviation in their motions an average of 1.83 +/− 2.00 cm more than the control subjects (95% CI = [0.32, 3.3400]; p = 0.00401) over the course of training.
The limit-push forces may have also affected the range of movement along the anterior-poster axis, though this metric not normally distributed (Shapiro-Wilk: p = 1.395e-4). Instead, we report the nonparametric Friedman=and Mann-Whitney rank-sum tests. We found that the treatment group did change the range of movement along the anterior-posterior axis over the course of the experiment (Friedman: χ2(4) = 14.133, p = 0.007). We did not detect any change for the control group. Healthy treatment subjects reduced their range of movement along the anterior-posterior axis more than control subjects over the course of treatment (p = 0.00522, Control Mean Rank = 12.8, Treatment mean rank = 6.2, Control U = 11.0, Treatment U = 70.0, Z = −2.5608), suggesting subjects made more conservative movements along the anterior-posterior axis to avoid encountering the forces. Results from the Stroke Population
B. Results From the Stroke Population
We observed mixed, or inconsistent results for stroke subjects. Stroke subjects seemed to display avoidance behavior, but we did not see convincing evidence for this. Stroke subjects that received the limit-push forces strayed less from the box, reflected by MoS, than the control stroke subjects (Repeated Measures ANOVA: F(1,16) = 13.657; p = 0.006). The measurements could have come from a normal distribution (Shapiro-Wilk: p = 0.05309), however we failed to find any interaction effect between phase and group from our planned comparisons. Stroke treatment subjects also exhibited more uniform distributions of their hand within the box-like region, measured by CoD, overall (Repeated Measures ANOVA: F(1,8) = 6.630, p = 0.033). Furthermore, this seemed to be affected by the treatment (Repeated Measures ANOVA: F(4,32) = 3.296, p = 0.023). Measurements of CoD could have also come from a normal distribution (Shapiro-Wilk: p = 0.1234). However, we also failed to find an effect from our planned comparisons.
We wondered if stroke subjects also stiffened their limbs in response to the limit-push forces like healthy treatment subjects and found slight evidence for this behavior. We analyzed the position distributions of stroke subjects to detect changes due to the limit-push forces.
We found that stroke treatment subjects reduced their range of movement along the anterior-posterior axis (Shapiro Wilk: p = 0.001918; Friedman: χ2(4) = 9.600, p = 0.048). We could not attribute this to an effect of the limit-push forces, however. The treatment group also changed the range of movement along the anterior-posterior axis (Friedman: χ2(4) = 10.880, p = = 0.028). While the trend seemed consistent with the presentation of the forces, we did not detect any interaction effect between phase and group. Stroke treatment subjects exhibited a range of movement of 9.05 +/− 5.53 cm along the anterior-posterior axis by the end of late baseline which slightly increased to 10 +/− 3.43 cm upon the onset of forces then dramatically reduced to 5.18 +/ 4.39 cm by the end of the treatment phase before it increased again with the removal of forces. Subjects increased their range of movement along the anterior-posterior axis to 5.41 +/− 2.19 cm when forces were removed, and finally ended the experiment with 8.44 +/− 7.64 cm range of movement along the anterior-posterior axis. Standard deviation of positions observed along the inferior-superior axis appeared to be different across the stroke treatment and control group as well (Repeated Measures ANOVA: F(1,8) = 5.856, p = 0.042). The limit-push forces seemed to affect the treatment group’s distribution along the inferior-superior axis (Repeated Measures ANOVA: F(4,32) = 3.154, p = 0.027). This metric could have come from a normal distribution (Shapiro-Wilk: p = 0.7247). The stroke treatment group reduced their standard deviation of distributions along the inferior-superior axis more than the control group over the course of training by 2.55+/− 2.44 cm (p = 0.0414; 95% CI [−0.26, 5.36]). The metrics for ranges of movement along the inferior-superior and anterior-posterior axes were not normally distributed. There was some evidence of differences in the range of movement, which was also not normally distributed, along the inferior-superior axis for the control group (Friedman: X2(4) = 10.720, p = 0.030), suggesting that stroke subjects may have fatigued during the experiment. We found no difference along the horizontal axis.
Surprisingly, there were also changes exhibited along other dimensions, reflected by both standard deviation and range, suggesting avoidance of the forces was accompanied by co-contraction of the limbs as a behavioral strategy adopted by participants in the study. Subjects may have co-contracted stiffentheir limbs, thereby reducing extent of movement along other dimensions, as suggested by the reduction in standard deviation and/or range. However, none of these metrics were normally distributed, and thus we report only the nonparametric Friedman and Mann-Whitney rank-sum tests.
Interestingly, treated subjects changed their distributions of movement along the inferior-superior axis (measured by standard deviation of inferior-superior) over the course of the experiment (Friedman: χ2(4) = 26.222, p = 0.00), in contrast to the controls which did not change. Healthy subjects reduced the standard deviation of their distributions along the inferior-superior axis more than the control group over the course of treatment (p = 0.01342, Control Mean Rank = 12.7, Treatment Mean Rank = 6.3, Treatment U = 69.0, Control U = 12.0, Z = −2.4725). Correspondingly, treatment subjects also changed their inferior-superior range (Friedman: χ2(4) = 16.978) while no change was detected for the control group over the course of the experiment.
Treatment subjects reduced their range of movement along the inferior-superior axis more than the control group over the course of treatment (p = 0.02168, Control Mean Rank = 12.4, Treatment Mean Rank = 6.6, Control U = 14.0, Treatment U = 67.0, Z = −2.2959), suggesting forces affected subjects’ movement patterns along the inferior-superior axis by causing them to stiffen their limbs.
The treatment group also reduced the standard deviation of their movements along the horizontal axis more than the controls over the course of training (p = 02168, Control Mean Rank = 12.4, Treatment Mean Rank = 6.6, Control U = 14.0, Treatment U = 67.0, Z = −2.2959). Along the horizontal axis, the treatment group’s range of movements were altered over the course of the experiment (Friedman: χ2(4) = 16.622, p = 0.002), whereas the control group experienced no change. No interaction effects were found for the range of movement along the horizontal axis, however. Further investigation of movement trends did not detect a distinct difference between healthy and control groups as they both decreased range of movement along the horizontal axis over the span of pre-treatment to end treatment phases.
In summary, both healthy stroke subjects showed differences in both the MoS and CoD effects, but healthy subjects also showed differences along other axes (horizontal, inferior-superior). Stroke subjects did not reveal as many significant differences as the healthy, primarily showing differences along the anterior-posterior axis. This may be due to variation, as stroke subjects’ inter- and intra-subject variability was considerable, and this may have been the reason we failed to find some significant differences across groups.
IV. Discussion
This study investigated how subjects adapted to a harsh boundary, beyond which were disturbing forces that further pushed the subjects away from a “safe” region where no forces occurred. This novel robotic treatment, the limit-push force field, was designed to reshape the distributions of movement tendencies in healthy and stroke subjects. We presumed that adaptation would be motivated by a desire to avoid entering the high-cost region. While we found evidence of this behavior in healthy and stroke treatment subjects, we also found some evidence that subjects co-contracted their arm to reduce the extent of motions, because some subjects reduced movement along all axes, rather than just the critical axis in response to the forces. The treatment demonstrates an effective method for changing distributions of movement, albeit temporarily, and has enormous potential for altering a person’s variation as well as their central tendencies while performing a motor task.
The chosen task here was distinct from other motor control experiments; particularly, operators have the luxury of many movement choices with no clear optimum. This may be more representative of real-life activities in which people exploit the luxury of redundancy to accomplish motion with variability [31], [32]. Hasson and Sternad [33], Thorp et al. [34], and James et al. [7] have explored such tasks that have a vast null space of equally costly choices. What remains to be seen is whether therapy is better when the patient is required to best solve the problem their way given any limits presented by the environment, experimenters, or a therapist. However, a disadvantage of such tasks that allow subjects to choose their own solution is that high variance makes detecting significance more difficult.
Other aspects also increased the difficulty of detecting significance. Stroke has the added challenge of having large inter-subject variability, which hinders detection of group trends (Figs. 6B and 7B). Stroke subjects also have higher motor variability [35]. Furthermore, some stroke subject capability limits may have made adaptation impossible. Nevertheless, a few stroke subjects responded to limit-push. It remains to be seen whether spasticity, rigidity, weakness, contractures or other known deficits reduce the effectiveness of the limit-push treatment in stroke patients.
Fig. 7.

Coefficient of Determination (CoD) Plots. Healthy treatment (A, red) and control (B, blue) and stroke treatment (C, red), and control (D, blue) CoD fits of ideal bounded-uniform distribution of positions along anterior-posterior axis, 25 trials at a time, in an overlapping moving window. As can be seen, the red shaded region is largely positive during treatment phase in the treatment groups, and even after the forces are off there is greater incidence of positive CoD signifying that the subject tended to reduce time spent outside the boxed region more than before. Control subject does not exhibit this behavior. Cartoon inset shows how the distributions were computed and compared to the ideal bounded uniform distribution to derive the CoD score. When the subject was outside the 3.75 cm depth of the box region, a negative CoD would generally result (an extremely poor fit). Each colored line indicates movement traces that contributed to the distribution (shaded light red). Gold rectangle edges are bounds of the low-cost region.
This treatment is unique because forces only act in outlying areas, leaving the subjects to move unhindered in remaining space. This contrasts with more classic force fields that continually deflect or attract. It resulted in a redistribution of actions and should be useful in situations that require shifts in both mean and variance. This is the first study we know of which encourages avoidance to reshape movement distributions to pre-defined regions as an effect of the treatment.
The effects of the treatment in healthy and stroke subjects faded quickly (within 10 motions), although desired rehabilitation effects should be permanent. It remains to be seen whether any of these factors may change in response to the limit-push treatment at different (longer) time scales than those observed here.
Incremental changes could accumulate with repeated exposures. Subsequent exposures can also result in the “fast recall” phenomenon known as savings [36], where repeating a trained task recovers performance quickly in subsequent exposures. It remains to be seen if successive sessions of treatment result in a retention of change with only partial loss across time.
It appears that people can control their variability. Several studies claim that motor noise is an unavoidable consequence of signal strength [37] or joint configuration [38] rather than something that may be honed by practice. Such variability can occur across differing time scales (i.e, across milliseconds, or across training phases. Our subjects’ movement variability resulted in crossing the boundaries at times even after adaptation. This leads us to believe that variability is controllable up to a point, but that some residual amount of variation is unavoidable. It is consistent with variability observed due to physiological limits such as motor noise, inaccuracies in the motor plan or controlled response, and sensor inaccuracies. We found that subjects in our experiment chose to reduce their variability towards the inside of box-shaped boundary despite the narrowness of the region.
This finding implies that subjects chose to avoid the larger space outside of the box boundaries rather than fight the forces (an energy-minimizing solution), consistent with obstacle avoidance algorithms seen in robotics applications [18]. Our harsh boundaries are similar to the harsh boundaries of striking an obstacle. However, while stiff obstacles may stop or slow down movement, limit-push decouples the stiffness of the environment from the arm by pushing subjects further into the high-cost region once the boundary is breached. This phenomenon may result in increased co-contraction of the limb to reduce the length of the trajectory. Co-contraction would also reduce departure from the box if the boundaries are violated. Our metrics, (MoS, CoD) pinpoint the degree of avoidance of the high-cost region. These results were similar to other obstacle avoidance tasks in that humans were not perfect but instead reduced the probability of crossing the limit-push boundary [18] (Fig. 5 and Fig. 6). Subjects seemed to avoid the forces when they were present, but some returned to their baseline preferences, bearing even more similarity to obstacle avoidance studies.
Our task requires intercepting rather than avoiding projectiles, but our definition “safety” may be not reflect users’ full intentions. There may be a sub-conscious urge by some to defensively dodge projectiles rather than intercept them. This highlights the challenges of employing complicated tasks that not only allow multiple solutions, the task itself can runs the risk of having multiple interpretations. However, we assume that the familiarization phase of the experiment extinguished any fears of being struck by the virtual projectiles.
Interestingly, divergent force fields add energy that might be exploited (rather than avoided) by the user. With the proper timing and placement, subjects might take advantage of the forces that could launch them into the projectile. Such strategies have been proposed by Saha and Morasso [39], Loram et al. [40], and Morasso [41] and could be used by a savvy subject as an effective means of blocking. However, we have little evidence from inspecting our data that such a strategy was learned. Limit-push forces were so destabilizing and appeared on so fast that there was there was little time to react and subjects were not likely to be able to effectively control their movements, and instead would rather avoid them.
Avoidance of limit-push and related forces can be used to teach new movement patterns by requiring motor plans that avoid such catastrophic events. This and other studies [19] illustrate how haptics might be used to teach, and where boundaries of high-cost may be learned, involving memory storage of boundaries. While obstacles are likened to bumping into “walls” like the haptic boundary study [19], limit-push is likened to “falling off a cliff.” A direct consequence of limit-push, in contrast to studies that use haptic walls [42], is that subjects cannot use the “walls” to guide their movement, they must learn the boundaries and avoid them or suffer catastrophic consequences such as destabilizing forces. Limit-push required an encoding of the workspace, like the high-stiffness environment presented in the haptic boundary study [19], whereas the low-stiffness environment in that study required an encoding of the dynamics of the arm and the environment. An additional point of contrast between “falling off a cliff” and “bumping into walls” is the lower rate of learning caused by experience. Catastrophic falling off of a cliff is a singular experience, whereas “bumping” can be benign, allow repeated attempts, increase movement variability, and may result in many a variety of experiences (samples), allowing the memory of boundaries to be more complete. There are instances in daily activities such as falling as one learns to walk, that are more like falling off a cliff than bumping into walls. We hope that this study help elucidate the mechanisms behind how people avoid such catastrophes and other high-cost events.
V. Conclusion
This study demonstrated how an unstable limit-push training environment can reshape movement distributions, causing a shift of actions closer to regions of lower cost. We believe this study is pertinent because we are employing this paradigm to reshape movement variability. While avoidance of a cliff is certainly obvious, controlling variability through techniques such as limit-push is a new method for influencing both central tendency and variation of actions. This tool can be easily implemented in training precise actions such as surgeons and pilots and may prove useful in neurorehabilitation. It may be used simply train any technology that learns. Particularly, this training has potential benefit for patients who have suffered a stroke, as their movement variability can be problematic.
Acknowledgements
The authors would like to acknowledge the assistance provided by Dr. Saria Awadalla in our statistical analysis.
This work was supported by MARS3 RERC through NIDLIRR under Grant 90RE5010-01-01.
Contributor Information
Amit K. Shah, Department of Bioengineering, The University of Illinois at Chicago, Chicago, IL 60607 USA, and also with the Shirley Ryan AbilityLab, Chicago, IL 60611 USA.
Ian Sharp, The University of Illinois at Chicago, Chicago, IL 60607 USA, with the Shirley Ryan AbilityLab, Chicago, IL 60611 USA, and also with Television Internacional, Monterrey 64700, Mexico..
Eyad Hajissa, Department of Bioengineering, The University of Illinois at Chicago, Chicago, IL 60607 USA, and also with the Shirley Ryan AbilityLab, Chicago, IL 60611 USA.
James L. Patton, Department of Bioengineering, The University of Illinois at Chicago, Chicago, IL 60607 USA, and also with the Shirley Ryan AbilityLab, Chicago, IL 60611 USA.
References
- [1].Hausdorff JM, Rios DA, and Edelberg HK, “Gait variability and fall risk in community-living older adults: A 1-year prospective study,” Arch. Phys. Med. Rehabil, vol. 82, no. 8, pp. 1050–1056, Aug. 2001. [DOI] [PubMed] [Google Scholar]
- [2].Armand M, Huissoon JP, and Patla AE, “Stepping over obstacles during locomotion: Insights from multiobjective optimization on set of input parameters,” IEEE Trans. Rehabil. Eng, vol. 6, no. 1, pp. 43–52, Mar. 1998. [DOI] [PubMed] [Google Scholar]
- [3].Branton P, “A field study of repetitive manual work in relation to accidents at the work place,” Int. J. Prod. Res, vol. 8, no. 2, pp. 93–107, 1970. [Google Scholar]
- [4].Thies SB et al. , “Movement variability in stroke patients and controls performing two upper limb functional tasks: A new assessment methodology,” J. Neuroeng. Rehabil, vol. 6, no. 1, p. 2, 2009. [DOI] [PMC free article] [PubMed] [Google Scholar]
- [5].Kamper DG, McKenna-Cole AN, Kahn LE, and Reinkensmeyer DJ, “Alterations in reaching after stroke and their relation to movement direction and impairment severity,” Arch. Phys. Med. Rehabil, vol. 83, pp. 702–707, May 2002. [DOI] [PubMed] [Google Scholar]
- [6].Todorov E and Jordan MI, “Optimal feedback control as a theory of motor coordination,” Nature Neurosci, vol. 5, pp. 1226–1235, Nov. 2002. [DOI] [PubMed] [Google Scholar]
- [7].Patton JL, Lee WA, and Pai Y-C, “Relative stability improves with experience in a dynamic standing task,” Express Brain Res, vol. 135, no. 1, pp. 117–126, 2000. [DOI] [PubMed] [Google Scholar]
- [8].Hasson CJ, Shen T, and Sternad D, “Energy margins in dynamic object manipulation,” J. Neurophysiol, vol. 108., pp. 1349–1365, Sep. 2012. [DOI] [PMC free article] [PubMed] [Google Scholar]
- [9].Kuo AD and Zajac FE, “A biomechanical analysis of muscle strength as a limiting factor in standing posture,” J. Biomech, vol. 26, pp. 137–150, Jan. 1993. [DOI] [PubMed] [Google Scholar]
- [10].Cooke DF and Graziano MSA, “Defensive movements evoked by air puff in monkeys,” J. Neurophysiol, vol. 90, no. 5, pp. 3317–3329, Nov. 2003. [DOI] [PubMed] [Google Scholar]
- [11].Sambo CF and Iannetti GD, “Better safe than sorry? The safety margin surrounding the body is increased by anxiety,” J. Neurosci, vol. 33, no. 35, pp. 14225–14230, Aug. 2013. [DOI] [PMC free article] [PubMed] [Google Scholar]
- [12].Bernstein NA, The Co-Ordination and Regulation of Movements. New York, NY, USA: Pergamon, 1967. [Google Scholar]
- [13].Churchland MM, Yu BM, Ryu SI, Santhanam G, and Shenoy KV, “Neural variability in premotor cortex provides a signature of motor preparation,” J. Neurosci, vol. 26, pp. 3697–3712, Apr. 2006. [DOI] [PMC free article] [PubMed] [Google Scholar]
- [14].Hudson TE, Wolfe U, and Maloney LT, “Speeded reaching movements around invisible obstacles,” PLoS Comput. Biol, vol. 8, no. 9, p. e1002676, Sep. 2012. [DOI] [PMC free article] [PubMed] [Google Scholar]
- [15].Lee J and Choi S, “Effects of haptic guidance and disturbance on motor learning: Potential advantage of haptic disturbance,” in Proc. IEEE Haptics Symp, Mar. 2010, pp. 335–342. [Google Scholar]
- [16].Marchal-Crespo L, Schneider J, Jaeger L, and Riener R, “Learning a locomotor task: With or without errors?” J. Neuroeng. Rehabil, vol. 11, no. 1, p. 25, 2014. [DOI] [PMC free article] [PubMed] [Google Scholar]
- [17].Duarte JE and Reinkensmeyer DJ, “Effects of robotically modulating kinematic variability on motor skill learning and motivation,” J. Neurophysiol, vol. 113, no. 7, pp. 2682–2691, Apr. 2015. [DOI] [PMC free article] [PubMed] [Google Scholar]
- [18].de C. Hamilton AF and Wolpert DM, “Controlling the statistics of action: Obstacle avoidance,” J. Neurophysiol, vol. 87, pp. 2434–2440, May 2002. [DOI] [PubMed] [Google Scholar]
- [19].Chib VS, Patton JL, Lynch KM, and Mussa-Ivaldi FA, “Haptic identification of surfaces as fields of force,” J. Neurophysiol, vol. 95, no. 2, pp. 1068–1077, Feb. 2006. [DOI] [PubMed] [Google Scholar]
- [20].Landy MS, Trommershäuser J, and Daw ND, “Dynamic estimation of task-relevant variance in movement under risk,” J. Neurosci, vol. 32, pp. 12702–12711, Sep. 2012. [DOI] [PMC free article] [PubMed] [Google Scholar]
- [21].Trommershäuser J, Maloney LT, and Landy MS, “Decision making, movement planning and statistical decision theory,” Trends Cogn. Sci, vol. 12, no. 8, pp. 291–297, Aug. 2008. [DOI] [PMC free article] [PubMed] [Google Scholar]
- [22].Khatib O, “Real-time obstacle avoidance for manipulators and mobile robots,” in Proc. IEEE Int. Conf. Robot. Autom, vol. 2, Mar. 1985, pp. 500–505. [Google Scholar]
- [23].Frémaux N, Sprekeler H, and Gerstner W, “Functional requirements for reward-modulated spike-timing-dependent plasticity,” J. Neurosci, vol. 30, no. 40, pp. 13326–13337, 2010. [DOI] [PMC free article] [PubMed] [Google Scholar]
- [24].Patton JL, Stoykov ME, Kovic M, and Mussa-Ivaldi FA, “Evaluation of robotic training forces that either enhance or reduce error in chronic hemiparetic stroke survivors,” Express Brain Res, vol. 168, no. 3, pp. 368–383, Jan. 2006. [DOI] [PubMed] [Google Scholar]
- [25].Sharp I and Patton JL, “Limit-push training reduces motor variability,” in Proc. IEEE Int. Conf. Rehabil. Robot, Jun./Jul. 2011, pp. 1–6. [DOI] [PMC free article] [PubMed] [Google Scholar]
- [26].Shah A, Patton J, Sharp I, and Lazzarro E, “High cost training to recondition movement variability,” Soc. Neurosci, to be published. [Google Scholar]
- [27].Patton J, Dawe G, Scharver C, Mussa-Ivaldi F, and Kenyon R, “Robotics and virtual reality: A perfect marriage for motor control research and rehabilitation,” Assist. Technol, vol. 18, no. 2, pp. 181–195, Jan. 2006. [DOI] [PubMed] [Google Scholar]
- [28].Abdollahi F et al. , “Arm control recovery enhanced by error augmentation,” in Proc. IEEE Int. Conf. Rehabil. Robot, Jun./Jul. 2011, pp. 1–6. [DOI] [PMC free article] [PubMed] [Google Scholar]
- [29].Yang F and Pai Y-C, “Can stability really predict an impending slip-related fall among older adults?” J. Biomech, vol. 47, no. 16, pp. 3876–3881, Dec. 2014. [DOI] [PMC free article] [PubMed] [Google Scholar]
- [30].Wobbrock JO, Findlater L, Gergle D, and Higgins JJ, “The aligned rank transform for nonparametric factorial analyses using only ANOVA procedures,” in Proc. SIGCHI Conf. Hum. Factors Comput. Syst, 2011, pp. 143–146. [Google Scholar]
- [31].Karniel A, Meir R, and Inbar GF, “Exploiting the virtue of redundancy,” in Proc. Int. Joint Conf. Neural Netw. (IJCNN), Jul. 1999, pp. 2204–2209. [Google Scholar]
- [32].Martin V, Scholz JP, and Schöner G, “Redundancy, self-motion, and motor control,” Neural Comput, vol. 21, no. 5, pp. 1371–1414, May 2009. [DOI] [PMC free article] [PubMed] [Google Scholar]
- [33].Hasson CJ and Sternad D, “Safety margins in older adults increase with improved control of a dynamic object,” Front. Aging Neurosci, vol. 6, p. 158, Jul. 2014. [DOI] [PMC free article] [PubMed] [Google Scholar]
- [34].Thorp EB, Kording KP, and Mussa-Ivaldi FA, “Using noise to shape motor learning,” J. Neurophysiol, vol. 117, pp. 728–737, Feb. 2017. [DOI] [PMC free article] [PubMed] [Google Scholar]
- [35].Cirstea MC and Levin MF, “Compensatory strategies for reaching in stroke,” Brain, vol. 123, pp. 940–953, May 2000. [DOI] [PubMed] [Google Scholar]
- [36].Smith MA, Ghazizadeh A, and Shadmehr R, “Interacting adaptive processes with different timescales underlie short-term motor learning,” PLoS Biol, vol. 4, no. 6, p. e179, 2006. [DOI] [PMC free article] [PubMed] [Google Scholar]
- [37].Harris CM and Wolpert DM, “Signal-dependent noise determines motor planning,” Nature, vol. 394, pp. 780–784, Aug. 1998. [DOI] [PubMed] [Google Scholar]
- [38].Scholz JP and Schöner G, “The uncontrolled manifold concept: Identifying control variables for a functional task,” Express Brain Res, vol. 126, no. 3, pp. 289–306, May 1999. [DOI] [PubMed] [Google Scholar]
- [39].Saha DJ and Morasso P, “Stabilization strategies for unstable dynamics,” PLoS ONE, vol. 7, no. 1, p. e30301, Jan. 2012. [DOI] [PMC free article] [PubMed] [Google Scholar]
- [40].Loram ID, Lakie M, and Gawthrop PJ, “Visual control of stable and unstable loads: What is the feedback delay and extent of linear time-invariant control?” J. Physiol, vol. 587, no. 6, pp. 1343–1365, Mar. 2009. [DOI] [PMC free article] [PubMed] [Google Scholar]
- [41].Morasso P, “‘Brute force’vs.’gentle taps’ in the control of unstable loads,” J. Physiol, vol. 589, no. 3, pp. 459–460, Feb. 2011. [DOI] [PMC free article] [PubMed] [Google Scholar]
- [42].Chib VS, Patton JL, Lynch KM, and Mussa-Ivaldi FA, “Haptic discrimination of perturbing fields and object boundaries,” in Proc. 12th Int. Symp. Haptic Interfaces Virtual Environ. Teleoperator Syst. (HAPTICS), Mar. 2004, pp. 375–382. [Google Scholar]