Abstract
Osteoarthritis (OA) is the most common joint disease associated with pain and disability. OA patients are at a high risk for venous thrombosis (VTE). Here, we developed an interpretable machine learning (ML)-based model to predict VTE risk in patients with OA. To establish a prediction model, we used six ML algorithms, of which 35 variables were employed. Recursive feature elimination (RFE) was used to screen the most related clinical variables associated with VTE. SHapley additive exPlanations (SHAP) were applied to interpret the ML mode and determine the importance of the selected features. Overall, 3169 patients with OA (average age: 66.52 ± 7.28 years) were recruited from Xi’an Honghui Hospital. Of these, 352 and 2817 patients were diagnosed with and without VTE, respectively. The XGBoost algorithm showed the best performance. According to the RFE algorithms, 15 variables were retained for further modeling with the XGBoost algorithm. The top three predictors were Kellgren–Lawrence grade, age, and hypertension. Our study showed that the XGBoost model with 15 variables has a high potential to predict VTE risk in patients with OA.
Keywords: osteoarthritis, venous thrombosis, VTE risk prediction, machine learning algorithm, population-based cohort study
1. Introduction
Osteoarthritis (OA) is the most common joint disease worldwide, with an age-associated increase in both incidence and prevalence [1,2]. It is estimated that approximately 302 million people globally suffer from this disease, and the associated healthcare resources and financial burden can be substantial [3,4]. OA, a primary cause of pain, disability, and joint replacement, is characterized by disease affecting the whole joint, including articular cartilage degradation, synovium and ligament inflammation, and changes to the subchondral bone [5,6,7]. Despite the symptomatic treatment of pain, stiffness, and swelling, there are no FDA-approved disease-modifying drugs [8]. As a complex disease, a multitude of possible etiologies contribute to the development of OA, including obesity, sedentary lifestyle, trauma, and aging [9,10,11]. Early prevention and elimination of risk factors are critical in delaying disease progression [12]. Nevertheless, despite these identifiable underlying causes, OA still cannot be effectively prevented.
Venous thrombosis is a relatively common and potentially fatal condition in patients, and an increased risk of VTE has been reported in arthritis, particularly in rheumatic arthritis (RA) [13,14,15,16]. Li et al. reported that RA patients have an increased risk of VTE, pulmonary embolism, and deep vein thrombosis after diagnosis in comparison with the general population [17]. This suggests that VTE may play a vital role in chronic and systemic inflammatory autoimmune disease. However, the relationship between OA and VTE has not been elucidated. A recent study in a large population-based cohort revealed that knee or hip osteoarthritis might increase incident VTE risk to 40% and 80%, respectively, when compared to those without OA, which may be partly mediated through joint replacement [18].
Thus, predicting the VTE risk among OA patients is critical to reduce morbidity and mortality from VTE in OA patients. Machine learning (ML) is a computer-based method of data analysis that is often used to construct predictive models based on large datasets [19]. In this study, we aimed to develop a model using the ML algorithm to identify those at high risk of VTE in OA patients
2. Materials and Methods
We performed a single-center cross-sectional study of OA patients in Xi’an Honghui Hospital between January 2018 and December 2020. Patients were consecutively recruited from joint surgery department and were examined by venous ultrasound of the legs to assess VTE risk. The inclusion criteria were as follows: (1) diagnosed with knee osteoarthritis (guidelines for the diagnosis and treatment of osteoarthritis (2018 edition)) [20]; (2) radiographically evaluated by X-ray at Kellgren–Lawrence grade stages 3–4. Those with heart stent, ischemic stroke, cancers, or incomplete laboratory data were excluded from the study. The study was approved by the Ethics Committee of Xi’an Honghui Hospital and conducted in accordance with the Declaration of Helsinki. Written informed consent was waived owing to the retrospective nature of the study. All confidential patient information was deleted from the entire dataset prior to the analysis.
All patient demographics and laboratory data at admission were extracted manually from electronic medical records using a standardized case report form.
2.1. Machine Learning Algorithms
To develop machine learning models, 35 parameters were used for the analysis. Before developing the ML models, laboratory indices, which were continuous variables, were converted into categorical variables based on their normal range values. In addition, the patient’s age was treated as a continuous variable, with missing values replaced by median values. All patients were randomly divided into a training set and test set at a ratio of 8:2.
Six ML algorithms, namely logistic regression (LR), random forest (RF), extreme gradient boosting (XGBoost), adaptive boosting (AdaBoost), gradient boosting decision tree (GBDT), and light gradient boosting machine (LGBM), were used to predict the VTE risk. We used the receiver operating characteristic (ROC) curve as the evaluation metric to compare the performance of the ML algorithm between the training and testing sets. The best performance model was chosen, and recursive feature elimination (RFE) was employed to screen the optimized variable combinations. For model interpretation, the Shapley additive exPlanations (SHAP) algorithm was used to calculate the Shapley value of each variable based on game theory to further explain the best performance model.
2.2. Statistical Analysis
All statistical analyses were conducted using Python software (version 3.8). A Fisher’s exact test or an x2 test was conducted for binary variables, and Student’s t-test was used for continuous variables. Owing to the imbalance of the dataset, the synthetic minority oversampling technique (SMOTE) was used to deal with the training set. Six ML algorithms were used to screen for the best performance prediction model. Using the RFE algorithm, all variables were filtered one by one to obtain the best combination, which was then established in a selected ML prediction model. We also used the SHAP algorithm to interpret and evaluate the optimized model. Statistical significance was set at p ≤ 0.05.
3. Results
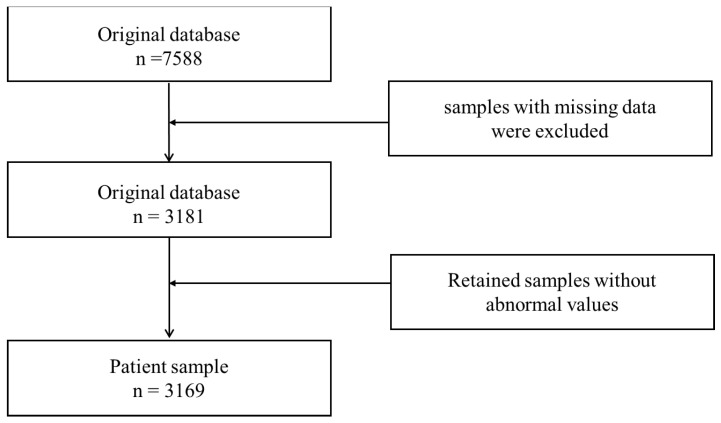
We excluded subjects with missing data and subsequently enrolled 3169 patients with an average age of 66.52 ± 7.28 years in the study (Figure 1). Of them, 2400 patients were male and 769 patients were female, accounting for 75.73% and 24.27% of all patients, respectively. All patients were divided into the VTE and non-VTE groups. There were 352 patients with VTE, with an average age of 68.05 ± 6.84 and 2817 patients without VTE, with an average age of 66.33 ± 7.31. In the VTE group, 281 patients were male (79.83%) and 71 patients were female (20.17%). In the non-VTE group, 2119 patients were male (75.22%) and 698 were female (24.78%). The baseline characteristics of patients stratified by VTE are summarized in Table 1.
Figure 1.
Flow chart of patients for enrollment.
Table 1.
Characteristics of the patients stratified by VTE or not.
| Class a | Total | None-Venous Thrombosis | Venous Thrombosis | p b | |
|---|---|---|---|---|---|
| N | 3169 | 2817 | 352 | ||
| Age (year) b | 66.52 ± 7.28 | 66.33 ± 7.31 | 68.05 ± 6.84 | <0.001 | |
| Gender | |||||
| Male | 2400 (75.73%) | 2119 (75.22%) | 281 (79.83%) | 0.066 | |
| Female | 769 (24.27%) | 698 (24.78%) | 71 (20.17%) | ||
| Hypertension | |||||
| No | 1730 (54.59%) | 1543 (54.77%) | 187 (53.12%) | 0.597 | |
| Yes | 1439 (45.41%) | 1274 (45.23%) | 165 (46.88%) | ||
| Diabetes | |||||
| No | 2751 (86.81%) | 2437 (86.51%) | 314 (89.20%) | 0.185 | |
| Yes | 418 (13.19%) | 380 (13.49%) | 38 (10.80%) | ||
| Coronary heart disease | |||||
| No | 2207 (69.64%) | 1974 (70.07%) | 233 (66.19%) | 0.152 | |
| Yes | 962 (30.36%) | 843 (29.93%) | 119 (33.81%) | ||
| Kellgren–Lawrence grade | |||||
| 0 | 2269 (71.60%) | 1943 (68.97%) | 326 (92.61%) | <0.001 | |
| III | 181 (5.71%) | 178 (6.32%) | 3 (0.85%) | ||
| IV | 719 (22.69%) | 696 (24.71%) | 23 (6.54%) | ||
| Eosinophil ratio | |||||
| Normal Range | 2746 (86.65%) | 2431 (86.30%) | 315 (89.49%) | 0.115 | |
| Abnormal | 423 (13.35%) | 386 (13.70%) | 37 (10.51%) | ||
| Hematocrit | |||||
| Normal Range | 2535 (79.99%) | 2254 (80.01%) | 281 (79.83%) | 0.991 | |
| Abnormal | 634 (20.01%) | 563 (19.99%) | 71 (20.17%) | ||
| Mean platelet volume | |||||
| Normal Range | 2782 (87.79%) | 2462 (87.40%) | 320 (90.91%) | 0.070 | |
| Abnormal | 387 (12.21%) | 355 (12.60%) | 32 (9.09%) | ||
| Thrombocytocrit | |||||
| Normal Range | 2858 (90.19%) | 2527 (89.71%) | 331 (94.03%) | 0.013 | |
| Abnormal | 311 (9.81%) | 290 (10.29%) | 21 (5.97%) | ||
| platelet-larger cell ratio | |||||
| Normal Range | 2390 (75.42%) | 2112 (74.97%) | 278 (78.98%) | 0.114 | |
| Abnormal | 779 (24.58%) | 705 (25.03%) | 74 (21.02%) | ||
| Uric acid | |||||
| Normal Range | 2554 (80.59%) | 2261 (80.26%) | 293 (83.24%) | 0.208 | |
| Abnormal | 615 (19.41%) | 556 (19.74%) | 59 (16.76%) | ||
| Glucose | |||||
| Normal Range | 2665 (84.10%) | 2369 (84.10%) | 296 (84.09%) | 0.941 | |
| Abnormal | 504 (15.90%) | 448 (15.90%) | 56 (15.91%) | ||
| Antistreptococcal hemolysin “O” | |||||
| Normal Range | 3074 (97.00%) | 2726 (96.77%) | 348 (98.86%) | 0.045 | |
| Abnormal | 95 (3.00%) | 91 (3.23%) | 4 (1.14%) | ||
| Anti-CCP antibody | |||||
| Normal Range | 2549 (80.44%) | 2255 (80.05%) | 294 (83.52%) | 0.140 | |
| Abnormal | 620 (19.56%) | 562 (19.95%) | 58 (16.48%) | ||
| Rheumatoid factors | |||||
| Normal Range | 2902 (91.57%) | 2577 (91.48%) | 325 (92.33%) | 0.661 | |
| Abnormal | 267 (8.43%) | 240 (8.52%) | 27 (7.67%) |
a Continuous variable are transformed to dichotomous variables according to their normal range. b Values are presented as mean ± SD.
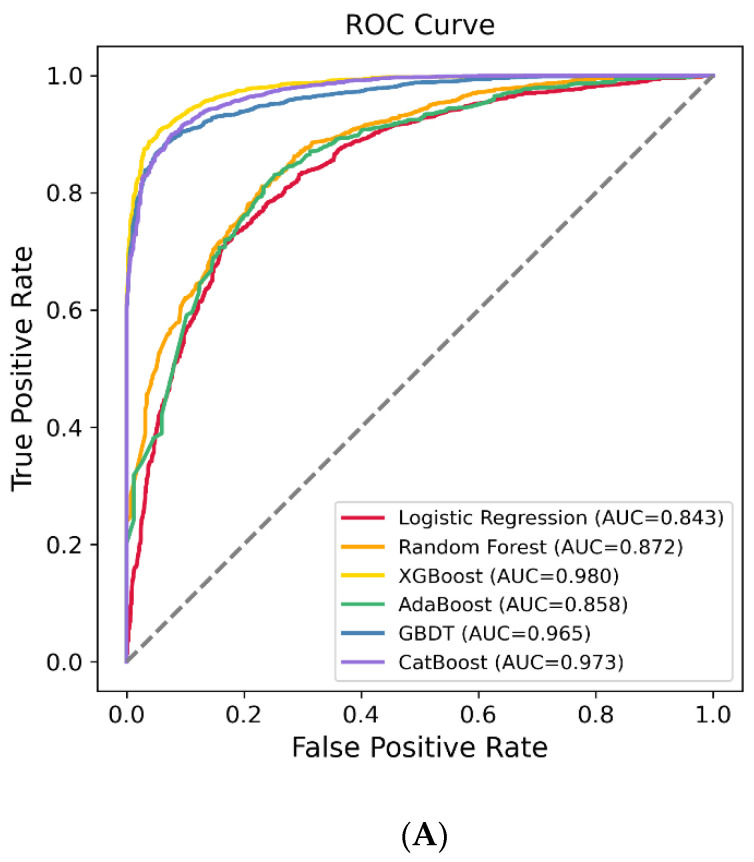
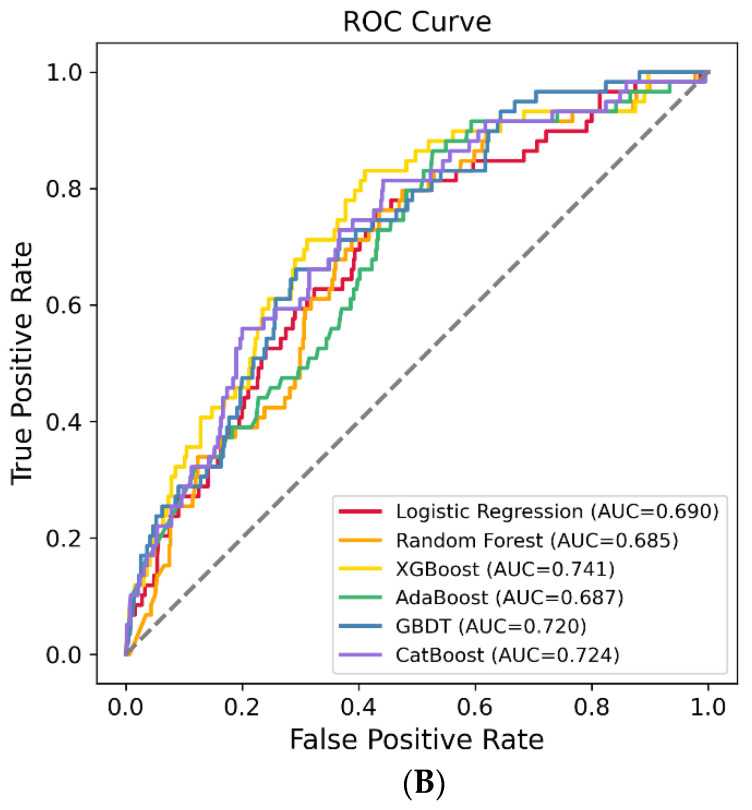
The patients were randomly stratified (8:2) into training and testing sets to evaluate the model performance. Finally, a total of 35 characteristics were enrolled in the six ML algorithms, including LR, RF, XGBoost, AdaBoost, GBDT, and LGBM, to identify the model with the best predictive performance. Our results showed that the XGBoost model demonstrated the best performance, with an area under the curve (AUC) of 0.741 (95% CI: 0.676, 0.806) (Figure 2A,B). The AUC values of the other models are shown in Table 2.
Figure 2.
The receiver operating characteristic (ROC) curves of the machine learning models on the training set (A) and testing set (B).
Table 2.
The area under the curve (AUC) of training set and testing set.
| Training Set (AUC, 95% CI) | Testing Set (AUC, 95% CI) | |
|---|---|---|
| LR | 0.843 (0.832, 0.855) | 0.690 (0.620, 0.760) |
| RF | 0.872 (0.862, 0.882) | 0.685 (0.618, 0.753) |
| XGBoost | 0.980 (0.977, 0.983) | 0.741 (0.676, 0.806) |
| AdaBoost | 0.858 (0.847, 0.868) | 0.687 (0.619, 0.755) |
| GBDT | 0.965 (0.960, 0.970) | 0.720 (0.656, 0.784) |
| CatBoost | 0.973 (0.969, 0.977) | 0.724 (0.657, 0.790) |
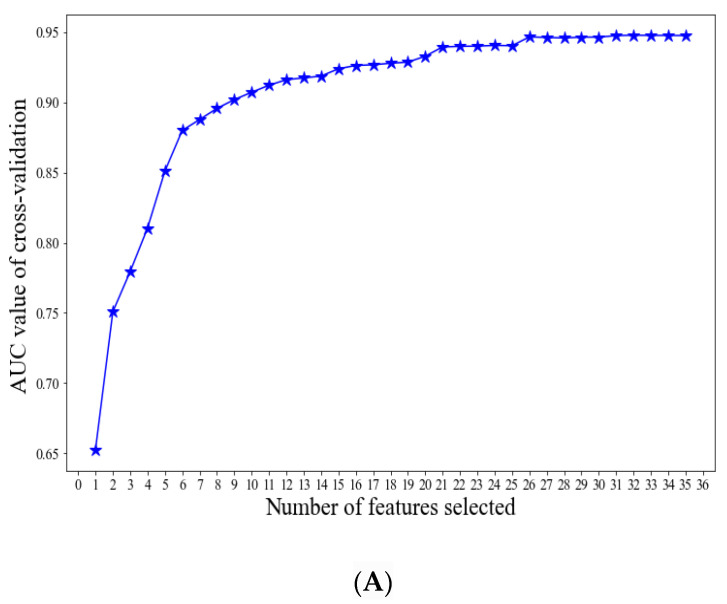
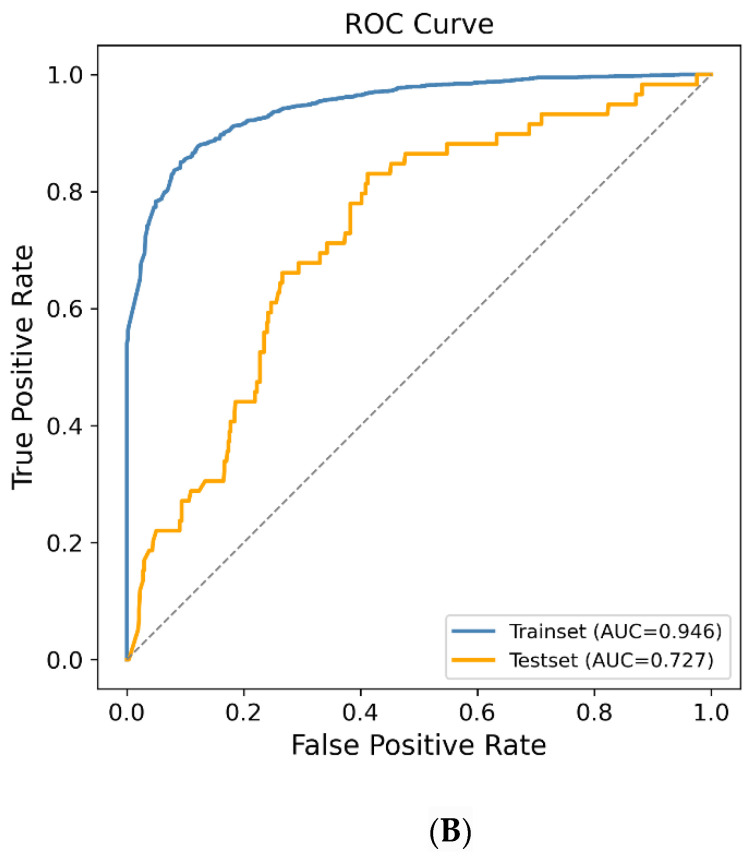
To further optimize the XGBoost model, the RFE method was used to screen the most important variables that can predict the VTE risk. Finally, 15 variables were employed to establish the final prediction model, and the new XGBoost model showed that the AUC of the testing dataset was 0.727 (95% CI = 0.662, 0.792) (Figure 3A,B).
Figure 3.
Using the RFE method to screen the optimal variables. (A) The most import variables, screened by the RFE method; (B) The receiver operating characteristic (ROC) curves of XGBoost model on the training set and testing set.
Interpretation and Evaluation of Machine Learning Model
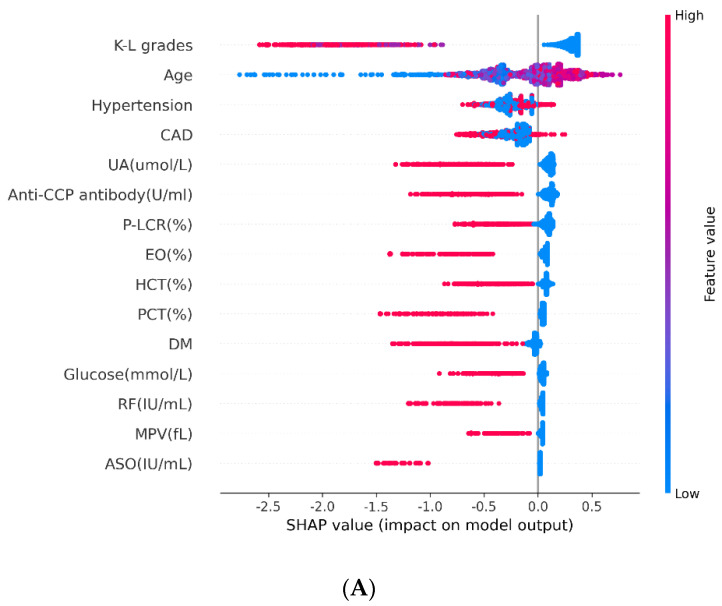
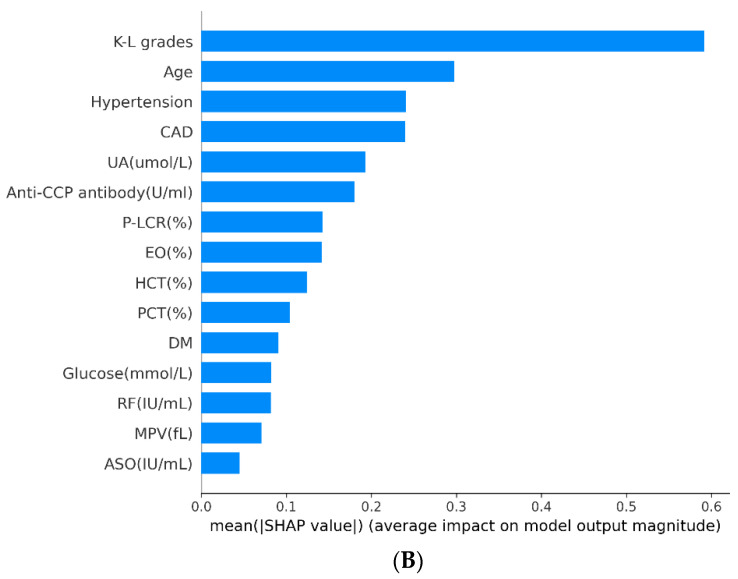
The SHAP method was also used to interpret the relative importance of each variable in the XGBoost model. Our results showed that age, eosinophil ratio (EOSR), hematocrit (HCT), mean platelet volume (MPV), thrombocytocrit (PCT), platelet-larger cell ratio (P-LCR), uric acid (UA), glucose, antistreptococcal hemolysin “O” (ASO), anti-cyclic citrullinated peptide antibody (ACPA), rheumatoid factor (RF), Kellgren–Lawrence grade (K–L grade), history of hypertension, diabetes, and coronary artery disease (CAD) were associated with the risk of VTE in OA patients. Particularly, K–L grade, age, and hypertension were the three vital variables (Figure 4A,B).
Figure 4.
Interpretation and Evaluation of Machine Learning Model. (A) SHAP analysis on the dataset, which shows the 15 most important features and their impact on the model output. Each dot represents one patient, with blue color meaning the lowest range and red color meaning the highest range of the feature; (B) Ranking of the features’ importance indicated by SHAP analysis.
4. Discussion
Extensive efforts have been made to delay OA patients progress to the end stage. In this hospital-based cross-sectional study, we used the ML algorithm to predict VTE risk in patients with OA. We found that using the XGBoost model with 15 variables can predict VTE risk in OA patients, and this may have a growing prevalence due to the global ageing population.
OA is not simply a matter of mechanical damage to the joint but involves several additional risk factors [21]. Nevertheless, some patients still inevitably rapidly progress to the end stages [22]. The 11th leading cause of disability worldwide has resulted in a rapid increase in orthopedic surgeries over the last few decades [4]. Rather than medication, lifestyle modification is the most promising avenue for the prevention of OA [3,23]. Many risk factors, including VTE, have been identified, and these may be partly mediated through knee or hip replacement. In a large population-based cohort study, Zeng et al. reported that VTE increased by approximately 40% among individuals with knee OA and by 80% among individuals with hip OA compared to those without OA [18].
Machine learning is a crucial branch of artificial intelligence that utilizes historical data to predict the likelihood of a future outcome [24,25]. As a multidisciplinary approach, ML algorithms are increasingly being utilized to predict outcomes in lower-extremity total joint arthroplasty [26]. Lu et al. used ML to establish a model to predict surgical outcomes after non-compartmental knee arthroplasty [27]. Kunze et al. developed machine learning algorithms based on partially modifiable risk factors for predicting dissatisfaction after arthroplasty [28]. In this study, we found that the XGBoost algorithm was the best performing algorithm. In this prediction model, 15 variables were found to be associated with VTE risk. In addition to the conventional risk factors such as age, hypertension, and diabetes, our study found that CAD, EOSR, HCT, MPV, PCT, P-LCR, UA, ASO, ACPA, RF, and Kellgren–Lawrence grade were also correlated with VTE. These have not been reported elsewhere.
The present study has certain limitations. First, although ML algorithms are widely used in medical practice, the predictive value is limited due to the “black box” characteristic. Thus, rather than being used as a clinical judgment tool, an ML algorithm model should be used as a reference for physicians. Second, all the data analyzed in the present study were from a single institution, and the imbalance of gender ratio has limited the generalization of our results. Additionally, because of the nature of an observational study, some unmeasured confounding effects may persist; thus, additional validation and assessment of the relationship between the variables and VTE in OA patients should be performed in a large population. Nevertheless, despite such limitations, to our knowledge, this is the first study to use a machine learning method to predict VTE risk in OA patients.
5. Conclusions
In conclusion, we developed a XGBoost model with a high accuracy in the prediction of VTE risk in patients with OA, which might supply a complementary tool for the screening of populations at high risk of VTE.
Author Contributions
Conceptualization, P.X.; methodology, C.L. and J.S.; formal analysis, C.L. and J.S.; investigation, H.L. and W.Y.; resources, Y.H.; writing—original draft preparation, C.L.; supervision, P.X. and K.X. All authors have read and agreed to the published version of the manuscript.
Funding
This research was funded by National Natural Science Foundation of China, grant number 82072432.
Institutional Review Board Statement
The study was approved by the Ethics Committee of Xi’an Honghui Hospital and conducted in accordance with the Declaration of Helsinki.
Informed Consent Statement
Written informed consent was waived owing to the retrospective nature of the study. All confidential patient information was deleted from the entire dataset prior to the analysis.
Data Availability Statement
The authors confirm that all data underlying the findings are fully available and can be obtained after submitting a request to the corresponding author.
Conflicts of Interest
The authors declare no conflict of interest.
Footnotes
Publisher’s Note: MDPI stays neutral with regard to jurisdictional claims in published maps and institutional affiliations.
References
- 1.Barnett R. Osteoarthritis. Lancet. 2018;391:1985. doi: 10.1016/S0140-6736(18)31064-X. [DOI] [PubMed] [Google Scholar]
- 2.Villafane J.H., Valdes K., Pedersini P., Berjano P. Osteoarthritis: A call for research on central pain mechanism and personalized prevention strategies. Clin. Rheumatol. 2019;38:583–584. doi: 10.1007/s10067-018-4270-4. [DOI] [PubMed] [Google Scholar]
- 3.Kolasinski S.L., Neogi T., Hochberg M.C., Oatis C., Guyatt G., Block J., Callahan L., Copenhaver C., Dodge C., Felson D., et al. 2019 American college of rheumatology/arthritis foundation guideline for the management of osteoarthritis of the hand, hip, and knee. Arthritis Rheumatol. 2020;72:220–233. doi: 10.1002/art.41142. [DOI] [PMC free article] [PubMed] [Google Scholar]
- 4.Palazzo C., Nguyen C., Lefevre-Colau M.M., Rannou F., Poiraudeau S. Risk factors and burden of osteoarthritis. Ann. Phys. Rehabil. Med. 2016;59:134–138. doi: 10.1016/j.rehab.2016.01.006. [DOI] [PubMed] [Google Scholar]
- 5.Abramoff B., Caldera F.E. Osteoarthritis: Pathology, diagnosis, and treatment options. Med. Clin. N. Am. 2020;104:293–311. doi: 10.1016/j.mcna.2019.10.007. [DOI] [PubMed] [Google Scholar]
- 6.Goldring S.R., Goldring M.B. Changes in the osteochondral unit during osteoarthritis: Structure, function and cartilage-bone crosstalk. Nat. Rev. Rheumatol. 2016;12:632–644. doi: 10.1038/nrrheum.2016.148. [DOI] [PubMed] [Google Scholar]
- 7.Sanchez-Romero E.A., Pecos-Martin D., Calvo-Lobo C., Garcia-Jimenez D., Ochoa-Saez V., Burgos-Caballero V., Fernandez-Carnero J. Clinical features and myofascial pain syndrome in older adults with knee osteoarthritis by sex and age distribution: A cross-sectional study. Knee. 2019;26:165–173. doi: 10.1016/j.knee.2018.09.011. [DOI] [PubMed] [Google Scholar]
- 8.Trouvin A.P., Perrot S. Pain in osteoarthritis. Implications for optimal management. Joint Bone Spine. 2018;85:429–434. doi: 10.1016/j.jbspin.2017.08.002. [DOI] [PubMed] [Google Scholar]
- 9.O’Neill T.W., Mccabe P.S., Mcbeth J. Update on the epidemiology, risk factors and disease outcomes of osteoarthritis. Best Pract. Res. Clin. Rheumatol. 2018;32:312–326. doi: 10.1016/j.berh.2018.10.007. [DOI] [PubMed] [Google Scholar]
- 10.Prieto-Alhambra D., Judge A., Javaid M.K., Cooper C., Diez-Perez A., Arden N.K. Incidence and risk factors for clinically diagnosed knee, hip and hand osteoarthritis: Influences of age, gender and osteoarthritis affecting other joints. Ann. Rheum. Dis. 2014;73:1659–1664. doi: 10.1136/annrheumdis-2013-203355. [DOI] [PMC free article] [PubMed] [Google Scholar]
- 11.Sanchez R.E., Melendez O.E., Alonso P.J., Martin P.S., Turroni S., Marchese L., Villafane J.H. Relationship between the gut microbiome and osteoarthritis pain: Review of the literature. Nutrients. 2021;13:716. doi: 10.3390/nu13030716. [DOI] [PMC free article] [PubMed] [Google Scholar]
- 12.Vina E.R., Kwoh C.K. Epidemiology of osteoarthritis: Literature update. Curr. Opin. Rheumatol. 2018;30:160–167. doi: 10.1097/BOR.0000000000000479. [DOI] [PMC free article] [PubMed] [Google Scholar]
- 13.Holmqvist M.E., Neovius M., Eriksson J., Mantel A., Wallberg-Jonsson S., Jacobsson L.T., Askling J. Risk of venous thromboembolism in patients with rheumatoid arthritis and association with disease duration and hospitalization. JAMA. 2012;308:1350–1356. doi: 10.1001/2012.jama.11741. [DOI] [PubMed] [Google Scholar]
- 14.Bacani A.K., Gabriel S.E., Crowson C.S., Heit J.A., Matteson E.L. Noncardiac vascular disease in rheumatoid arthritis: Increase in venous thromboembolic events? Arthritis Rheum. 2012;64:53–61. doi: 10.1002/art.33322. [DOI] [PMC free article] [PubMed] [Google Scholar]
- 15.Ketfi C., Boutigny A., Mohamedi N., Bouajil S., Magnan B., Amah G., Dillinger J.G. Risk of venous thromboembolism in rheumatoid arthritis. Jt. Bone Spine. 2021;88:105122. doi: 10.1016/j.jbspin.2020.105122. [DOI] [PubMed] [Google Scholar]
- 16.Chung W.S., Peng C.L., Lin C.L., Chang Y.J., Chen Y.F., Chiang J.Y., Sung F.C., Kao C.H. Rheumatoid arthritis increases the risk of deep vein thrombosis and pulmonary thromboembolism: A nationwide cohort study. Ann. Rheum. Dis. 2014;73:1774–1780. doi: 10.1136/annrheumdis-2013-203380. [DOI] [PubMed] [Google Scholar]
- 17.Li L., Lu N., Avina-Galindo A.M., Zheng Y., Lacaille D., Esdaile J.M., Choi H.K., Avina-Zubieta J.A. The risk and trend of pulmonary embolism and deep vein thrombosis in rheumatoid arthritis: A general population-based study. Rheumatology. 2021;60:188–195. doi: 10.1093/rheumatology/keaa262. [DOI] [PMC free article] [PubMed] [Google Scholar]
- 18.Zeng C., Bennell K., Yang Z., Nguyen U., Lu N., Wei J., Lei G., Zhang Y. Risk of venous thromboembolism in knee, hip and hand osteoarthritis: A general population-based cohort study. Ann. Rheum. Dis. 2020;79:1616–1624. doi: 10.1136/annrheumdis-2020-217782. [DOI] [PMC free article] [PubMed] [Google Scholar]
- 19.Deo R.C. Machine learning in medicine. Circulation. 2015;132:1920–1930. doi: 10.1161/CIRCULATIONAHA.115.001593. [DOI] [PMC free article] [PubMed] [Google Scholar]
- 20.Association T.J.S.B., Wang K. Guidelines for the diagnosis and treatment of osteoarthritis (2018 edition) Chin. J. Orthop. 2018;38:705–715. [Google Scholar]
- 21.Jiang T., Yao Y., Xu X., Song K., Pan P., Chen D., Xu Z., Dai J., Qin J., Shi D., et al. Prevalence and risk factors of preoperative deep vein thrombosis in patients with end-stage knee osteoarthritis. Ann. Vasc. Surg. 2020;64:175–180. doi: 10.1016/j.avsg.2019.08.089. [DOI] [PubMed] [Google Scholar]
- 22.O’Brien M.S., Mcdougall J.J. Age and frailty as risk factors for the development of osteoarthritis. Mech. Ageing Dev. 2019;180:21–28. doi: 10.1016/j.mad.2019.03.003. [DOI] [PubMed] [Google Scholar]
- 23.Chen W.H., Tsai W.C., Wang H.T., Wang C.H., Tseng Y.T. Can early rehabilitation after osteoarthritis reduce knee and hip arthroplasty risk?: A national representative cohort study. Medicine. 2019;98:e15723. doi: 10.1097/MD.0000000000015723. [DOI] [PMC free article] [PubMed] [Google Scholar]
- 24.Badillo S., Banfai B., Birzele F., Davydov I.I., Hutchinson L., Kam-Thong T., Siebourg-Polster J., Steiert B., Zhang J.D. An introduction to machine learning. Clin. Pharmacol. Ther. 2020;107:871–885. doi: 10.1002/cpt.1796. [DOI] [PMC free article] [PubMed] [Google Scholar]
- 25.Helm J.M., Swiergosz A.M., Haeberle H.S., Karnuta J.M., Schaffer J.L., Krebs V.E., Spitzer A.I., Ramkumar P.N. Machine learning and artificial intelligence: Definitions, applications, and future directions. Curr. Rev. Musculoskelet. Med. 2020;13:69–76. doi: 10.1007/s12178-020-09600-8. [DOI] [PMC free article] [PubMed] [Google Scholar]
- 26.Haeberle H.S., Helm J.M., Navarro S.M., Karnuta J.M., Schaffer J.L., Callaghan J.J., Mont M.A., Kamath A.F., Krebs V.E., Ramkumar P.N. Artificial intelligence and machine learning in lower extremity arthroplasty: A review. J. Arthroplast. 2019;34:2201–2203. doi: 10.1016/j.arth.2019.05.055. [DOI] [PubMed] [Google Scholar]
- 27.Lu Y., Khazi Z.M., Agarwalla A., Forsythe B., Taunton M.J. Development of a machine learning algorithm to predict nonroutine discharge following unicompartmental knee arthroplasty. J. Arthroplast. 2021;36:1568–1576. doi: 10.1016/j.arth.2020.12.003. [DOI] [PubMed] [Google Scholar]
- 28.Kunze K.N., Polce E.M., Sadauskas A.J., Levine B.R. Development of machine learning algorithms to predict patient dissatisfaction after primary total knee arthroplasty. J. Arthroplast. 2020;35:3117–3122. doi: 10.1016/j.arth.2020.05.061. [DOI] [PubMed] [Google Scholar]
Associated Data
This section collects any data citations, data availability statements, or supplementary materials included in this article.
Data Availability Statement
The authors confirm that all data underlying the findings are fully available and can be obtained after submitting a request to the corresponding author.


