

SUMMARY
The underpinnings of cancer metastasis remain poorly understood, in part due to a lack of tools for probing their emergence at high resolution. Here we present macsGESTALT, an inducible CRISPR-Cas9-based lineage recorder with highly efficient single-cell capture of both transcriptional and phylogenetic information. Applying macsGESTALT to a mouse model of metastatic pancreatic cancer, we recover ~380,000 CRISPR target sites and reconstruct dissemination of ~28,000 single cells across multiple metastatic sites. We find that cells occupy a continuum of epithelial-to-mesenchymal transition (EMT) states. Metastatic potential peaks in rare, late-hybrid EMT states, which are aggressively selected from a predominately epithelial ancestral pool. The gene signatures of these late-hybrid EMT states are predictive of reduced survival in both human pancreatic and lung cancer patients, highlighting their relevance to clinical disease progression. Finally, we observe evidence for in vivo propagation of S100 family gene expression across clonally distinct metastatic subpopulations.
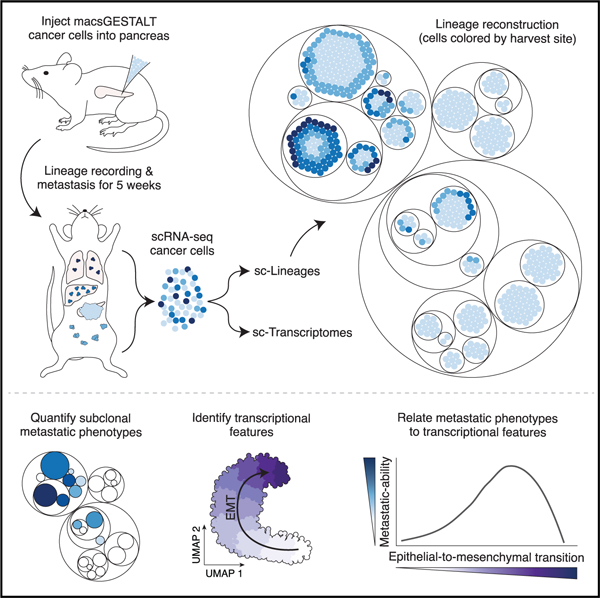
Graphical abstract
In brief
Simeonov et al. develop an inducible lineage recorder, enabling simultaneous capture of lineages and transcriptomes from single cells. Lineage reconstruction in a metastatic pancreatic cancer model reveals extensive bottlenecking and subpopulation signaling, as well as specific transcriptional states associated with metastatic aggression and predictive of worse outcomes in human cancer.
INTRODUCTION
The vast majority of cancer deaths are due to metastasis, a process that transforms a localized, often curable lesion into a systemic, largely incurable disease (Hunter et al., 2018; Turajlic and Swanton 2016). Recurrent genetic drivers of metastasis have proven elusive, suggesting that other levels of dysregulation may principally drive the phenomenon (Hunter et al., 2018). Phylogenetic histories of cancer progression in individual patients, e.g., based on analyses of copy number variation (CNV) or somatic mutation, can inform how the cells comprising metastases are related to the primary tumor, as well as to one another (Naxerova and Jain 2015). However, such methods are restricted to natural genetic diversity and additionally fail to concomitantly capture the molecular phenotype of each profiled cell, limiting what can be learned about the cellular programs that underlie the development and success of distinct metastatic clones. Some alternatives to retrospective phylogenetic approaches are traditional prospective lineage tracing methods, such as lentiviral barcoding, which involves tagging cells with unique DNA barcodes (Lu et al., 2011). However, such “static” barcoding strategies are generally restricted to introducing labeling diversity in vitro and at a single time point. Therefore, they are unable to capture critical in vivo processes, including any selection of intraclonal genetic or epigenetic heterogeneity emerging after the point of labeling.
Beginning with GESTALT (genome editing of synthetic target arrays for lineage tracing) (McKenna et al., 2016), a new paradigm for in vivo lineage tracing has emerged, employing CRISPR-Cas9 to progressively and stochastically mutagenize a compact, genomically integrated barcode, thereby producing patterns of edits that can be used to reconstruct phylogenetic relationships among cells (McKenna and Gagnon 2019). Such methods can be coupled to single-cell RNA sequencing (scRNA-seq) to explicitly relate cell lineage histories to transcriptional states (Raj et al., 2018; Spanjaard et al., 2018; Chan et al., 2019). Until recently, GESTALT and related methods have primarily been applied to early development, e.g., by injection of components into zygotes and subsequent profiling of edited barcodes and single-cell transcriptomes from the resulting organism (Bowling et al., 2020; Quinn et al., 2021). This strategy is fundamentally difficult to translate across biological systems as it requires specialized injection and titration. Furthermore, as components are neither integrated nor inducible, such systems are not amenable to longer-term or time-delayed studies in adult animals. However, with refinement, CRISPR-Cas9-based lineage tracers hold potential to be useful in contexts outside of early development, such as the study of somatic stem cell dynamics or cancer metastasis.
RESULTS
An inducible lineage recorder with scRNA-seq readout
To this end, we developed macsGESTALT (multiplexed, activatable, clonal and subclonal GESTALT), an integrated, inducible, and scalable method that can be easily adapted to any engineerable mammalian system to enable lineage tracing (Figure 1). Our approach consists of three components (Figure 1A):
Figure 1. macsGESTALT for high-resolution lineage tracing.

(A) Genetic components of macsGESTALT.
(B) Clone-level information is stored in static barcodes, while subclonal phylogenetic information is dynamically encoded into evolving barcodes via insertions and deletions (indels, blue and red bars) induced by doxycycline.
(C) Two example clones from a population with n clones, each with a random number of integrated barcodes. Evolving barcode edits are encoded and inherited as cells divide.
(D) Generation of a macsGESTALT barcoded population of cells and experimental workflow.
(E) macsGESTALT analysis workflow. Dox, doxycycline; rtTA, reverse tetracycline transactivator; TRE, tetracycline-responsive element.
See also Figures S1 and S2.
Each cell contains multiple unique barcode integrations. Barcodes are constitutively expressed within the 3′ untranslated region of a polyadenylated pac (puromycin N-acetyl-transferase) transcript, enabling sequencing via standard mRNA-based capture. Each barcode is a combination of a static 10 bp sequence of random bases, used for clonal reconstruction, and a 250 bp editable, evolving region composed of five CRISPR target sites, used for phylogenetic reconstruction (Figures 1B–1E).
The evolving region is targeted by an array of five guide RNAs (gRNAs), separated by transfer RNA (tRNA) spacers, under a single constitutive mammalian U6 promoter. Upon transcription, tRNAs are excised from the array by endogenous RNases P and Z, releasing the individual gRNAs (Port and Bullock 2016). We selected this configuration from a screen of five different arrays, ranging from least compact to most compact (Figures S1A–S1G). The gRNA-tRNA array (Figure S1E) outperformed other compact configurations (Figures S1F and S1G) and performed similar to the standard approach of placing each gRNA under its own U6 promoter (Figure S1D). Therefore, we selected the gRNA-tRNA configuration for its robust editing and compact size, allowing for easy transfer to different vectors or promoters, consistent with our goals of creating an adaptable and broadly applicable system. These results also illustrate the usefulness of a tRNA spacing strategy for gRNA multiplexing in mammalian systems.
Cas9 expression and barcode editing are induced by doxycycline (dox) binding to a constitutive reverse tetracycline transactivator and activating a tetracycline-responsive element promoter (Cao et al., 2016). Inducible barcode editing in vitro was robustly driven with limited leakiness, mostly confined to the first target site (Figures S1H–S1K). We also validated successful barcode recovery and clonal reconstruction in two independent experiments, each involving limiting dilution, expansion, and single-cell sequencing (Figures S1L–S1P).
Aggressive clones are rare and transcriptionally divergent
We next set out to investigate cancer metastasis at high resolution by combining macsGESTALT and scRNA-seq (Raj et al., 2018; Chan et al., 2019). We focused on pancreatic ductal adenocarcinoma (PDAC), which has a 5-year survival rate of 9%, the lowest of any major cancer (Cancer Facts and Figures, n.d.). Furthermore, 90% of PDAC patients have some dissemination at the time of diagnosis (Cancer Facts and Figures, n.d.). To study PDAC metastasis, we employed a commonly used model, where cells from KPCY (LSL-KrasG12D/+; Trp53LSL-R172H/+; Pdx1-cre; LSL-Rosa26YFP/YFP) mouse tumors (Hingorani et al., 2005; Rhim et al., 2012; Li et al., 2018) are orthotopically transplanted into the pancreata of non-tumor-bearing mice (Rhim et al., 2012; Aiello et al. 2016). This approach presents highly consistent growth and metastasis kinetics and seeding patterns, and furthermore faithfully models human disease, due to the following: (1) Kras gain of function and p53 loss of function are the most common drivers of human PDAC (Cancer Genome Atlas Research Network, 2017); (2) cells experience minimal time in vitro—a drawback of traditional cell lines; and (3) a focal lesion develops in the pancreas that (4) disseminates to the same sites as human PDAC, including the liver and lung.
To investigate PDAC metastasis and associated transcriptional states, we selected a highly metastatic line from a library of characterized PDAC lines derived from KPCY tumors (Li et al., 2018) (STAR Methods). To enable lineage tracing of these cells, we introduced dox-inducible Cas9 and the gRNA array through lentiviral transduction, and separately introduced multiplexed barcodes via PiggyBac-transposition, thereby producing macsGESTALT PDAC cells (Figures 1D and 2A). To model cancer metastasis in vivo, we injected mouse pancreata with 30,000 macsGESTALT PDAC cells, representing thousands of static barcode clones (Figure 2A; STAR Methods). After 1 week of engraftment, we administered dox in the drinking water to initiate lineage tracing. As expected, all mice were morbid at 5 weeks post-injection (Aiello et al. 2016). We randomly selected two mice, M1 and M2, and harvested cells from six cancer-bearing sites: primary tumor, liver, lung, peritoneal metastases (mets), surgical-site met (a peritoneal met forming at the peritoneal surgical incision site), and circulating tumor cells (STAR Methods). PDAC cells were fluorescence sorted and processed for scRNA-seq of transcriptomes and macsGESTALT barcodes.
Figure 2. Most metastases arise from rare, transcriptionally distinct clones.

(A) Schematic of metastasis lineage tracing model.
(B) Clonal reconstruction using static barcodes, where clones are numbered by size in the primary tumor. Percentage contribution to each harvest site (circle size) and enrichment compared with the primary tumor (circle color) are visualized. Top annotations show each clone’s Leiden transcriptional cluster and aggression assignments as in (H) and (I), respectively.
(C) Cumulative fraction of each clone in each disseminated site (red) and primary tumor (black). Dotted lines represent the theoretical scenario of perfect clone size equality.
(D) UMAP plot of 28,028 single cells containing both lineage and transcriptional information. Cells are colored by clone, with select large clones highlighted (as mouse.clone).
(E and F) Two representative non-aggressive clones. (E) M1.13, (F) M2.10.
(G) A representative clone of medium aggression.
(H) Leiden transcriptional clustering of (D).
(I) Cells colored by clonal aggression.
(J) Number of non-, mid-, or high-aggression clones of 95 total.
See also Figures S3 and S4.
Overall, 89% of transcriptomes had corresponding clonal lineage information for M1 and 77% for M2, demonstrating improved barcode recovery using macsGESTALT compared with prior methods (Raj et al., 2018; Bowling et al., 2020). Notably, we observed a positive correlation between the recovery of a cell’s transcriptomic RNA and the barcode RNA (r = 0.64, p < 2.2 × 10⁻¹⁶) (Figure S2A). While the majority of cells had 10,000–100,000 transcriptome-derived transcripts and 10–100 barcode-derived transcripts, lower-quality cells with low transcriptome recovery (<5,000 transcripts) often had barcode recovery at the limit of detection (one or two transcripts). Cells entirely lacking barcode information appeared to be a natural extension of this trend, as we recovered on average less than half of the overall transcriptomic RNA from these cells relative to those with barcodes recovered (Welch’s t test, p < 2.2 × 10⁻¹⁶) (Figure S2B). Thus, barcode recovery appeared to be a function of cell quality and total RNA recovery rather than resulting from any specific bias or silencing event. With this in mind, we retained only cells with both high-quality transcriptome and barcode information for downstream analyses (Figures S2C–S2K).
In total, across all sites in both mice, we recovered both the transcriptome and the clonal history for 28,028 single cells (M1, 12,657; M2, 15,371) (Figures S2C–S2K). The set of static barcodes defining a clone was determined via hierarchical clustering and custom pipelines (STAR Methods). Cells were then sorted into each clone based on their static barcode sequences, permitting even cells with missing barcodes to be assigned to the appropriate clone while also enabling explicit multiplet detection and filtration and resulting in only ~0.5% unmatched cells (M1, 0.54%, and M2, 0.51%) (Figure S2J). For M1, an average of 3.7 of a possible 5.9 barcodes were recovered per cell, while recovery for M2 was on average 1.7 of a possible 2.5 barcodes (Figure S2J). The lower number of barcodes per cell in M2 likely contributed to its lower overall lineage recovery.
Clonal reconstruction revealed 95 distinct clones across the two mice (Figure 2B), identified by 227 static barcodes (Figure S2J), indicating that less than 1% of all injected clones successfully engraft. In contrast, in vitro experiments using the same cells and a similar time course revealed that most cells (clones) survive and form colonies on plates (Figures S1L–S1P). Thus, cancer cells in this model experience dramatic bottlenecking during in vivo engraftment.
Among the surviving clones, fitness differences were pronounced and shaped population structure across sites (Figures 2B and 2C). In the primary tumor, the majority (>50%) of cells came from a minority of clones (two clones in M1; six clones in M2). Bottlenecking was even more extensive at metastatic sites, wherein 80%–90% of cells typically came from a single clone (Figures 2B and 2C), and both mice had one clearly dominant clone across all disseminated sites (M1.1, M2.2). On the other hand, 51% of clones (48/95) failed to metastasize at all, suggesting that mutations in Kras and p53 alone do not ensure metastatic success.
We next asked whether clones were transcriptionally distinct. Indeed, cells from the same clone clustered together in uniform manifold approximation and projection (UMAP) space (Figure 2D). This was true of both large and small clones (Figures 2D–2G). Importantly, this finding extended to cells harvested from different sites, suggesting that cells retain their clonal transcriptional identity even after dissemination (Figure S3A). These stable transcriptional differences may result from either epigenetic drift or large-scale copy number changes, the latter observed in our data (Figure S3B) and a hallmark of PDAC chromosomal instability (Campbell et al., 2010).
Finally, we asked whether differences in clonal behavior corresponded to transcriptional differences. While clones had distinct transcriptional identities, we found that many overlapped in UMAP space (Figures 2D–2G). Furthermore, 81% of clones (77/95 across both mice) primarily resided in a single transcriptional cluster, cluster 3 (Figures 2B and 2H). To relate transcriptional state to tumor aggression, we derived a clonal aggression scoring system based on clone size and dissemination (Figure 2B; STAR Methods). We found that 85% (81/95) of clones were non-aggressive and were transcriptionally similar, occupying a small region of cluster 3 (Figures 2I and 2J). Conversely, highly aggressive clones were exceedingly rare but transcriptionally divergent from other clones and one another (Figure 2I).
An EMT continuum associated with aggression
We sought to understand the specific transcriptional programs associated with clonal aggression. While both mice were strikingly similar in terms of clonal composition (Figure 2B), we initially focused on M1, since we harvested cells from more sites and recovered over twice as many barcodes per cell, which permits more effective downstream subclonal reconstruction (Figures S2J and S2K). Reanalyzing the M1 data apart from M2, non-aggressive clones again appeared transcriptionally similar to one another (Figure 3A). Interestingly, these clones were enriched for expression of canonical epithelial markers, such as Epcam, Muc1, and Cdh1 (Figures 3B–3D and S4A). Conversely, mesenchymal markers, such as Sparc, Zeb2, and Col3a1, were enriched in cells of the aggressive clone, M1.1 (Figures 3E–3G and S4B). Loss of epithelial genes and gain of mesenchymal genes are defining hallmarks of epithelial-to-mesenchymal transition (EMT) (Nieto 2013; Nieto et al., 2016).
Figure 3. A transcriptional EMT continuum in vivo.

(A) UMAP plot of M1, colored by clone, with the five largest clones annotated. Circled region indicates the transcriptional space where smaller, non-aggressive clones reside.
(B–G) Expression of canonical epithelial (B, Epcam; C, Muc1; D, Cdh1) and mesenchymal (E, Sparc; F, Zeb2; G, Col3a1) markers.
(H) Unbiased trajectory inference revealing a pseudotime axis matching EMT (pseudoEMT).
(I) Expression of (B–G) plotted along pseudoEMT and colored by clone as in (A).
(J) Hierarchical clustering of kinetic curves for the top 3,000 differentially expressed genes across pseudoEMT (q = 0, Moran’s I > 0.1). Gene clusters are labeled from epithelial, E, to hybrid, H1–H4, to mesenchymal, M, based on expression across pseudoEMT. Gene set analysis using MSigDB Hallmarks for each gene cluster (hypergeometric test, p < 0.05). Oxphos, oxidative phosphorylation.
(K) Significantly enriched motifs (hypergeometric test, p < 0.05) in promoters for each gene cluster, with canonical EMT master regulators highlighted.
EMT is a process of transdifferentiation, wherein epithelial cells lose the properties of cell polarity and adhesion, while gaining the ability to be motile and migratory. In cancer, EMT is implicated in invasion, metastasis, tumor stemness, plasticity, and drug resistance (Nieto 2013; Nieto et al., 2016). EMT is primarily a transcriptional process mediated by a group of key master-regulator transcription factors (EMT-TFs) (Stemmler et al., 2019). We observed elevated expression in aggressive clones of 4/5 EMT-TFs, namely Zeb1, Zeb2, Snai1, and Snai2 (Figures 3F and S4C). Expression of Prrx1, an important regulator of EMT in PDAC (Takano et al., 2016), was also increased.
Traditionally, EMT is considered a binary process, where cells switch from fully epithelial to fully mesenchymal. However, recent studies have reported discrete intermediate EMT states (Lu et al., 2013; Zhang et al., 2014; Hong et al., 2015; Pastushenko et al., 2018; Pastushenko and Blanpain 2019) or even a continuum of states (Dijk et al., 2018; McFaline-Figueroa et al., 2019). In our data, epithelial and mesenchymal UMAP regions were not well segregated. Specifically, epithelial and mesenchymal genes appeared to gradually lose and gain expression as a function of distance from two extremes (Figures 3B–3G), supporting the view that a continuum of EMT states exists in vivo.
We leveraged our single-cell data to explore the transcriptional correlates of EMT as a continuum. We performed unbiased trajectory inference using Monocle 3 (Cao et al., 2019) and found that the main trajectory in our data corresponded to the observed EMT gene expression axis (Figure 3H). We named this trajectory “pseudoEMT” (akin to pseudotime for developmental trajectories) and placed the root of the trajectory, or the zero EMT state, at the most epithelial transcriptional region (Figure 3H). Hence, the expression of canonical epithelial markers was highest at the root. We found that many genes, including known epithelial or mesenchymal markers, rise and fall at different rates across pseudoEMT (Figures 3I and S4E–S4G); for example, many extracellular matrix genes activate only very late in the trajectory (Figures 3I and S4F). In addition, numerous genes, such as Cd44 or Inhba, displayed unusual patterns, rising and then falling or plateauing (Figure S4H). Expression of surface markers previously used to stratify different EMT states in skin and breast cancer mouse models, Epcam, Vcam1 (CD106), Itgav (CD51), and Itgb3 (CD61) (Pastushenko et al., 2018), followed a similar pattern in our data (Figure S4D). However, except for Epcam, expression of these markers was not highly variable across the EMT continuum (Figure S4I), suggesting that at least in PDAC, other genes might be more suitable markers for stratification.
Plotting cells along pseudoEMT highlighted that smaller, non-aggressive clones reside on the epithelial extreme, while more mesenchymal states are restricted to large, aggressive clones, such as M1.2 and particularly M1.1 (Figure 3I). As 27 of 29 clones were highly epithelial, we suspected this to be the default transcriptional state. To investigate this, we applied scRNA-seq on 5,932 in vitro cultured cells. We found that these cells comprised 40 distinct clones, none of which overlapped with any clones recovered from in vivo metastasis experiments. In vitro cells clustered homogeneously together and away from M1 cells (Figures S5A and S5B) and had distinct markers from in vivo cells at large (Figures S5C and S5G and Table S1). With regard to EMT, in vitro cells were strikingly epithelial, often displaying higher expression of epithelial markers, such as Muc1 and various keratins (Figures S5D, S5E, and S5H), and conversely even lower expression of mesenchymal markers, such as Zeb2, Vim, and Fn1 (Figures S5F and S5I), compared with the highly epithelial clones of M1. Thus, the baseline state of these PDAC cells appears to be highly epithelial with more mesenchymal EMT states appearing only in vivo, as in M1.1 and M1.2.
To systematically characterize gene expression along EMT in vivo, we identified the top 3,000 significantly differentially expressed genes across pseudoEMT (q ~ 0, Moran’s I > 0.1) (Table S2). Hierarchical clustering of genes revealed six gene sets with similar kinetics (Figure 3J). We classified these sets from most epithelial to most mesenchymal as follows: epithelial (E); hybrid 1, 2, 3, and 4 (H1, H2, H3, H4); and mesenchymal (M) (Figure 3J; Table S2). We then performed hypergeometric gene set enrichment using the Molecular Signatures Database (MSigDB) Hallmark gene sets, which represent well-defined biological states and processes (Figure 3J; Table S2). Concordant with the pseudoEMT trajectory, gene set enrichment indicated an EMT process. Early clusters (E, H1) were enriched for apical surface genes, consistent with epithelial cell polarity, while late clusters showed gradually increased enrichment for EMT (H4, p = 3 × 10⁻⁶; M, p=3 × 10⁻²⁹). An inducer of EMT and metastasis, TGF-β signaling (Zavadil and Böttinger 2005; Nieto et al., 2016; Aiello et al., 2018), as well as Jak/Stat3 and Stat5 signaling (Liu et al., 2014), peaked in the late hybrid state (H4) and tapered off in the highly mesenchymal state (M). Other pathways purported to be involved in EMT, such as TNF-α (Wang et al., 2013), Wnt (Kim et al. 2002; Basu et al., 2018), and Hedgehog (Zhang et al. 2016), were also enriched only in H4 or M. Interestingly, Notch signaling was recently implicated as a hybrid-EMT stabilizer (Boareto et al., 2016; Bocci et al., 2017), consistent with our finding that it was enriched only in H4.
Striking metabolic gene expression changes across EMT were also apparent (Figure 3J). Transitioning from early (H1, H2) to late (H3, H4) hybrid gene clusters, we observed a strong shift from enrichment of oxidative phosphorylation toward glycolysis, potentially related to the enrichment of mTOR signaling in H2 (Ramanathan and Schreiber 2009). Consistent with metabolic shifts, hybrid-EMT states also were highly enriched for proliferative gene sets, such as G2M, E2F, and mitotic spindle. Specifically, enrichment began modestly in H2 and peaked dramatically in H3 (G2M: H2, p = 3 × 10⁻²; H3, p = 1 × 10⁻²⁰). We next determined the cell-cycle phase of each cell (G1, G2M, or S) to estimate the proportion of actively dividing cells (S/G2M) across pseudoEMT (STAR Methods). Consistent with Hallmark gene set enrichment, cell cycling peaked at EMT regions representing the E and H2/H3 gene clusters (Figure S4J). These hybrid-EMT proliferative changes were potentially driven by Myc (Gabay et al. 2014), as Myc targets mirrored proliferative gene set enrichment and cell cycling fraction (Myc-v1: H2, p=1 × 10⁻³; H3, p = 1 × 10⁻³⁰).
We next asked which TFs might regulate progression through EMT. Applying HOMER (Heinz et al., 2010) to promoters, we detected 45 significantly enriched DNA-motif binding factors across all gene clusters (Figure 3K). EMT master regulators, Zeb1, Zeb2, Snai1, and Snai2, were enriched in early clusters, E and H1. As EMT-TFs are primarily transcriptional repressors that downregulate epithelial genes (Stemmler et al., 2019), this finding illustrates our ability to discover regulators of the EMT continuum. ETS-domain TFs, which are associated with metastasis, invasion, and EMT (Hsu et al. 2004; Sizemore et al., 2017), dominated the enrichment profiles of hybrid states H2 and H3. Motifs bound by members of the Sox and Fox families were enriched in H4 and M, respectively. Sox TFs are often associated with stemness-related processes (Grimm et al., 2019). Notably, the six gene clusters have no overlapping genes, yet adjacent clusters often displayed overlapping TF and gene set enrichment, lending further support for a gradual continuum of EMT transitions (Figures 3J and 3K). Overall, across this continuum of 3,000 genes, we describe many classic EMT markers, pathways, and regulators, but we also find many less well-characterized genes and processes of potential interest for furthering understanding of EMT in vivo (Table S2). In addition, we performed a traditional Leiden clustering of M1 and found clusters roughly matching the pseudoEMT spectrum (Figure S5J). We identified the top markers by both cluster and clone, finding that cluster markers were consistent with genes enriched across corresponding EMT states (Table S3).
Reconstruction of subclonal diversity arising in vivo
Most cells in the mid-to-late EMT continuum came from a single dominant clone, M1.1, preventing us from precisely correlating transcriptional processes with tumor aggression and highlighting the limitations of static barcoding (Figure 3I). We therefore leveraged editing patterns of macsGESTALT evolving barcodes to more precisely relate EMT and aggression at the subclonal level.
We recovered a large number of edited and informative target sites per cell, conducive to phylogenetic analysis. Altogether, we recovered 384,870 CRISPR target sites, of which 96% were edited (Figure S6A). Editing was distributed across the length of the barcodes with peaks at the expected Cas9 cut sites, 3 bp upstream of the protospacer adjacent motif (PAM) of each target site (Figure 4A). Deletions predominated over insertions, as expected (McKenna et al., 2016; Raj et al., 2018; Bowling et al., 2020), with an approximately equal number of single- and multi-target deletions (Figures 4B and S6B). The average edit size varied by edit type, with 11 bp for insertions, 18 bp for single-target deletions, and 80 bp for multi-target deletions (Figure S6C). Multi-target deletions were of a large size range and involved 2, 3, 4, or 5 target sites at frequencies ranging from 10% to 19% (Figures S6B and S6C). Individual target-site editing rates varied between 89% and 99% (Figure 4B). On average, we recovered 18.5 target sites (3.7 barcodes) per cell for M1 and 8.5 (1.7) for M2 (Figure S2J).
Figure 4. High-resolution subclonal lineage reconstruction of metastatic cancer.

(A) Percentage at which each base is mutated in 76,974 evolving barcodes across both mice. Target-site spacers (light gray) and PAMs (dark gray).
(B) Edit types observed at each target site.
(C) Example phylogenetic reconstruction of a small clade within clone M1.1. Clade M1.1.310 (root node in red) contains six distinct subclones composed of 58 cells from five different harvest sites. Each cell in this clade has six evolving barcodes, illustrated by white bars with edits colored as in (B). Cells with the same barcode editing pattern are grouped into a subclone (terminal black nodes) and dissemination (EH) is quantified. For each subclone, individual cells are stacked and colored by their harvest site on the far right.
(D) Circle packing plot of the full single-cell phylogeny of M1, with clade M1.1.310 from (C) circled in red. Outermost circles define clones, with the first six clones labeled. Within each clone, nested circles group increasingly related cells. Innermost circles contain cells from reconstructed subclones. Each point represents a single cell, colored by harvest site.
(E) Cumulative fraction of each subclone of clone M1.1 in each harvest site. Dotted line represents perfect subclone-size equality.
See also Figure S3.
Intraclonal tree reconstruction was performed in three main steps (Figure 4C). First, different barcodes from the same cell were concatenated based on their static barcodes into a “barcode-of-barcodes,” which contains all of the phylogenetic information recovered for that cell. Second, cells with identically edited barcodes-of-barcodes were grouped into subclones, since they are indistinguishably close relatives. Third, phylogenetic relationships between subclones were reconstructed based on edit inheritance patterns (Figure 4C). Subclonal metastatic aggression was quantified via Shannon’s equitability (EH), a statistical measure of dissemination across harvest sites (STAR Methods). For example, a subclone found at only one harvest site is not metastatically aggressive and has an EH of zero.
We sought to understand the maximum number of cells that could be uniquely tagged using our approach. With this in mind, we first investigated the editing diversity of individual barcode integrants (Figure S6D). Examining 208 barcodes across both mice, we found that the maximum number of unique editing outcomes for a barcode scaled with the number of cells recovered, but gradually peaked to around 400 unique outcomes even for barcodes recovered in nearly 10,000 cells. Hence, in these experiments where we recovered an average of 2.6 barcodes per cell, we can estimate maximum labeling at nearly 109 cells (400 editing outcomes ^ 2.6 barcodes * 95 clones).
In practice, we sampled a fraction of this theoretical space and recovered 6,055 unique barcodes-of-barcodes, which, for efficient phylogenetic reconstruction, we filtered to a total of 1,692 subclones, each with at least two cells for larger clones (≥50 cells) or with any number of cells for smaller clones (Figure S6A; STAR Methods). Due to a higher average number of barcode integrations per cell, M1 displayed greater reconstructive power than M2. This was particularly apparent in the dominant clone of each mouse, where M1.1 with seven barcode integrants had 601 subclones compared with M2.2 with only two integrants and 110 resulting subclones. Notably, pairwise phylogenetic distances in the reconstructed trees were strongly concordant with the corresponding edit distances between barcode-of-barcodes alleles (Figure S6E), and more active target sites determined earlier tree nodes (Figure S6F), suggesting that lineage relationships between cells are accurately captured in our trees.
The full clonal and subclonal phylogenetic visualization of M1 data highlights the overwhelming proliferative and metastatic dominance of clone M1.1 (Figures 4D and S6G). However, within M1.1, we also observed vast heterogeneity with respect to subclonal aggression and metastatic success. Most strikingly, the same bottlenecking observed on the clonal level was also present on the subclonal level within M1.1 (Figure 4E). Subclonal bottlenecking further increased at metastatic sites, again mirroring observations at the clonal level. Thus, cancer progression appears to be defined by a state of constant selection, separate from the effects of engraftment.
Late-hybrid EMT states are proliferatively and metastatically advantageous
As the vast majority of EMT diversity was within M1.1 (Figure 3I), we leveraged phylogenetic data to understand how this range of intraclonal EMT states may relate to differences in subclonal behavior. We calculated the mean pseudoEMT value for each subclone and plotted this and subclonal dissemination (EH) for clone M1.1 (Figures 5A and 5B). While M1.1 was highly mesenchymal compared with other M1 clones, many subclones within M1.1 were actually quite epithelial. These epithelial subclones were primarily small and non-metastatic (Figures 5A and 5B). Interestingly, the same was true of highly mesenchymal subclones. On the other hand, the largest and most disseminated subclones appeared to express hybrid EMT states (Figures 5A and 5B), providing direct evidence that EMT extremes are less metastatic than hybrid states (Jolly et al., 2015; Nieto et al., 2016; Lambert et al. 2017; Pastushenko and Blanpain 2019).
Figure 5. Peak metastatic aggression corresponds to late-hybrid EMT states.

(A and B) Circle packing plots of the phylogenetic structure of clone M1.1 with subclones colored by mean pseudoEMT (A) and by dissemination score (B).
(C) Relationship between metastatic dissemination and pseudoEMT for subclones from (A and B).
(D) Density along pseudoEMT of M1.1 cells and their increasingly ancestral (arrow) phylogenetic groupings, examples of which are highlighted in (A).
(E) Relationship between PDAC patient survival (TCGA-PAAD, n = 173) and patient enrichment scores for each pseudoEMT gene cluster using Cox regression analysis, with the hazard ratio for each gene cluster displayed (*p < 0.05, •p < 0.1). Square sizes are inversely proportional to p value.
See also Table S4.
To precisely characterize where aggression peaked along the EMT continuum, we mapped subclonal dissemination (EH) and size along pseudoEMT (Figure 5C). We found that dissemination gradually peaked around the H3 and H4 hybrid states (pseudoEMT score of 20–22) and then sharply declined at highly mesenchymal states. Thus, late-hybrid EMT states are metastatically advantageous and are associated with specific proliferative, metabolic, and signaling processes (Figure 3J and Table S2), as well as distinct regulatory binding factors (Figure 3K).
Notably, hybrid-EMT states appeared transcriptionally stable; for example, a large, hybrid subclone often had close relatives that were also large and hybrid (Figure 5A). To understand the stability of EMT states, we plotted the distribution of cells, subclones, and root clades along pseudoEMT (Figure 5D; STAR Methods). Root clades mark the first phylogenetic subdivision within a clone and are hence an older subgrouping of cells than a subclone. Examples of root clades and subclones are highlighted in Figure 5A. Root clades exist at the time of dox initiation (1 week post-orthotopic transplant), cells exist at the time of harvest, and subclones in between; thereby we compared different “levels” of ancestral groups. Moving from root clades to cells, there was a shift from epithelial to hybrid states, suggesting that while epithelial states are the prevailing ancestral default, they are proliferatively and metastatically disadvantaged compared with hybrid states (Figure 5D). This intraclonal observation again mirrored findings at the interclonal level, where M1.1 itself was dominant compared with all other clones, which were generally highly epithelial. Therefore, ongoing natural selection of rare, late-hybrid EMT states over predominating epithelial states both permits rapid dissemination and forces continuous clonal and subclonal bottlenecking.
As late-hybrid EMT states, namely the H3 and H4 gene clusters, were profoundly associated with metastasis in our model, we asked whether a similar trend might exist in human PDAC (Figure 5E). Using The Cancer Genome Atlas (TCGA) matched gene expression and clinical data, we found that the transcriptional signature of the E, H1, and H2 gene clusters had no association with disease prognosis. However, patients enriched for the H3 or H4 transcriptional signature had a significantly increased risk of death, and this risk disappeared for the highly mesenchymal cluster M (Figure 5E). Remarkably, these human PDAC findings faithfully mirror the rise and fall of subclonal metastatic aggression along pseudoEMT in our model (Figure 5C).
As EMT is thought to play a role across many cancer types (Nieto et al., 2016), we also examined whether our pseudoEMT gene sets might predict survival in the other prevalent cancers by mortality (Cancer Facts and Figures, n.d.): lung, colorectal, breast, and prostate cancer. While colorectal, breast, and prostate cancers were not significantly associated in either direction with our PDAC-derived pseudoEMT gene sets, lung cancer displayed a pattern similar to that of PDAC (Table S4). Lung cancer patients enriched for H4 had significantly worse overall survival, while those enriched for M again trended toward better overall survival. In summary, these findings highlight the clinical relevance of late-hybrid states and emphasize the potential cancer-specific nature of EMT.
Evidence for interclonal propagation of S100 gene expression
We also examined the lineage and transcriptional structure of M2, which overall appeared strikingly similar to M1 (Figures 6A, 6B versus 3A, and S6G). As in M1, labeling the transcriptional UMAP of M2 by clone highlighted that non-aggressive clones occupy a similar transcriptional region, while rare metastatic clones and one dominant clone occupy divergent transcriptional regions (Figures 6B and S5K and Table S3). However, due to the lower number of barcode integrants in M2.2 relative to M1.1 and the resulting lower number of subclones reconstructed (Figure 6A versus S6G), we were unable to interrogate the dominant clone of M2 in the same depth as M1.1. We instead broadly asked what genes might be associated with subclonal dissemination (EH) in M2, by performing a regression of EH against single-cell gene expression with adjustment for confounders (STAR Methods). We identified 973 genes positively associated with dissemination and 1,037 negatively associated genes (q < 0.05) (Table S5). Promisingly, as in M1, genes positively associated with subclonal dissemination in M2 also predicted worse overall survival in human PDAC TCGA data (Figure 6C), as well as in human lung cancer, but not in breast, colorectal, and prostate cancer (Table S5).
Figure 6. A process complementary to canonical EMT.

(A) Lineage tree for M2 subclones, where branches and nodes are colored by clone and scaled by the number of cells they relate.
(B) UMAP of M2 cells, colored as in (A), with five large, aggressive clones labeled, as well as M2.1 (green), which was the largest clone in the primary tumor but poorly metastatic. Circled region indicates the transcriptional space where smaller, non-aggressive clones reside.
(C) Relationship between PDAC patient survival (TCGA-PAAD, n = 173) and enrichment scores for genes associated with subclonal dissemination using Cox regression analysis (**p < 0.01), with the hazard ratio displayed. Square sizes are inversely proportional to p value.
(D–H) Canonical epithelial (D, Ocln; E, Epcam; F, Lgals4) and mesenchymal (G, Prrx1; H, Zeb2) markers.
(I and J) Markers with inconsistent expression patterns in the dominant clone, M2.2 (I, Sparc; J, Muc1).
(K) Highly expressed genes ranked by association (q < 0.05) with subclonal dissemination.
(L) Aggregated single-cell gene expression of the S100a family for each clone, colored by aggression (as defined in Figure 2B) and grouped by mouse. Intramouse comparisons between dominant/aggressive clones versus all others are indicated above each violin. Comparisons between mice for all clones (black) and only dominant/aggressive clones (red) are indicated above the line (Welch’s t test, ****p < 0.0001, ***p < 0.001, ns, not significant).
Meanwhile, among the genes most negatively associated with dissemination were canonical epithelial markers, such as Ocln, Epcam, and Lgals4 (Table S5). These epithelial genes presented similar patterns of expression compared with that seen in M1. Adhesion-encoding genes, Ocln and Epcam, were strictly contained to non-aggressive UMAP regions in M2 (Figures 6D and 6E), as they were in M1 (Figures 3B and S4A), while Lgals4 was expressed slightly more broadly, just as it was in M1 (Figures 6F and S5E). Thus, the vast majority of clones in both M1 and M2 were non-metastatic and epithelial in nature. This finding, together with our observation that these cells express epithelial but not mesenchymal markers in vitro (Figures S5D–S5F and S5H–S5I), further indicates that the default state is epithelial, that epithelial markers are repressed in order to metastasize, and that this process is rare.
As in M1, EMT-TFs, Prrx1 and Zeb2, were expressed inverse to epithelial genes (Figures 6G and 6H). However, while most aggressive clones in M2 displayed expression patterns similar to M1 with regard to epithelial and mesenchymal genes, the dominant clone, M2.2, was not entirely consistent with the canonical EMT axis observed in M1 (Figure 3J). Specifically, the mesenchymal marker, Sparc, was expressed to a low extent in non-aggressive regions but also in M2.2 (Figure 6I). Similarly, the epithelial marker Muc1 was highly expressed both in non-aggressive regions and in a large portion of M2.2 cells (Figure 6J). This was particularly apparent when comparing M2.2 to another aggressive clone, M2.23 (Figures 2B and 6B), which displayed more canonical and complete EMT, with high mesenchymal gene expression (Figures 6G–6I) and nearly completely absent epithelial gene expression (Figures 6D–6F and 6J). Indeed when plotted together with M1, M2.23 cells clustered with the more mesenchymal cells of M1.1 (Figure 2D), which may help explain its aggressive but non-dominant phenotype (Figure 2B; STAR Methods).
We sought to better understand the processes that underlie dominance of M2.2 and aggression in M2 more broadly. Thus, we narrowed the genes significantly associated with subclonal dissemination to those that both were highly expressed and had a strong association, leaving 355 genes (Figure 6K; STAR Methods). Among the most negatively associated genes were again epithelial markers, as well as genes such as Ctse, which has been functionally shown to inhibit tumor growth and metastasis (Kawakubo et al., 2007). Conversely, among the most positively associated genes were genes previously found to promote TGF-β signaling, EMT, and metastasis in other cancers, such as Ifitm1, Ifitm3, and Akr1b3, further highlighting the important role EMT plays in promoting metastasis across both M1 and M2 (Yu et al., 2015; Liu et al., 2019; Min et al., 2018; Schwab et al., 2018).
Notably, we found that the S100a gene family was 52-fold overenriched among positively associated genes (hypergeometric test, p = 8 × 10⁻¹⁰) and completely absent from negatively associated genes (Figure 6K). S100 proteins were recently found to be the most abundant and overrepresented secreted factors in PDAC compared with normal pancreas, in both human patients and mouse models (Tian et al., 2019). However, the specific functions of S100s in PDAC and other cancers are poorly characterized. Some S100s, such as S100a4, are thought to promote metastasis via EMT and to directly mediate pseudopodia and lamellipodia formation in order to drive cell migration and invasion (Bresnick et al. 2015; Fei et al., 2017). Interestingly, S100s are considered autocrine, paracrine, and even circulatory long-distance signaling molecules that potentially propagate their own expression and coordinate changes in the tumor and the microenvironment both locally and systemically (Bresnick et al. 2015). However, studies have primarily focused on S100 signaling in the tumor microenvironment and have not assessed how signaling spreads across different tumor subpopulations.
We leveraged our coupled lineage and transcriptional data across 95 distinct cancer clones to investigate whether there was evidence of S100 signal propagation in tumors in vivo. We aggregated single-cell gene expression of the S100a family for each clone grouped by mouse (Figure 6L). We found that M2 clones had significantly higher expression of S100a genes compared with M1 clones (Welch’s t test, p = 9 × 10⁻⁹) and that this was also true when restricting comparison to only the aggressive clones of each mouse (p = 2 × 10⁻⁵). Notably, each of the 7 aggressive clones of M2 had higher S100 expression than any of the 29 clones of M1 (Figure 6L). As all clones from both mice derive from the same starting population in vitro and are largely unrelated with unique histories, as evidenced by their macsGESTALT static barcodes (Figure 2B) as well as their distinct CNVs (Figure S3B), these findings present clear evidence of S100 expression propagation across distinct clonal tumor populations in vivo. Furthermore, aggressive clones in M2 had significantly higher S100 expression than non-aggressive clones (p = 6 × 10⁻⁴), while this was not the case for M1 (Figure 6L). Indeed, M2.2, the dominant clone of M2, which displayed inconsistencies with regard to some canonical epithelial and mesenchymal markers, had the highest S100a expression of any clone across either mouse, suggesting that it had achieved dominance by complementing canonical EMT changes with high S100 expression.
DISCUSSION
To study cancer metastasis at high resolution, we developed macsGESTALT, a multiplexed, inducible lineage tracer that can be easily coupled with scRNA-seq. We applied macsGESTALT to an in vivo model of pancreatic cancer metastasis and reconstructed transcriptomic information, lineage history, and harvest site for ~28,000 single cells derived from nearly 100 clones. These richly annotated cancer metastasis phylogenies can be explored interactively at https://macsgestalt.mckennalab.org/.
Despite extensive investigation, the identification of recurrent genetic drivers of metastasis has remained challenging (Hunter et al., 2018). Here, despite using a metastatically competent genetic model, we found that most clones in fact do not metastasize, supporting the importance of transcriptional and non-genetic processes in metastasis, such as acquisition of late-hybrid EMT states or propagation of S100 expression. While our approach enabled us to precisely map the association between metastasis and EMT and thereby identify gene sets predictive of human survival, further functional investigation of specific EMT states is necessary (Zheng et al., 2015; Aiello et al. 2017, 2018). Similarly, the S100 gene family appears to play a number of important yet poorly understood roles in cancer (Bresnick et al. 2015; Tian et al., 2019) and warrants further functional dissection of its many distinct family members. In addition, direct comparison of our data to scRNA-seq from human patients may shed further light on the relevance of our findings to human disease.
In this study, we apply macsGESTALT lineage tracing to ~100 clones across two mice and find both conserved and distinct ways in which metastasis is achieved. We anticipate that future studies will build on this work and exhaustively explore the full landscape of possible paths to metastasis. macsGESTALT is well suited to such a task, as its inducibility allows lineage tracing to initiate at the optimal experimental time, here after tumor engraftment. Alternatively, initiation can be coupled with specific interventions, such as the administration of a therapeutic to study chemoresistance. Future optimization of macsGESTALT may include editing rate titration, minimization of multi-target deletions, and coupling to other emerging technologies such as signal recording. These technical advancements will enable questions in cancer and stem cell biology to be investigated at previously inaccessible levels of resolution and scale.
STAR★METHODS
RESOURCE AVAILABILITY
Lead contact
Further information and requests for resources and reagents should be directed to and will be fulfilled by the Lead Contact, Christopher J. Lengner (lengner@vet.upenn.edu).
Materials availability
Materials and reagents used in this study are listed in the Key Resources Table. Reagents generated in our laboratory are available upon request. The plasmids needed to implement macsGESTALT will be made available through Addgene.
KEY RESOURCES TABLE
| REAGENT or RESOURCE | SOURCE | IDENTIFIER |
|---|---|---|
| Chemicals, peptides, and recombinant proteins | ||
| DMEM, High Glucose | Fisher Scientific | Cat#: 11–965-092 |
| FBS | Corning | Cat#: 35–010-CV |
| L-Glutamine | Invitrogen | Cat#: 25030081 |
| Penicillin-Streptomycin | Invitrogen | Cat#: 15140122 |
| TrypLE Express Enzyme | Thermo Fisher Scientific | Cat#: 12605010 |
| Collagenase IV | Thermo Fisher Scientific | Cat#: 17104019 |
| Lipofectamine 3000 | Thermo Fisher Scientific | Cat#: L3000001 |
| Lipofectamine 2000 | Thermo Fisher Scientific | Cat#: 11668030 |
| Lipofectamine CRISPRMax | Thermo Fisher Scientific | Cat#: CMAX00001 |
| G418 | Invitrogen | Cat#: 108321–42-2 |
| Puromycin | Sigma-Aldrich | Cat#: P8833 |
| Doxycycline Hyclate | Sigma-Aldrich | Cat#: D9891 |
| BSA | Sigma-Aldrich | Cat#: A7906 |
| DAPI | Thermo Fisher Scientific | Cat#: 62248 |
| EDTA | Invitrogen | Cat#: 15575020 |
| DNase I | Sigma-Aldrich | Cat#: D4263 |
| ACK Lysing Buffer | Quality Biological | Cat#: 118–156-721 |
| HBSS | Invitrogen | Cat#: 14175079 |
| PBS | Invitrogen | Cat#: MT21–031-CM |
|
| ||
| Critical commercial assays | ||
| NEB Stable Competent E. coli | NEB | Cat#: 3040H |
| NEBuilder HiFi DNA Assembly Master Mix | NEB | Cat#: E2621 |
| GeneArt Precision gRNA Synthesis Kit | Thermo Fisher Scientific | Cat#: A29377 |
| NucleoSpin DNA RapidLyse Kit | Macherey-Nagel | Cat#: 740100.50 |
| Agencourt AMPure XP | Beckman Coulter | Cat#: A63880 |
| SPRI Select | Beckman Coulter | Cat#: B23317 |
| TapeStation High Sensitivity D1000 ScreenTape | Agilent | Cat#: 5067–5584 |
| TapeStation High Sensitivity D1000 Reagents | Agilent | Cat#: 5067–5585 |
| TapeStation High Sensitivity D5000 ScreenTape | Agilent | Cat#: 5067–5592 |
| TapeStation High Sensitivity D5000 Reagents | Agilent | Cat#: 5067–5593 |
| Qubit 1X dsDNA HS Assay Kit | Thermo Fisher Scientific | Cat#: Q33230 |
| NEBNext Multiplex Oligos for Illumina (Dual Index Primers Set) | NEB | Cat#: E7600S |
| HotStart ReadyMix | Kapa Biosystems | Cat#: KK2601 |
| KAPA Real-Time Library Amplification Kit | Kapa Biosystems | Cat#: KK2702 |
| MiSeq Reagent Kit v3 (600-cycle) | Illumina | Cat#: MS-102–3003 |
| NovaSeq 6000 S2 Reagent Kit (100 cycles) | Illumina | Cat#: 20012862 |
| Chromium Single Cell 3′ GEM, Library & Gel Bead Kit v3 | 10x Genomics | Cat#: PN-1000075 |
| Chromium Single Cell B Chip Kit | 10x Genomics | Cat#: PN-1000074 |
|
| ||
| Deposited data | ||
| Raw and processed transcriptome and barcode data | This manuscript | GEO: GSE173958 |
| Analyzed lineage data | This manuscript | Mendeley Data: https://doi.org/10.17632/t98pjcd7t6.1 |
|
| ||
| Experimental models: Cell lines | ||
| PDAC 6419c5 cells | Li et al., (2018) | N/A |
| macsGESTALT PDAC cells | This manuscript | N/A |
| 293T-V7 cells | This manuscript | N/A |
| 293T-V8 cells | This manuscript | N/A |
|
| ||
| Experimental models: Organisms/strains | ||
| Mouse: NOD scid | Jackson Laboratory | Cat#: 001303 |
|
| ||
| Oligonucleotides | ||
| Primer pairs (see Table S6) | This manuscript, IDT | N/A |
|
| ||
| Recombinant DNA | ||
| pUltra-U6-gRNAs1–5 | This manuscript | N/A |
| PB-EF1α-Puro-V8.2 | This manuscript | N/A |
| pLJM1-EGFP-V7 | This manuscript | N/A |
| pLJM1-EGFP-V8 | This manuscript | N/A |
| pCFDg1–5 | This manuscript | N/A |
| pBS31-GFP-V8crRNAs-U6-tracr-Ub-M2rtTA | This manuscript | N/A |
| pUltra-U6-crRNAs-U6-tracr | This manuscript | N/A |
| p5xU6_5sgRNA-Hsp70-Cas9GFP-pA | Raj et al., (2018) | N/A |
| pBS31 | Beard et al., (2006) | N/A |
| pUltra | Addgene | Cat#: 24129 |
| pLJM1-EGFP | Addgene | Cat#: 19319 |
| Lenti-iCas9-neo | Addgene | Cat#: 22667 |
| psPAX2 | Addgene | Cat#: 12260 |
| pMD2.G | Addgene | Cat#: 12259 |
| Super PiggyBac Transposase | SBI | PB210PA-1 |
|
| ||
| Software and algorithms | ||
| R v4.0.2 | R Core Team | https://www.r-project.org/ |
| 10x Cell Ranger v3 | 10x Genomics | RRID: SCR_017344; https://support.10xgenomics.com/single-cell-gene-expression/software/pipelines/latest/what-is-cell-ranger |
| Monocle 3 | Cao et al., (2019) | RRID: SCR_018685; https://cole-trapnell-lab.github.io/monocle3/ |
| Seurat v3.1.4 | Stuart et al., (2019) | RRID: SCR_016341; www.satijalab.org/seurat/ |
| tidyverse v1.3.0 | Wickham et al., (2019) | RRID: SCR_019186; https://CRAN.R-project.org/package=tidyverse |
| igraph v1.2.6 | https://igraph.org/ | RRID: SCR_019225; https://cran.r-project.org/web/packages/igraph/ |
| ggraph v2.0.5 | https://ggraph.data-imaginist.com/index.html | https://cran.r-project.org/web/packages/ggraph/index.html |
| HOMER v4.11.1 | Heinz et al., (2010) | RRID: SCR_010881; http://homer.ucsd.edu/ |
| singscore v1.8.0 | Foroutan et al., (2018) | https://www.bioconductor.org/packages/release/bioc/html/singscore.html |
| survival v3.2–7 | N/A | https://cran.r-project.org/web/packages/survival/index.html |
| inferCNV | Trinity CTAT Project | https://github.com/broadinstitute/inferCNV |
| Barcode alignment | McKenna et al., (2016) | https://github.com/mckennalab/SingleCellLineage/ |
| TreeUtils | McKenna et al., (2016) | https://github.com/mckennalab/TreeUtils |
| Lineage processing and analysis | This manuscript | https://github.com/ksimeono/macsGESTALT & https://doi.org/10.17632/t98pjcd7t6.1 |
|
| ||
| Other | ||
| Online tree browser | This manuscript | https://macsgestalt.mckennalab.org/ |
Data and code availability
Raw and processed single cell lineage and transcriptional data are available through GEO: GSE173958. Further processed lineage data files and corresponding analysis scripts and R Notebooks are available together in a coherent file structure through Mendeley Data: https://doi.org/10.17632/t98pjcd7t6.1. R Notebooks and scripts alone are also available through Github: https://github.com/ksimeono/macsGESTALT.
EXPERIMENTAL MODELS AND SUBJECT DETAILS
Cell lines
All cells were cultured in a 5% CO2 incubator at 37°C in culture media (High Glucose DMEM, 10% FBS, 1% glutamine with penicillin and streptomycin). 293T cells were a gift from Dr. Jeremey Wang at the University of Pennsylvania. Barcoded 293T cells for the gRNA screen were produced by infecting with pLJM1-EGFP-V7 or pLJM1-EGFP-V8 lentivirus at low MOI (MOI < 0.2) and sorted by fluorescence-activated cell sorting (FACS) for GFP using a BD FACSAria II (BD Biosciences).
For the PDAC cells used to generate macsGESTALT PDAC cells, we selected the most metastically aggressive cell line (6419c5) from a published library of clonal PDAC lines (Li et al., 2018), which were each derived from harvested KPCY tumors. While this cell line originated from a single cell bottleneck during derivation, it had since been passaged ~15x, thereby overtime in culture, becoming effectively polyclonal at the point of macsGESTALT barcode delivery.
macsGESTALT components were introduced into PDAC cells in 3 steps: First, dox-inducible Cas9 was integrated with Lenti-iCas9-neo (Addgene #22667) (Cao et al., 2016), and infected cells were selected for neomycin resistance via G418 for 7 d. Second, the cells were infected with pUltra-U6-gRNAs1–5 at high MOI (MOI > 0.8), and the top 50% of GFP positive cells were sorted by FACS using a BD FACSAria II. This step was repeated once to produce cells with high gRNA array expression to ensure a high editing rate. This can be decreased to slow and spread the editing rate over time. Third, cells from the previous steps were barcoded by cotransfecting PB-EF1α-Puro-V8.2 library and Super PiggyBac Transposase plasmid (SBI #PB210PA-1) at a 1:10 molar ratio using Lipofectamine 3000 (Thermofisher). Barcoded cells were puromycin-selected for 7 d. To maintain diversity and limit leaky editing, cells were expanded after withdrawal of purmycin and frozen down with minimal time in culture (< 7 d). For lineage tracing experiments, cells were only expanded after thawing for 2–4 d as needed prior to orthotopic injection or experiment start.
Mice
NOD scid male mice were acquired from Jackson Laboratory. 10 week old mice were used for orthotopic injection. All mice were maintained in a specific pathogen-free environment at the University of Pennsylvania Animal Care Facilities. All experimental protocols were approved by and performed in accordance with the relevant guidelines and regulations of the Institutional Animal Care and Use Committee of the University of Pennsylvania.
METHOD DETAILS
Plasmid design and construction
All Gibson assemblies were performed using NEBuilder HiFi DNA Assembly Master Mix (NEB #E2621) and were assembled at 50°C for 60 min at appropriate molar ratios. For cloning, all PCRs were performed using HotStart ReadyMix (Kapa Biosystems #KK2601). Restriction enzymes, instead of PCR, were used to linearize vector backbones to prevent backbone mutations. All bacterial transformations were performed with NEB Stable Competent E. coli (NEB #3040H) and cells were grown at 30°C for 24 h, unless otherwise noted. Final plasmid preps were performed with Zymopure II Plasmid Kits (Zymo Research #D4202). All regulatory, coding, and editing-related regions in final assembly products were validated by Sanger sequencing. All gene block sequences were ordered from IDT.
V7 and V8 barcoding lentiviral transfer plasmids used for guide RNA array screening were constructed in 2-part Gibson assemblies using pLJM1-EGFP (Addgene #19319) (Sancak et al., 2008) backbone digested with EcoRI + gene blocks for V7 or V8 barcodes to make pLJM1-EGFP-V7 and pLJM1-EGFP-V8.
pUltra-U6-crRNAs-U6-tracr was constructed in a 3-part Gibson assembly using PacI linearized pUltra (Addgene #24129) (Lou et al., 2012) backbone, a U6-driven array of 10 V8 targeting crisprRNAs (crRNAs) interspersed by tRNAs ordered as a gene block (pUltra5-U6crRNA-GA1), and another gene block encoding a U6-driven tracrRNA (GA1-U6-tracr-pUltra3).
The dox-inducible crRNA array plasmid, pBS31-GFP-V8crRNAs-U6-tracr-Ub-M2rtTA, was constructed in a 3-part Gibson assembly using EcoRI linearized pBS31 (Beard et al., 2006), a gene block containing 10 V8 targeting crRNAs interspersed by tRNAs in the 3′ of a GFP opening reading frame (ORF) (TP-gB-1), and a gene block containing U6-driven tracrRNA followed by Ubc promoter-driven M2-rtTA with a V8 barcode of 10 targets in the 3′ UTR (TP-gB-2). The barcode was excised for transient transfection gRNA screening experiments by digesting with NsiI and religating the backbone.
p5xU6_5sgRNA-Hsp70-Cas9GFP-pA that had V7 gRNAs 5–9 each with a separate U6 promoter was a gift from J. Gagnon (Raj et al., 2018).
pCFDg1–5 gRNA-tRNA array was constructed stepwise as previously described using pCFD5 (Addgene #73914) (Port and Bullock 2016) as a template and V8 targeting gRNAs.
pUltra-U6-gRNAs1–5 lentiviral transfer plasmid, which was used to make macsGESTALT PDAC cells, was generated in a 3-part Gibson assembly using pUltra backbone linearized with PacI, a gene block with U6 promoter and gRNA 1 (pUltra5-U6-gRNA1), and a PCR-amplicon, amplified from pCFDg1–5, containing gRNA-tRNAs 2–5 (gRNAs1–5-pUltra3), thereby producing a constitutively-expressed five gRNA-tRNA array and a constitutive GFP selection marker.
PB-EF1α-Puro-V8.2 library cloning was performed as a 3-part Gibson assembly: 1) PB-CMV-MCS-EF1α-Puro (Systems Biosciences PB-510B-1) was digested with SpeI and HpaI to excise its cargo and create a linear backbone. 2) EF1α promoter and puro resistance gene were amplified from lentiGuide-Puro (Addgene #52963). 3) The V8.2 target array was ordered as a gene block. This assembly produced the PB-EF1α-Puro-V8.2 vector. Then, the barcode library was generated via a 2-part Gibson assembly using EcoRI linearized PB-EF1α-Puro-V8.2 and a random 10 bp containing staticID (static barcode) fragment, which was made by annealing and extending a pair of oligos (targetbarcode-r: TTTGTCCAATTATGCTCGAGGTCGAGAATTNNNNNNNNNNCGTT GATCGCACGCCA, targetbarcode-f2: TAGTTGGTTCCTACTGGCGTGCGATCAACG). The library was transformed into NEB 10-beta Electrocompetent E. coli (NEB #3020K), and the entire transformation was grown as a midi culture and prepped with Chargeswitch Pro Filter Midi Kit (Thermofisher #CS31104).
Viral production
Lentiviruses were packaged in HEK 293T cells using psPAX2 (Addgene #12260) and pMD2.G (Addgene #12259) second generation packaging and envelope plasmids. Viral supernatants were collected 2–4 d post-transfection and filtered through 0.45 μm filters. Filtered supernatants were either stored at −80°C (never refrozen) or used fresh to infect cells.
Guide RNA array editing screen
293T cells barcoded with pLJM1-EGFP-V7 or pLJM1-EGFP-V8 lentivirus were transiently transfected with different combinations of plasmids to test gRNA array editing efficacy. Barcoded cells plated at 250,000 cells per well of 6-well plates, and transfected the following day with Lipofectamine 2000 (Thermofisher #11668030). 1.5 μg of px330 was used in each well (except no-transfection and pUltra-only control wells). All wells receiving a gRNA array plasmid were also transfected with a 1:1 molar amount of the appropriate gRNA plasmid compared to px330. Dox was initiated where appropriate the day after transfection. Additionally, as a positive control, one well received px330 and in vitro transcribed (IVT) gRNAs. Guide templates matching the V8 target sites were constructed and transcribed using GeneArt Precision gRNA Synthesis Kit (Thermofisher #A29377); gRNA 6 and 7 IVT reactions failed and these guides were excluded from further steps. IVT gRNAs were transfected using Lipofectamine CRISPRMax (Thermofisher #CMAX00001) 24 h after px330 was transfected. Expression of plasmids containing fluorescent markers was confirmed by microscopy. Cells were then allowed to expand and edit for one week and then harvested for library preparation and sequencing.
PDAC dox-induced in vitro editing experiments
PDAC cells were cultured in complete media (DMEM, 10% FBS, 1% glutamine with penicillin and streptomycin). Dox-induced editing checks of macsGESTALT PDAC cells were performed in two separate experiments: In the first experiment, cells were plated and started on dox at 3 doses, 0, 0.1, or 2 μg/mL, with media change every other day. Cells were collected at 2 timepoints — after 1 and 2 weeks of dox exposure — and harvested for library preparation and sequencing. In the second experiment, cells were kept on 6 different dosages of dox, 0, 10, 50, 100, 500, or 1,000 ng/mL, for 2 weeks and harvested for library preparation and sequencing. Prior to the start of editing experiments, cells experienced 3 weeks of culture time during barcode drug selection, expansion, and freeze/thawing, during which time background editing from leakiness was possible.
Bulk DNA barcode sequencing
For all bulk DNA editing experiments, approximately one million cells were harvested per condition, washed, pelleted, and genomic DNA extracted with the NucleoSpin DNA RapidLyse Kit (Macherey-Nagel #740100.50). Genomic DNA was normalized to 30–50 ng/μL for each sample. All PCR reactions were performed using SYBR-containing master mix from the KAPA Real-Time Library Amplification Kit (Kapa Biosystems #KK2702) and terminated in the mid-exponential phase to limit over-amplification. AMPure beads (Agencourt Beads, Beckman Coulter #A63880) were used at a ratio of 1.5x to purify products after all PCR reactions. Barcodes were amplified from genomic DNA in a nested approach and sequencing adaptors, sample indices, and flow cell adaptors were added by a series of subsequent PCRs. For 293T samples containing pLJM1-EGFP-V7 or pLJM1-EGFP-V8, barcodes were amplified and adaptors added in a series of 3 PCRs. For PDAC samples containing PB-EF1α-Puro-V8.2, barcodes were amplified and adaptors added in a series of 4 PCRs. Primer sequence, purpose, and annealing temperature for all PCRs in both of these library preparations are included in Table S6. In all cases, 250 ng of genomic DNA was loaded into a 50 μL PCR. Sample indices were added using NEBNext Multiplex Oligos for Illumina (Dual Index Primers Set – New England Biolabs). The concentration of final amplicons was measured by Qubit and the length validated by TapeStation HSD1000 prior to sequencing using Illumina MiSeq 600-cycle v3 Reagent Kits with the following run parameters: Read 1 – 301 cycles, i7 index - 8 cycles, i5 index - 8 cycles, Read 2 – 301 cycles. Bulk sequencing data for all samples was aligned and processed as previously reported (McKenna et al., 2016) and available as a docker image https://github.com/mckennalab/SingleCellLineage/, with the UMI option set to FALSE (no UMI used). Output files were used for generating visualizations using the R programming language.
Limiting dilution PDAC experiments
macsGESTALT PDAC cells were plated in a limiting dilution of approximately ~5 or ~100 cells per well in a 48-well plate. Single cells gave rise to colonies and expanded. Cells were all allowed to expand without split for 2 weeks. The 100-cell wells were confluent and overgrown after 1 week in culture. The 5-cell wells were approximately 80–90% confluent at 2 weeks. At 2 weeks, a healthy, representative well from each condition was selected and passaged at a 1:2 split into a well of a 6-well plate. After 3 d, cells were harvested and dissociated using 500 μL TrypLE (Thermofisher #12605010) for 3–5 min. Reactions were neutralized with 3 mL culture media. Cell clumps were further dissociated by gently pipetting up and down 10x with a p1000, and then cells were centrifuged at 250g for 5 min. Cells were gently resuspended with a p1000 in 1 mL culture media, filtered through a 30 μm strainer, ensured to be in a single cell suspension under a light microscope, and counted with a hemocytometer. Cells were washed twice with 1 mL cold HBSS with 0.04% BSA (centrifuged at 150g for 3 min each time). Cells were filtered again through a 30 μm strainer and resuspended in cold HBSS with 0.04% BSA at a concentration of 700 cells/μL. Cells were counted again with a hemocytometer to ensure accurate concentration. For the 5-cell dilution sample, 8,000 cells were loaded on 10x (Chromium Single Cell 3’ Reagent Kits v3) targeting 5,000 cell recovery; for the 100-cell dilution sample, 16,000 cells were loaded targeting 10,000 cell recovery.
Orthotopic metastasis model
macsGESTALT PDAC cells were thawed and expanded for 2–4 d prior to dissociation and orthotopic injection into 10 week old NOD scid male mice. Approximately 30,000 PDAC cells were injected into the surgically-exposed tail of the pancreas, as previously described in detail (Aiello et al. 2016). Cells were allowed to engraft; then doxycycline was initiated 1 week post-injection and given continuously in the drinking water at 1 mg/mL. Mice were harvested at approximately 5 weeks post injection, once reaching morbidity. Primary tumor (PT), liver, lung, peritoneal macrometastases, and surgical-site lesions were sorted for both mice. Due to a more productive blood-draw, circulating tumor cells (CTCs) were captured for M1 but not M2. Additionally, the surgical-site lesion, which is similar in size and location to other peritoneal macrometastases, was processed separately in M1 but not M2..
Blood harvest and preparation
When harvesting tissues, blood was extracted first via cardiac puncture using a 25 gauge 5/8 needle with 1 mL syringe attached. A successful blood draw was 400–700 μL, which was immediately transferred to a FACS tube containing 4% sodium-citrate in Milli-Q water. This was pelleted at 500 g for 5 min and red blood cells were lysed by resuspension in 2 mL ACK (Ammonium-Chloride-Potassium) buffer and incubation for 5 min at room temperature. 3 mL PBS were added and the mix was pelleted at 500 g for 5 min. Red blood cell lysis was repeated 2 times. Finally, cells were resuspended in 400 μL of cold FACS buffer (PBS, 2% FBS, 1 mM EDTA, 40 ug/mL DNase) with DAPI and strained through a 35 μm filter for FACS.
Macro lesion harvest and dissociation
Primary tumor and macrometastases (metastases that could be manually handled, including surgical-site lesion) were excised from surrounding tissue, removing as much normal surrounding tissue as possible. All macrometastases from a mouse were processed as one sample. Samples were then transferred to a 6-well plate and washed with cold PBS 3x. Samples were minced, then transferred into 10 mL of DMEM containing 2 mg/mL collagenase IV plus 40 μg/mL DNase and incubated in a 37°C shaker for 30 min. Cells were isolated by physical dissociation, filtered through a 70 μm cell strainer, and neutralized with cold DMEM. Samples were centrifuged at 350g for 5 min and resuspended in 500 μL cold FACS buffer (above). Cells were centrifuged at 350g for 5 min, resuspended in 1 mL cold FACS buffer with DAPI, pipetted up and down 5x gently with p1000, and strained through a 35 μm filter for FACS. Samples and cells were kept on ice throughout unless otherwise indicated.
Liver and lung harvest and dissociation
To minimize blood contamination in the liver and lungs, 25 mL of cold PBS was perfused into the right ventricle of the heart (after blood draw from the heart). The entire liver (any macrometastases near the liver surface were completely excluded) and lungs were excised and processed identically to PTs, until immediately following the 30 min shaking digestion step. Here, samples were filtered through 100 μm cell strainers and then neutralized and centrifuged as with PTs, except 250g was used instead of 350g for centrifugation steps.
Liver samples were resuspended and further digested in 5 mL TrypLE for 5 min at 37°C. Digestions were neutralized with cold DMEM + 10% FBS, centrifuged at 250g for 5 min, resuspended in 3 mL ACK, and incubated for 3 min at RT. Liver reactions were neutralized with cold PBS, centrifuged at 250g for 5 min, resuspended in 5 mL cold FACS buffer with DAPI, pipetted up and down 5 times gently with p1000, and strained through a 35 μm filter for FACS.
Lung samples were processed identically to liver samples except the order of ACK and TrypLE digestion steps was reversed (ACK before TrypLE). Additionally, lung samples were much smaller than liver samples and were thus only resuspended in 500 μL of cold FACS buffer with DAPI for FACS. Both liver and lung samples were kept on ice throughout unless otherwise indicated.
Cancer FACS sorting and 10x Chromium loading
Cancer cells were isolated from dissociated tissues via FACS using a BD FACSAria II. After gating for singlets and live cells, GFP+ cells were sorted, thereby purifying PDAC cells from normal cells. For samples with a high yield of cells (PT, macrometastases, surgical-site), 30–35,000 cells were sorted on the purity setting. For each of the lung, liver, and blood samples, the entire sample was sorted on the yield setting to recover as many GFP+ cells as possible. The liver for M1 was stopped with 20% of the sample volume remaining due to excessively long sorting time. Cell numbers recovered for lung and liver were similar for each mouse (M1 liver: 22,000 (80% of total), M2 liver: 30,000, M1 lung: 1,000, M2 lung: 1,500).
After sorting, all samples were passed through a 30 μm filter and then centrifuged at 500g for 5 min and checked for visible pellets. Supernatant was removed to leave 20–30 μL of solution to not disturb the pellets. Remaining volume was measured and raised to 50 μL total by adding a 1:1 mixture of cold FACS buffer (without DNase) and nuclease-free water. 46.6 μL of these samples was loaded for 10x (Chromium Single Cell 3’ Reagent Kits v3), thereby superloading some lanes with up to 25–30,000 cells (macsGESTALT single cell barcode sequencing allows explicit detection of multiplets, see Figure S2J and STAR Methods subsection “Clonal reconstruction and multiplet elimination“).
Single cell transcriptome sequencing
Single cell RNA-seq libraries were prepared as in the 10x Chromium Single Cell 3’ v3 user guide (Rev A) until Step 2.3. After cDNA amplification, the 100 μL cDNA PCR was split 50:50 for separate barcode and transcriptome library preparation. Transcriptome library construction continued as in the 10x user guide instructions. Indexed and pooled single cell transcriptome libraries for each mouse were sequenced separately on the NovaSeq 6000 System with S2 100-cycle kits.
Single cell barcode sequencing
For all single cell barcode PCRs (as for bulk DNA barcode PCRs), SYBR-containing master mix from the KAPA Real-Time Library Amplification Kit was used, and PCRs were stopped in mid-exponential phase. All primers were used at 10 μM. Primer sequence, purpose, and annealing temperature for all library preparation PCRs are included in Table S6.
The barcode split of the cDNA amplification reaction (from 10x Single Cell 3’ v3 Step 2.2) was purified via 1.2x SPRI Select (Beckman Coulter #B23317). cDNA products were eluted in 40 μL of EB. Concentrations were measured by Qubit, and 2 ng/μL dilutions in EB were created for each sample. Barcode amplification and adaptor and sample index addition were performed in 2 sequential PCRs.
Barcodes were selectively amplified by PCR1. Here, 50 ng of each purified, diluted cDNA amplification sample was used to template a 100 μL PCR. After mixing, the reaction was split into 4 smaller reactions of 25 μL each for cycling. PCR cycling conditions were 1) 95°C for 3 min, 2) 14–15 cycles of 98°C for 20 s, 65°C for 15 s, 72°C for 15 s. Sample reaction splits were re-pooled after cycling, and products were purified with 0.9x SPRI Select and eluted in 60 μL EB.
Sample indices were added in PCR2. Here, 5–10 μL of the eluted products of PCR1 (1:12 or 1:6 overall dilution) were used to template a 100 μL PCR, which was again mixed and split into four smaller reactions of 25 μL each. PCR cycling conditions were 1) 95°C for 3 min, 2) 6 cycles of 98°C for 20 s, 65°C for 15 s, 72°C for 15 s. Sample reaction splits were re-pooled after cycling. Dual-sided size selection of complete barcode amplicons was performed using SPRI Select at an exclusion ratio of 0.5x and a selection ratio of 0.7x. Amplicons were eluted in 32 μL EB.
Barcode library size and concentration were checked via TapeStation HSD5000 and Qubit, respectively. Libraries were sequenced using Illumina MiSeq 600-cycle v3 Reagent Kits with the following run parameters: Read 1 – 28 cycles, i7 index - 8 cycles, Read 2 – 500 cycles. M1 was sequenced with 3 kits. Since barcode recovery only increased 5–10% with two additional kits for M1, M2 barcode library was sequenced with a single kit. Limiting dilution experiment libraries were also sequenced with a single kit.
QUANTIFICATION AND STATISTICAL ANALYSIS
Single cell transcriptome data processing
Single cell transcriptome sequencing data was aligned and processed using 10x Cell Ranger v3.1 with the mm10 reference genome. Filtered matrices from Cell Ranger output were further processed using Seurat 3.1.4 (https://satijalab.org/seurat/) (Stuart et al., 2019). All samples across both mice were merged into a single Seurat object. Low quality cells with ≤1,000 genes or ≥0.20 mitochondrial gene fraction (mito fraction) were filtered out. Cell cycle score and phase were determined for each cell using the CellCycleScoring function (https://satijalab.org/seurat/v3.1/cell_cycle_vignette.html).
Variable feature selection, scaling, and normalization were performed using SCTransform, while regressing cycle scores and mito fraction. Dimensionality reduction by PCA was performed using the first 15 principal components (PCs). Cells were plotted in UMAP space and a clearly-separated, large cancer cell cluster was observed, distinct from smaller clusters of contaminating normal cells, mostly derived from samples sorted on the FACS yield setting. Contaminating normal cells were filtered out. 10x cell barcodes, here referred to as cellIDs, for the cancer cells were then exported and used for initial macsGESTALT barcode data filtering.
Single cell lineage data processing
Single cell barcode sequencing data was aligned, collapsed by UMI, and processed, as previously reported (McKenna et al., 2016) via a pipeline available as a docker image here: https://github.com/mckennalab/SingleCellLineage/and described further here: https://github.com/ksimeono/macsGESTALT. For each sample, stats files, containing aligned and collapsed edited barcode sequence data, were extracted from pipeline output and used for clonal and subclonal analysis in R v4.0.2 and tidyverse v1.3.0 (Wickham et al., 2019). Sample stats file for different harvest sites from a mouse were merged. However, each mouse and limiting dilution experiment was processed separately.
To ensure high-quality barcode data was used for reconstruction, five initial filtering steps were applied: First, cellIDs not present in the initial transcriptome cellID list (or v3 10x whitelist for limiting dilution experiments without transcriptional data) were filtered. Second, transcripts (UMIs) with incomplete static barcode (staticID) sequences were filtered. Third, staticIDs with less than two UMIs per cell were removed. Fourth, staticIDs with less than two UMIs per cell on average were filtered. Fifth, staticIDs found in less than 5 cells were filtered. Specific thresholds were determined by examining elbow plots of the relevant parameters (see https://github.com/ksimeono/macsGESTALT for detailed R Notebooks with inline plots for each mouse).
Clonal reconstruction and multiplet elimination
Next, potential clonal groupings of cells based on staticID content (absence or presence) were identified by complete-linkage hierarchical clustering. The staticID content of resulting clusters was examined, and clusters were found to be often improperly fractured due to cells with undetected staticIDs. To identify real clones defined by sets of staticIDs, clustering results were pruned by excluding clusters of less than five cells and staticIDs found in less than 20% of cells for a particular cluster (see https://github.com/ksimeono/macsGESTALT for relevant visualizations and code). For clusters of less than 20 cells, staticIDs found in less than 35% of cells were further excluded. Then, clusters that were either duplicates or subsets of other clusters in terms of their defining staticIDs were collapsed. Finally, remaining staticID cluster sets were manually inspected for improperly fractured clusters, and any remaining improper cluster splits were merged or collapsed (usually this was either not necessary or was only needed for a few clusters).
After cluster cleanup, staticID sets were extracted and used to assign cells. Cells were matched to clusters based on their staticIDs. This process also served to explicitly identify interclonal multiplets, i.e. if a cell matched two or more clusters, this cell was removed as a multiplet. This method performed well, as only a small fraction of cells, ranging from 0 to 0.54% across experiments, went unmatched. Unmatched cells likely belonged to very small clones, only found in in vivo experiments. Furthermore, the percentage between mice was strikingly consistent (M1: 0.54% and M2: 0.51%), highlighting the reproducibility of the cancer model system and reconstruction approach. Only matched singlets were retained for downstream analysis.
With this orthotopic model, it is possible that some of the cells injected can leak out of the pancreas during and after injection and directly colonize the peritoneal cavity (although we sought to minimize this as previously described (Aiello et al. 2016)). To eliminate any such cells from further analysis, we filtered clones that were detected in disseminated sites but not in the PT. This resulted in the removal of a small number of cells (M1: 1.49% and M2: 0%) from a few clones only found in peritoneal macrometases and in the surgical site lesion of M1.
In a true singlet, without genomic duplication of a barcode, each cellID-staticID pair should have a single mutagenized allele. To detect potential intraclonal multiplets or duplicated barcodes, we calculated the number of unique mutagenized evolving barcodes for a cellID-staticID pair, and mutagenized barcodes with less than 25% of the UMIs for that cellID-staticID pair were removed as technical noise.
PDAC is known to undergo large-scale copy-number changes via chromosomal instability. We observed this in our CNV analysis using InferCNV (Figure S3B). While most staticIDs had a median of one mutated allele per cell, some had a median of two and a notably higher average. We speculated that these might be barcodes that resided in genomic areas that underwent copy number gain at some point after barcode integration. StaticID that had an average of 1.3 or greater mutated alleles per cell were considered to be potentially duplicated or triplicated.
Per 10x Chromium 3’ Single Cell v3 documentation (page 16), our overall expected multiplet rate for in vivo experiments with superloading was approximately 12% to 15%. Having explicitly detected and filtered interclonal multiplets, we next removed potential intraclonal multiplets. We filtered all cells with an average number of unique mutated alleles per staticID greater than 1.25, except for cells containing a potentially duplicated staticID; for these cells, the threshold was less stringent, at greater than 3. This resulted in appropriate overall multiplet rates of 12% for M1 and 15.7% for M2. Only true singlets were retained for further analysis.
After these filtering steps, clones that were detected in disseminated sites but not in the PT were again removed if present, and clones were then numbered by their size in the primary tumor, largest to smallest. These rankings are used to refer to clones throughout the paper with the mouse number appended, i.e. M1.1 or M2.14. These finalized clones were used for calculating clone size and clone fraction for each harvest site. These final filtered, clone-assigned singlets were used for further single cell transcriptional analysis.
Clonal aggression scores were estimated by giving points for size and fraction. For each non-PT harvest site where a clone was present 0.5 points were awarded. If the clone’s fraction was higher at a disseminated site than at the PT than it was rewarded an additional 1 point for that site. If a clone made up 5% or more of a disseminated site it received an additional 0.5 points for that site and a further 0.5 points if it was 10% or more.
For limiting dilution validation experiments, cells were visualized by their static barcode expression using tSNE in Seurat. A static barcode (rows) by cells (columns) expression matrix was generated. Just as in a regular transcriptome scRNAseq analysis, this matrix was used to generate a SeuratObject, where static barcodes were treated as features. The first 50 dimensions were used for tSNE plotting.
Single cell transcriptional analysis
Transcriptional analysis continued using only singlets with quality barcode information (from above section). Seurat objects were converted into cell_data_set objects, and Monocle 3 (https://cole-trapnell-lab.github.io/monocle3) was used for all further transcriptional analysis. Preprocess_cds was run with top 20 dimensions (PCA) and align_cds was run with batch correction for harvest site and regression for cycle scores and mito fraction. Cells were plotted in UMAP space and two clusters of low quality or contaminating cells were removed. The first was a cluster of cells distinguished by high ribosomal fraction that was derived from cells of many clones and harvest sites. These cells were likely technical artifacts observed from droplet library preparation. The second was a cluster of cells with high hepatic gene expression. These cells derived from primarily the liver harvest sites and were most likely contaminating tumor-liver multiplets that had escaped initial filtrations steps.
Following these filtrations, preprocess_cds and align_cds were run again as before but with the top 25 dimensions, as determined by examining an elbow plot using plot_pc_variance_explained. Cells were plotted in UMAP space and clusters found using cluster_cells. Further transcriptional analyses and visualizations on all mouse cancer cells together were performed using Monocle 3 functions and custom R scripts as needed. For analyses on individual mice, cells were extracted and reprocessed as above but with the top 20 dimensions by PCA.
Copy-number variation (CNV) analysis
InferCNV was used for single cell CNV analysis (https://github.com/broadinstitute/inferCNV/wiki). Default settings were used. Cutoff = 0.1 was used, which is recommended by InferCNV for 10x data. Clones were treated as cell groups, with cluster_by_groups = T. Clones with >200 cells were downsampled to 200. For clones ≤200 cells, all cells were included.
PseudoEMT analysis
PseudoEMT or pseudotime analysis was performed by finding a trajectory in UMAP space using learn_graph with default settings. The root (most epithelial region) was placed where epithelial gene expression peaked. This additionally led to the most mesenchymal region existing at the end of the trajectory, thus resulting in a pseudoEMT spectrum. To find genes whose expression varied significantly along pseudoEMT, graph_test was used with the ‘principal_graph’ parameter selected. The top 3000 genes were retained, all of which had q ~ 0 and Moran’s I > 0.1 (Table S2). For the top 3000 genes, kinetic expression curves were clustered into groups by ward.D2 clustering using the R Pheatmap package, and the resulting tree was cut into six groups, which were named in order from epithelial to hybrid to mesenchymal patterns of expression.
To find enriched transcription factor motifs within the six gene clusters, findMotifs.pl from HOMER was used with the provided mouse promoter set. All default parameters were used, except for promoter region (−500, 50 bp from TSS) and background promoter frequency (derived from all top 3000 pseudoEMT genes). Known motifs passing an enrichment cutoff of p < 0.05 were extracted. The target genes of each motif were obtained using HOMER’s annotatePeaks.pl. Also for each pseudoEMT gene group, molecular signature database (mSigDB) gene set enrichment was determined using the hypergeometric test within HOMER.
Subclonal and phylogenetic reconstruction
Using filtered barcode data (from material and STAR Methods subsection “Clonal reconstruction and multiplet elimination“), duplicated barcodes were removed entirely (this also removed any cells whose only recovered barcodes were duplicated). Cells with greater than one unique mutated allele per staticID were then filtered. For each cell in a clone, a barcode-of-barcodes was generated by concatenating all evolving barcode alleles, ordered by staticID. If a cell was missing a staticID, ‘UNKNOWN_UNKNOWN_UNKNOWN_UNKNOWN_UNKNOWN’ was concatenated for that staticID to note the missing information for all five target sites. Thereby, for an example clone defined by four staticIDs, every cell had four evolving barcodes concatenated in order and 20 target sites overall, including any missing information.
Within each clone, cells with identical barcode-of-barcodes were then grouped into subclones of indistinguishably closely related cells. To limit computational time required for downstream phylogenetic reconstruction of subclonal relationships, we pruned subclones of only a single cell from the largest clones, i.e. clones with ≥50 cells. This greatly increased computational efficiency while still retaining meaningful subclones.
Separate files were constructed for each clone, containing subclones with associated barcode-of-barcodes alleles. Phylogenetic reconstruction of subclonal relationships was performed for each clone barcode-of-barcodes file separately via TreeUtils (https://github.com/mckennalab/TreeUtils). TreeUtils performs reconstruction using Camin-Sokal maximum parsimony via the PHYLIP Mix software package (Felsenstein 1989), as previously described in depth (McKenna et al., 2016).
Further analysis then resumed in R. Clone Newick files were extracted from TreeUtils output and converted to an edgelist dataframe format. Clone edgelists were combined into a single large edgelist with a common root node (for each mouse separately). A small fraction of clones that were entirely defined by staticIDs that had been genomically duplicated, and were thus left out of phylogenetic analysis, were added back as a single node emerging directly from the root. At this point, cellIDs were added as terminal nodes emerging from subclone nodes (or directly to clone nodes for clones that were left out of phylogenetic analysis due to barcode copy gain). Cell nodes were then annotated with harvest site, transcriptional, and other information as needed. For circle pack or tree visualization, edgelist datafames were converted to igraph graph objects (https://igraph.org/r/) and plotted using ggraph (https://github.com/thomasp85/ggraph).
Subclonal dissemination calculation
Shannon’s Equitability (EH) was used as a statistical measure of dissemination across harvest sites. To calculate EH, Shannon Diversity (H) was first calculated as follows:
S is the number of distinct harvest sites analyzed (six for M1, four for M2). p is the sampling normalized proportion at which a subclone is recovered from a harvest site, i.e. if a subclone is only found in the PT, pPT = 1, while p = 0 for all other sites. A subclone’s H is then used to calculate its EH as follows:
EH therefore normalizes H by the number of harvest sites analyzed to exist between 0 and 1, with 1 being completely even dissemination and 0 being no dissemination. For example, a subclone found at only one harvest site is not metastatically aggressive and has an EH = 0.
PseudoEMT across ancestral relationships
Comparison of pseudoEMT for root clades, subclones, and cells was performed in R. To determine root clade pseudoEMT values, we recursively calculated the weighted mean pseudoEMT value of ancestral nodes moving backwards along phylogenetic trees. Root clades were the nodes immediately preceding the common root of M1.1. These clades are depicted by the outermost circles in the circle packing visualizations of M1.1 (Figures 5A and 5B). The density of root nodes, subclones, and cells along the pseudoEMT axis was then plotted as a ridge plot for comparison.
Identifying genes associated with dissemination
Regression of EH against single cell gene expression was performed while regressing out harvest site, cell cycle scores, and mito fraction. Genes with q < 0.05 and greater than 1000 total transcripts across all cells were retained for further analysis. For analysis of highly expressed and highly associated genes, only genes with greater than 50,000 total transcripts and an absolute estimate of association greater than 0.1 were retained.
TCGA survival analysis
PseudoEMT genes (n = 3000, M1) and genes associated with dissemination (n = 2010, M2) were mapped to their human homologs using getLDS() from the biomaRt package. All homologous genes were included. Preprocessed transcriptomic data (FPKM abundance after upper quantile normalization; FPKMuq) ) from TCGA (https://www.cancer.gov/tcga) for patients with pancreatic adenocarcinoma (TCGA-PAAD; n = 173), breast invasive carcinoma (BRCA; n=969), lung adenocarcinoma (LUAD; n=526), colon adenocarcinoma (COAD; n=517) or prostate adenocarcinoma (PRAD; n=541) were obtained using the R package TCGAbiolinks.
Using the singscore package (Foroutan et al., 2018), patients’ enrichment scores were determined for either each pseudoEMT gene cluster (E, H1, H2, H3, H4, M) or genes positively vs negatively associated with aggression. Patient survival (from the time of pathological diagnosis) was obtained from TCGA clinical data for each cancer. Univariate and multivariate Cox regression analysis was performed in the R environment (survival) to determine the hazard associated with either the pseudoEMT gene signatures (M1) or dissemination (M2) for each cancer. Wald test, LLR and Score test were all significant (p<0.05), indicating the regression models were significant.
Pseudobulk and metagene analyses
The aggregate_gene_expression function from Monocle 3 was used to perform pseudobulk and metagene analyses. For testing whether clones retained their transcriptional identity, pseudobulk samples consisting of clone and harvest site combinations were generated, and only pseudobulk samples with >20 cells were used for further analysis. The entire transcriptome for each pseudobulk sample was aggregated and used to hierarchically cluster samples via the Pheatmap package, with the ward.D2 clustering option.
ADDITIONAL RESOURCES
Interactive online browser of the lineage relationships reconstructed in this study: https://macsgestalt.mckennalab.org/.
Supplementary Material
Highlights.
macsGESTALT is an inducible lineage recorder with efficient capture in single cells
Despite genetic competency, most cancer clones are not metastatic
Metastatic aggression peaks at specific late-hybrid EMT states
Expression of S100 genes is propagated across distinct metastatic subpopulations
ACKNOWLEDGMENTS
We thank J.I. Murray for advice on lineage and transcriptional analyses, J. Li for donation of the PDAC cell line and advice on its use, J.A. Gagnon for advice on barcode editing and lineage tracing, and M.A. Blanco for advice on TCGA survival analysis. We thank K. Tan and A. Raj as well as all the members of the Lengner laboratory for helpful discussions. We also thank the University of Pennsylvania Next-Generation Sequencing Core, in particular J. Schug and J. Kutch, for advice on barcode sequencing. We thank D.P. Beiting for computational resources. This research was supported by the Ruth L. Kirschstein National Research Service Award F30-DK120135, the Blavatnik Family Fellowship in Biomedical Research, and T32-HD083185 (to K.P.S.); National Human Genome Research Institute R00HG010152 and National Cancer Institute 5P30CA023108–37 (to A.M.); the Howard Hughes Medical Institute and Allen Discovery Center for Cell Lineage Tracing (to J.S.); and National Cancer Institute R01-CA168654 and the Shipley Foundation Program for Innovation in Stem Cell Science (to C.J.L.).
Footnotes
SUPPLEMENTAL INFORMATION
Supplemental information can be found online at https://doi.org/10.1016/j.ccell.2021.05.005.
DECLARTION OF INTERESTS
The authors declare no competing interests.
REFERENCES
- Aiello NM, Brabletz T, Kang Y, Angela Nieto M, Weinberg RA, and Stanger BZ (2017). Upholding a role for EMT in pancreatic cancer metastasis. Nature 547, E7–E8. [DOI] [PMC free article] [PubMed] [Google Scholar]
- Aiello NM, Maddipati R, Norgard RJ, Balli D, Li J, Yuan S, Yamazoe T, Black T, Sahmoud A, Furth EE, et al. (2018). EMT subtype influences epithelial plasticity and mode of cell migration. Dev. Cell 45, 681–695.e4. [DOI] [PMC free article] [PubMed] [Google Scholar]
- Aiello NM, Rhim AD, and Stanger BZ (2016). Orthotopic injection of pancreatic cancer cells. Cold Spring Harb. Protoc 2016, db.prot078360. [DOI] [PubMed] [Google Scholar]
- Basu S, Cheriyamundath S, and Ben-Ze’ev A (2018). Cell-cell adhesion: linking Wnt/β-catenin signaling with partial EMT and stemness traits in tumorigenesis. F1000Research 7, 1488. 10.12688/f1000research.15782.1. [DOI] [PMC free article] [PubMed] [Google Scholar]
- Beard C, Hochedlinger K, Plath K, Anton W, and Jaenisch R (2006). Efficient method to generate single-copy transgenic mice by site-specific integration in embryonic stem cells. Genesis 44, 23–28. [DOI] [PubMed] [Google Scholar]
- Boareto Ma, Kumar Jolly M, Goldman A, Pietilä M, Mani SA, Sengupta S, Ben-Jacob E, Levine H, and Onuchic JN (2016). Notch-jagged signalling can give rise to clusters of cells exhibiting a hybrid epithelial/mesenchymal phenotype. J. R. Soc. Interface 13, 20151106. 10.1098/rsif.2015.1106. [DOI] [PMC free article] [PubMed] [Google Scholar]
- Bocci F, Jolly MK, Tripathi SC, Aguilar M, Hanash SM, Levine H, and Onuchic JN (2017). Numb prevents a complete epithelial-mesenchymal transition by modulating Notch signalling. J. R. Soc. Interface 14, 20170512. 10.1098/rsif.2017.0512. [DOI] [PMC free article] [PubMed] [Google Scholar]
- Bowling S, Sritharan D, Osorio FG, Nguyen M, Cheung P, Rodriguez-Fraticelli A, Patel S, Yuan WC, Fujiwara Y, Li BE, et al. (2020). An engineered CRISPR-Cas9 mouse line for simultaneous readout of lineage histories and gene expression profiles in single cells. Cell 181, 1410–1422.e27. [DOI] [PMC free article] [PubMed] [Google Scholar]
- Bresnick AR, Weber DJ, and Zimmer DB (2015). S100 proteins in cancer. Nat. Rev. Cancer 15, 96–109. [DOI] [PMC free article] [PubMed] [Google Scholar]
- Cancer Facts & Figures. n.d. Cancer Facts & Figures; 2020. https://www.cancer.org/content/dam/cancer-org/research/cancer-facts-and-statistics/annual-cancer-facts-and-figures/2020/cancer-facts-and-figures-2020.pdf. [Google Scholar]
- Campbell PJ, Yachida S, Mudie LJ, Stephens PJ, Pleasance ED, Stebbings LA, Morsberger LA, Latimer C, McLaren S, Lin ML, et al. (2010). The patterns and dynamics of genomic instability in metastatic pancreatic cancer. Nature 467, 1109–1113. [DOI] [PMC free article] [PubMed] [Google Scholar]
- Cancer Genome Atlas Research Network (2017). Integrated genomic characterization of pancreatic ductal adenocarcinoma. Cancer Cell 32, 185–203.e13. [DOI] [PMC free article] [PubMed] [Google Scholar]
- Cao J, Wu L, Zhang SM, Lu M, William K, Cheung C, Cai W, Gale M, Qi X, and Qin Y (2016). An easy and efficient inducible CRISPR/Cas9 platform with improved specificity for multiple gene targeting. Nucleic Acids Res 44, e149. [DOI] [PMC free article] [PubMed] [Google Scholar]
- Cao J, Spielmann M, Qiu X, Huang X, Ibrahim DM, Hill AJ, Zhang F, Mundlos S, Christiansen L, Steemers FJ, et al. (2019). The single-cell transcriptional landscape of mammalian organogenesis. Nature 566, 496–502. [DOI] [PMC free article] [PubMed] [Google Scholar]
- Chan MM, Smith ZD, Grosswendt S, Kretzmer H, Norman TM, Adamson B, Jost M, Quinn JJ, Yang D, Jones MG, et al. (2019). Molecular recording of mammalian embryogenesis. Nature 570, 77–82. [DOI] [PMC free article] [PubMed] [Google Scholar]
- van Dijk D, Sharma R, Nainys J, Yim K, Kathail P, Carr AJ, Burdziak C, Moon KR, Chaffer CL, Pattabiraman D, et al. (2018). Recovering gene interactions from single-cell data using data diffusion. Cell 174, 716–729.e27. [DOI] [PMC free article] [PubMed] [Google Scholar]
- Fei F, Qu J, Zhang M, Li Y, and Zhang S (2017). S100A4 in cancer progression and metastasis: a systematic review. Oncotarget 8, 73219–73239. [DOI] [PMC free article] [PubMed] [Google Scholar]
- Felsenstein J (1989). PHYLIP - phylogeny inference package (version 3.2). Cladistics: Int. J. Willi Hennig Soc 5, 164–166. [Google Scholar]
- Foroutan M, Bhuva DD, Lyu R, Horan K, Joseph C, and Davis MJ (2018). Single sample scoring of molecular phenotypes. BMC Bioinformatics 19, 404. [DOI] [PMC free article] [PubMed] [Google Scholar]
- Gabay M, Li Y, and Felsher DW (2014). MYC activation is a hallmark of cancer initiation and maintenance. Cold Spring Harb. Perspect. Med 4, a014241. 10.1101/cshperspect.a014241. [DOI] [PMC free article] [PubMed] [Google Scholar]
- Grimm D, Bauer J, Wise P, Krüger M, Simonsen U, Wehland M, Infanger M, and Corydon TJ (2019). The role of SOX family members in solid tumours and metastasis. Semin. Cancer Biol 67, 122–153. 10.1016/j.semcancer.2019.03.004. [DOI] [PubMed] [Google Scholar]
- Heinz S, Benner C, Spann N, Bertolino E, Lin YC, Laslo P, Cheng JX, Murre C, Singh H, Christopher K, and Glass. (2010). Simple combinations of lineage-determining transcription factors prime Cis-regulatory elements required for macrophage and B cell identities. Mol. Cell 38, 576–589. [DOI] [PMC free article] [PubMed] [Google Scholar]
- Hingorani SR, Wang L, Multani AS, Combs C, Deramaudt TB, Hruban RH, Rustgi AK, Chang S, and Tuveson DA (2005). Trp53R172H and KrasG12D cooperate to promote chromosomal instability and widely metastatic pancreatic ductal adenocarcinoma in mice. Cancer Cell 7, 469–483. [DOI] [PubMed] [Google Scholar]
- Hong T, Watanabe K, Catherine Ha T, Villarreal-Ponce A, Nie Q, and Xing D (2015). An Ovol2-Zeb1 mutual inhibitory circuit governs bidirectional and multi-step transition between epithelial and mesenchymal states. PLoS Comput. Biol 11, e1004569. [DOI] [PMC free article] [PubMed] [Google Scholar]
- Hsu T, Trojanowska M, and Watson DK (2004). Ets proteins in biological control and cancer. J. Cell Biochem 91, 896–903. [DOI] [PMC free article] [PubMed] [Google Scholar]
- Hunter KW, Amin R, Deasy S, Ha NH, and Wakefield L (2018). Genetic insights into the morass of metastatic heterogeneity. Nat. Rev. Cancer 18, 211–223. [DOI] [PMC free article] [PubMed] [Google Scholar]
- Jolly MK, Boareto M, Huang B, Jia D, Lu M, Ben-Jacob E, Onuchic JN, and Levine H (2015). Implications of the hybrid epithelial/mesenchymal phenotype in metastasis. Front. Oncol 5, 155. [DOI] [PMC free article] [PubMed] [Google Scholar]
- Kawakubo T, Okamoto K, Iwata JI, Shin M, Okamoto Y, Yasukochi A, Nakayama KI, Kadowaki T, Tsukuba T, and Yamamoto K (2007). Cathepsin E prevents tumor growth and metastasis by catalyzing the proteolytic release of soluble TRAIL from tumor cell surface. Cancer Res 67, 10869–10878. [DOI] [PubMed] [Google Scholar]
- Kim K, Lu Z, and Hay ED (2002). Direct evidence for a role of beta-catenin/LEF-1 signaling pathway in induction of EMT. Cell Biol. Int 26, 463–476. [DOI] [PubMed] [Google Scholar]
- Lambert AW, Pattabiraman DR, and Weinberg RA (2017). Emerging biological principles of metastasis. Cell 168, 670–691. [DOI] [PMC free article] [PubMed] [Google Scholar]
- Li J, Byrne KT, Yan F, Yamazoe T, Chen Z, Baslan T, Richman LP, Lin JH, Sun YH, Rech AJ, et al. (2018). Tumor cell-intrinsic factors underlie heterogeneity of immune cell infiltration and response to immunotherapy. Immunity 49, 178–193.e7. [DOI] [PMC free article] [PubMed] [Google Scholar]
- Liu RY, Zeng Y, Lei Z, Wang L, Yang H, Liu Z, Zhao J, and Zhang HT (2014). JAK/STAT3 signaling is required for TGF-β-induced epithelial-mesenchymal transition in lung cancer cells. Int. J. Oncol 44, 1643–1651. [DOI] [PubMed] [Google Scholar]
- Liu X, Chen L, Fan Y, Yi H, Yang X, Yao L, Lu J, Lv J, Pan X, Qu F, et al. (2019). IFITM3 promotes bone metastasis of prostate cancer cells by mediating activation of the TGF-β signaling pathway. Cell Death Dis 10, 517. [DOI] [PMC free article] [PubMed] [Google Scholar]
- Lou E, Fujisawa S, Morozov A, Barlas A, Romin Y, Yildirim D, Gholami S, Moreira AL, Manova-Todorova K, Malcolm A, and Moore S (2012). Tunneling nanotubes provide a unique conduit for intercellular transfer of cellular contents in human malignant pleural mesothelioma. PLoS One 7, e33093. [DOI] [PMC free article] [PubMed] [Google Scholar]
- Lu M, Kumar Jolly M, Levine H, Onuchic JN, and Ben-Jacob E (2013). MicroRNA-based regulation of epithelial-hybrid-mesenchymal fate determination. Proc. Natl. Acad. Sci. U S A 110, 18144–18149. [DOI] [PMC free article] [PubMed] [Google Scholar]
- Lu R, Neff NF, Quake SR, and Weissman IL (2011). Tracking single hematopoietic stem cells in vivo using high-throughput sequencing in conjunction with viral genetic barcoding. Nat. Biotechnol 29, 928–933. [DOI] [PMC free article] [PubMed] [Google Scholar]
- McFaline-Figueroa JL, Hill AJ, Qiu X, Jackson D, Shendure J, and Cole T (2019). A pooled single-cell genetic screen identifies regulatory checkpoints in the continuum of the epithelial-to-mesenchymal transition. Nat. Genet 51, 1389–1398. [DOI] [PMC free article] [PubMed] [Google Scholar]
- McKenna A, Findlay GM, Gagnon JA, Horwitz MS, Schier AF, and Shendure J (2016). Whole-organism lineage tracing by combinatorial and cumulative genome editing. Science 353, aaf7907. [DOI] [PMC free article] [PubMed] [Google Scholar]
- McKenna A, and Gagnon JA (2019). Recording development with single cell dynamic lineage tracing. Development 146, dev169730. 10.1242/dev.169730. [DOI] [PMC free article] [PubMed] [Google Scholar]
- Min J, Qian F, Liao W, Liang Y, Gong C, Li E, He W, Yuan R, and Wu L (2018). IFITM3 promotes hepatocellular carcinoma invasion and metastasis by regulating MMP9 through p38/MAPK signaling. FEBS Open Bio 8, 1299–1311. [DOI] [PMC free article] [PubMed] [Google Scholar] [Retracted]
- Naxerova K, and Jain RK (2015). Using tumour phylogenetics to identify the roots of metastasis in humans. Nat. Rev. Clin. Oncol 12, 258–272. [DOI] [PubMed] [Google Scholar]
- Nieto MA (2013). Epithelial plasticity: a common theme in embryonic and cancer cells. Science 342, 1234850. [DOI] [PubMed] [Google Scholar]
- Nieto MA, Huang RYJ, Jackson RA, and Paul Thiery J (2016). EMT: 2016. Cell 166, 21–45. [DOI] [PubMed] [Google Scholar]
- Pastushenko I, and Blanpain C (2019). EMT transition states during tumor progression and metastasis. Trends Cell Biol 29, 212–226. [DOI] [PubMed] [Google Scholar]
- Pastushenko I, Brisebarre A, Sifrim A, Fioramonti M, Revenco T, Boumahdi S, Van Keymeulen A, Brown D, Moers V, Lemaire S, et al. (2018). Identification of the tumour transition states occurring during EMT. Nature 556, 463–468. [DOI] [PubMed] [Google Scholar]
- Port F, and Bullock SL (2016). Augmenting CRISPR Applications in Drosophila with tRNA-Flanked sgRNAs. Nat. Methods 13, 852–854. [DOI] [PMC free article] [PubMed] [Google Scholar]
- Quinn JJ, Jones MG, Okimoto RA, Nanjo S, Chan MM, Yosef N, Bivona TG, and Weissman JS (2021). Single-cell lineages reveal the rates, routes, and drivers of metastasis in cancer xenografts. Science 371, eabc1944. 10.1126/science.abc1944. [DOI] [PMC free article] [PubMed] [Google Scholar]
- Raj B, Wagner DE, McKenna A, Pandey S, Klein AM, Shendure J, Gagnon JA, and Schier AF (2018). Simultaneous single-cell profiling of lineages and cell types in the vertebrate brain. Nat. Biotechnol 40, 181. [DOI] [PMC free article] [PubMed] [Google Scholar]
- Ramanathan A, and Schreiber SL (2009). Direct control of mitochondrial function by mTOR. Proc. Natl. Acad. Sci. U S A 106, 22229–22232. [DOI] [PMC free article] [PubMed] [Google Scholar]
- Rhim AD, Mirek ET, Aiello NM, Maitra A, Bailey JM, McAllister F, Reichert M, Beatty GL, Rustgi AK, Vonderheide RH, et al. (2012). EMT and dissemination precede pancreatic tumor formation. Cell 148, 349–361. [DOI] [PMC free article] [PubMed] [Google Scholar]
- Sancak Y, Peterson TR, Shaul YD, Lindquist RA, Thoreen CC, Bar-Peled L, and Sabatini DM (2008). The rag GTPases bind raptor and mediate amino acid signaling to mTORC1. Science 320, 1496–1501. [DOI] [PMC free article] [PubMed] [Google Scholar]
- Schwab A, Siddiqui A, Eleni Vazakidou M, Napoli F, Böttcher M, Menchicchi B, Raza U, Saatci Ö, Krebs AM, Ferrazzi F, et al. (2018). Polyol pathway links glucose metabolism to the aggressiveness of cancer cells. Cancer Res 78, 1604–1618. [DOI] [PubMed] [Google Scholar]
- Sizemore GM, Pitarresi JR, Balakrishnan S, and Ostrowski MC (2017). The ETS family of oncogenic transcription factors in solid tumours. Nat. Rev. Cancer 17, 337–351. [DOI] [PubMed] [Google Scholar]
- Spanjaard B, Hu B, Mitic N, Olivares-Chauvet P, Janjuha S, Ninov N, and Junker JP (2018). Simultaneous lineage tracing and cell-type identification using CRISPR-Cas9-induced genetic scars. Nat. Biotechnol 36, 469–473. 10.1038/nbt.4124. [DOI] [PMC free article] [PubMed] [Google Scholar]
- Stemmler MP, Eccles RL, Brabletz S, and Brabletz T (2019). Non-redundant functions of EMT transcription factors. Nat. Cell Biol 21, 102–112. [DOI] [PubMed] [Google Scholar]
- Stuart T, Butler A, Hoffman P, Hafemeister C, Papalexi E, Mauck WM 3rd, Hao Y, Stoeckius M, Smibert P, and Satija R (2019). Comprehensive integration of single-cell data. Cell 177, 1888–1902.e21. [DOI] [PMC free article] [PubMed] [Google Scholar]
- Takano S, Reichert M, Bakir B, Das KK, Nishida T, Miyazaki M, Heeg S, Collins MA, Marchand B, Hicks PD, et al. (2016). Prrx1 isoform switching regulates pancreatic cancer invasion and metastatic colonization. Genes Dev 30, 233–247. [DOI] [PMC free article] [PubMed] [Google Scholar]
- Tian C, Clauser KR, Öhlund D, Rickelt S, Huang Y, Gupta M, Mani DR, Carr SA, Tuveson DA, and Hynes RO (2019). Proteomic analyses of ECM during pancreatic ductal adenocarcinoma progression reveal different contributions by tumor and stromal cells. Proc. Natl. Acad. Sci. U S A 116, 19609–19618. [DOI] [PMC free article] [PubMed] [Google Scholar]
- Turajlic S, and Swanton C (2016). Metastasis as an evolutionary process. Science 352, 169–175. [DOI] [PubMed] [Google Scholar]
- Wang H, Wang HS, Zhou BH, Li CL, Zhang F, Wang XF, Zhang G, Bu XZ, Cai SH, and Du J (2013). Epithelial-mesenchymal transition (EMT) induced by TNF-α requires AKT/GSK-3β-Mediated stabilization of snail in colorectal cancer. PLoS One 8, e56664. [DOI] [PMC free article] [PubMed] [Google Scholar]
- Wickham H, Averick M, Bryan J, Chang W, McGowan L, François R, Grolemund G, Hayes A, Henry L, Hester J, et al. (2019). Welcome to the tidyverse. J. Open Source Softw 4, 1686. [Google Scholar]
- Yu F, Xie D, Ng SS, Tung Lum C, Cai MY, Cheung WK, Kung HF, Lin G, Wang X, and Lin MC (2015). IFITM1 promotes the metastasis of human colorectal cancer via CAV-1. Cancer Lett 368, 135–143. [DOI] [PubMed] [Google Scholar]
- Zavadil J, and Böttinger EP (2005). TGF-beta and epithelial-to-mesenchymal transitions. Oncogene 24, 5764–5774. [DOI] [PubMed] [Google Scholar]
- Zhang J, Tian XJ, and Xing J (2016). Signal transduction pathways of EMT induced by TGF-β, SHH, and WNT and their crosstalks. J. Clin. Med. Res 5, 41. 10.3390/jcm5040041. [DOI] [PMC free article] [PubMed] [Google Scholar]
- Zhang J, Tian XJ, Zhang H, Yue T, Li R, Fan B, Elankumaran S, and Xing J (2014). TGF-β-Induced epithelial-to-mesenchymal transition proceeds through stepwise activation of multiple feedback loops. Sci. Signal 7, ra91. [DOI] [PubMed] [Google Scholar]
- Zheng X, Carstens JL, Kim J, Scheible M, Kaye J, Sugimoto H, Wu CC, LeBleu VS, and Kalluri R (2015). Epithelial-to-Mesenchymal transition is dispensable for metastasis but induces chemoresistance in pancreatic cancer. Nature 527, 525–530. [DOI] [PMC free article] [PubMed] [Google Scholar]
Associated Data
This section collects any data citations, data availability statements, or supplementary materials included in this article.
Supplementary Materials
Data Availability Statement
Raw and processed single cell lineage and transcriptional data are available through GEO: GSE173958. Further processed lineage data files and corresponding analysis scripts and R Notebooks are available together in a coherent file structure through Mendeley Data: https://doi.org/10.17632/t98pjcd7t6.1. R Notebooks and scripts alone are also available through Github: https://github.com/ksimeono/macsGESTALT.