

Abstract
Aim:
We aimed to characterize the neuro-ophthalmological phenotype of CDKL5 deficiency disorder and assess visual acuity as a reproducible, quantitative outcome measure.
Method:
We retrospectively analyzed clinical data from patients with CDKL5 deficiency disorder. Complete neuro-ophthalmological assessments, including visual acuity, were evaluated.
Results:
Of 26 patients (85% female, age 3 months to 16.5 years), cerebral visual impairment, defined as visual dysfunction in the absence of ocular or anterior visual pathway abnormalities, was diagnosed in all patients over 2 years of age. Ophthalmological exams revealed nystagmus in 28% and strabismus in 92%. Visual acuity was measured in 24 patients, by preferential looking in all and by sweep visual evoked potential in 13. Visual acuities were lower than age expectations and demonstrated improvement in the first 3 years. Adjusting for age and sex, average preferential looking visual acuity after 2 years of age was higher in patients with intact mobility compared to those who were non-mobile.
Interpretation:
Cerebral visual impairment was observed in patients with CDKL5 deficiency. Visual acuity improved over time and correlated with mobility. Visual acuity, as a quantifiable measure of visual function, should be considered as an outcome measure in pre-clinical and clinical studies for CDKL5 deficiency disorder.
Introduction
Pathogenic variants in Cyclin-dependent kinase-like 5 (CDKL5) are associated with CDKL5 deficiency disorder (CDD, OMIM 300203, 300672), an X-linked developmental and epileptic encephalopathy with a female:male ratio of approximately 4:1.1,2 Case series of CDD report visual dysfunction, including poor eye contact and lack of visual tracking, with the mechanism presumed to be cerebral visual impairment (CVI).3–5,2
Progress towards precision therapy for this highly refractory disorder requires translatable outcome measures. We hypothesize that visual acuity, a quantifiable measure of visual function, is a valuable outcome measure correlating with disease severity. A precedent for this approach derives from the experience of patients with Rett syndrome, another neurodevelopmental disorder that has been studied in parallel with CDD. Pattern-reversal visual evoked potentials (VEPs) and visual acuity assessed in a mouse model and in individuals with Rett syndrome show abnormalities correlating with disease severity and MECP2 variant type.6 In mice, Cdkl5 null males and heterozygous knockout females have abnormal vision with reduced acuity, reduced contrast sensitivity, and reduced VEP amplitude compared to controls.7 Detailed ophthalmologic data, including VEP and visual acuity, have not been reported in individuals with CDD.
We sought to characterize the visual phenotype of CDD and to evaluate whether visual acuity is a quantifiable outcome measure that correlates with neurologic disease burden.
Methods
This retrospective study was approved by the Boston Children’s Hospital (BCH) Institutional Review Board. Patients were included by informed consent to our broader CDKL5 clinic study or waiver of consent for retrospective data collection.
BCH is one of eight CDKL5 Centers of Excellence, including a multidisciplinary clinical program and a collaborative clinic-based research study. Patients with a diagnosis of CDD evaluated in the BCH CDKL5 Center of Excellence were identified and characterized by retrospective chart review. We included patients meeting the proposed minimal diagnostic criteria for CDD (pathogenic or likely pathogenic variant in CDKL5, motor and cognitive delays, and epilepsy onset in the first year of life1), seen by both neurologists and ophthalmologists at BCH from 1998 to 2019. We excluded patients who had another medical diagnosis increasing risk for visual dysfunction. Visual acuity data were not required. We established pathogenicity classification of all variants using American College of Medical Genetics guidelines.8
We reviewed electronic records to gather neurological and ophthalmological data, including MRI data (reports with or without images for review in 23/26 patients) to identify any abnormalities that could affect visual function. We documented EEG patterns, seizure types, epilepsy medications and response. We detailed if and for what time period patients were treated with vigabatrin given the potential for retinal side effects.9 Because of the severity of developmental impairment in CDD, standardized neurodevelopmental testing does not capture individuals’ abilities and quality of life.10,4,1 We assessed for presence of global delays (for those age >1 year for confidence of diagnosis, based on delay in 2 or more domains using standard clinical assessment of developmental milestones) and/or regression and characterized best gross motor, fine motor, communication and social skills as classified in our CDKL5 Center of Excellence clinic study.2
To characterize the visual phenotype, we summarized results of longitudinal clinical examinations including structural eye abnormalities, refractive error, nystagmus, strabismus, electroretinogram findings, and visual acuity by Preferential Looking (PL) method and sweep VEP (sVEP). We recorded when the interpretation of CVI was made on the basis of the history and examination findings, restricting analysis to those age over 2 years to allow for visual maturity and confidence of diagnosis. We confirmed consistency of diagnosis with the proposed consensus definition of childhood CVI as “verifiable visual dysfunction which cannot be attributed to disorders of the anterior visual pathways or any potentially co-occurring ocular impairment.”11
PL acuity was measured using the Teller Acuity Cards.12 For the sVEP procedure, EEG electrodes recorded the cortical response to high-contrast vertical sine-wave gratings that swept from low to high spatial frequency during a 10-second trial. Acuity was estimated by linear extrapolation to the spatial frequency that produced a zero microvolt response.13 Both methods were done as part of routine clinical evaluation. Binocular and monocular testing was done; we report binocular data for consistency as many children were not able to cooperate with monocular testing.
We plotted visual acuities by the PL method and by sVEP as a function of age compared to published data for healthy controls with methods similar to our own.13–15
Statistical analysis
Statistical calculations were done using SAS, version 9.4 (SAS Institute Inc., Cary, NC, USA). Wilcoxon signed rank test was used to compare Spherical equivalents of the right and left eyes. Linear regression with outcome of visual acuity in cycles per degree (cpd) was used for comparison of maximum visual acuity measured at 2 years or older in relationship to developmental abilities, sex and genotype (pre-specified alpha significance level of p <0.05). Two years was chosen as a cutoff to allow for the majority of visual maturity and appropriate age for achievement of developmental skills. Variables with a p-value on univariate testing of <0.25 were initially included in a multivariable model in addition to age of visual maturity (≥4 years compared to <4 years) and sex as required variables. We then used backward selection to reach a final model.
Results
Of 42 patients with suspected CDD seen at BCH between 1998 and 2019, we included 26 patients (22 female, 4 male) meeting criteria for CDD1 and evaluated by both neurologists and ophthalmologists (Tables 1 and 2, Figure S1). We excluded 13 patients due to lack of ophthalmology assessment at BCH, 2 patients who did not have a well-documented pathogenic CDKL5 variant, and one who had hypoxic-ischemic encephalopathy in addition to CDD. Genetic variants of the 26 patients in our study cohort included 5 N-terminal truncations suspected to result in no functional protein, 5 missense variants affecting the kinase domain, 12 truncations between amino acid 172 and 781, and 4 C-terminal truncations (Table 3). Three patients had mosaic CDKL5 variants based on testing in blood (1 female, 2 male).
Table 1. Clinical characteristics of a cohort of 26 individuals with CDD.
The cohort is predominantly female, with refractory generalized or mixed epilepsy, and severe global developmental delay. They lack specific malformations of cortical development and have a variety of encephalopathy patterns on EEG. EEG = electroencephalogram, IQR = Interquartile range, MRI = magnetic resonance imaging
| Clinical characteristics | N(%) or Median [IQR] |
|---|---|
| Sex, Female | 22/26 (84.6%) |
| MRI | |
| Normal | 15/26 (57.7%) |
| Diffuse volume loss | 7/26 (26.9%) |
| Benign cysts | 2/26 (7.7%) |
| T2 signal change, white matter and/or deep grey matter | 4/26 (15.4%) |
| Diffuse hyperperfusion (likely seizure related) | 1/26 (3.8%) |
| Ongoing refractory epilepsy | 22/26 (84.6%) |
| Seizure types | |
| Focal | 17/26 (65.4%) |
| Generalized | 26/26 (100.0%) |
| EEG encephalopathy patterns | |
| Hypsarrhythmia | 10/26 (38.5%) |
| Generalized slowing | 17/26 (65.4%) |
| Discontinuity | 3/26 (11.5%) |
| Slow spike and wave | 2/26 (7.7%) |
| Continuous spike and wave in sleep | 1/26 (3.8%) |
| No encephalopathy pattern | 5/26 (19.2%) |
| Vigabatrin use, N (%) and median duration [IQR] | 13/26 (50%) 1.7 y [1.1, 3.1] |
| Developmental features | |
| Global developmental delay, if evaluated at age >1 year | 23/23 (100%) |
| Developmental regression | 15/26 (57.7%) |
| With worsening of seizures | 10/15 (66.7%) |
| Independent of seizures | 5/15 (33.3%) |
| Mobilizes, crawling or walking with or without support | 10/26 (38.5%) |
| Pincer grasp or presses switches | 6/26 (23.1%) |
| Communicates purposefully with words, signs, or augmentative communication | 10/26 (38.5%) |
Table 2. Ophthalmologic features of a cohort of 26 individuals with CDD who underwent neurological and ophthalmological evaluations in the CDKL5 clinic at Boston Children’s Hospital.
cpd = cycles per degree; IQR = interquartile range; PL= preferential looking; sVEP = sweep visual evoked potential; y = year
| Ophthalmologic clinical characteristics | N(%) or Median [IQR] |
|---|---|
| Ophthalmologic findings | |
| Diagnosis of cerebral visual impairment, >2 years of age | 21/21 (100.0%) |
| Structural eye abnormalities | 0/26 (0.0%) |
| Nystagmus | 10/26 (28.4%) |
| Strabismus | 24/26 (92.3%) |
| Age at testing and number of visits | |
| Age (y) at first visual acuity assessment (N=24) | 1.3 y [0.9, 2.3] |
| Age (y) at most recent visual acuity assessment (N=24) | 3.0 y [1.0, 8.2] |
| Number of visits with assessment of visual acuity (N=26) | 3 [2, 8] |
| PL acuity testing attempted | 24/26 (92.3%) |
| Patients with measureable PL acuity, N (%) | 20/24 (83.3%) |
| Patients with PL test performed, no response, N (%) | 4/24 (16.7%) |
| Best PL acuity 2 years or older (N=16), median [IQR] | 4.6 cpd [1.7, 6.9] |
| sVEP acuity testing attempted | 13/26 (50%) |
| Patients with measureable VEP acuity, N (%) | 13/13 (100%) |
| Best VEP acuity 2 years or older (N=8), median [IQR] | 12.2 cpd [7.1, 16.6] |
Table 3. Sex and CDKL5 genetic variants of a cohort of 26 individuals with CDD who underwent neurological and ophthalmological evaluations in the CDKL5 clinic at Boston Children’s Hospital.
Genotype groups are as defined by Helen Leonard and colleagues4.
| Sex | cDNA Variant† | Protein Change | Variant classification# | |
|---|---|---|---|---|
| Genotype group A = no functional protein (truncations before aa 172 and whole gene deletions) | ||||
| 1 | F | Xp22.2p22.13 (16721094–18581822) x1 | Deletion involving exons 1–6 | Pathogenic |
| 2 | F | Xp22.13 (18468786–18666025) x1 | Deletion involving exons 2–21 | Pathogenic |
| 3 | F | c.100-(9_3)delCCCTTGCinsGCAGA | Damage/destroy natural slice acceptor site of intron 3 | Pathogenic |
| 4 | F | c.383delA | p.Lys128Argfs*9 (mosaic) | Pathogenic |
| 5 | F | c.400C>T | p.Arg134* | Pathogenic |
| Genotype group B = Missense variants in the kinase domain | ||||
| 6 | M | c.320T>A | p.Val107Asp | Likely Pathogenic |
| 7 | F | c.470C>T | p.Ala157Val | Likely Pathogenic |
| 8 | F | c.533G>A | p.Arg178Gln | Pathogenic |
| 9 | F | c.620G>A | p.Gly207Glu | Likely Pathogenic |
| 10 | F | c.637G>C | p.Gly213Arg | Likely Pathogenic |
| Genotype group C = Truncations from amino acid 172 to 781 inclusive | ||||
| 11 | F | c.700C>T | p.Gln234* | Pathogenic |
| 12 | F | Xp22.13 (18604167–18604591) x1 | Deletion involving exons 12–14 | Likely Pathogenic |
| 13 | F | c.1412delA | p.Asp471fs*22 | Pathogenic |
| 14 | F | c.1648C>T | p.Arg550* | Pathogenic |
| 15 | F | c.1671dupA | p.Arg558Thrfs*9 | Pathogenic |
| 16 | F | c.1671dupA | p.Arg558Thrfs*9 | Pathogenic |
| 17 | F | c.1782T>G | p.Tyr594* | Pathogenic |
| 18 | F | c.1791delC | p.Tyr598Thrfs*18 | Pathogenic |
| 19 | M | c.1886T>A | p.Leu629* (mosaic) | Pathogenic |
| 20 | F | c.1909delG | p.Ala637Leufs*21 | Pathogenic |
| 21 | M | c.2152G>A | p.Val718Met (mosaic, known splice effect) | Pathogenic |
| 22 | F | c.2326_2327delAA | p.Lys776Alafs*24 | Likely Pathogenic |
| Genotype group D = Truncations after amino acid 781 | ||||
| 23 | F | Xp22.13 (18618238–18626562) x1 | Deletion involving exons 16–17 | Likely Pathogenic |
| 24 | F | Xp22.13 (18635012–18713396) x1 | Deletion involving exons 17–21 | Likely Pathogenic |
| 25 | F | c.2463G>A | p.Trp821* | Pathogenic |
| 26 | M | c.2522dupA | p.Leu842Valfs*68 | Pathogenic |
Variant classification was done according to American College of Medical Genetics guidelines and all patients had pathogenic or likely pathogenic variants.8
Deletions are listed using Genome Reference Consortium Human Build 38 (hg38) and the minimum genomic coordinates are provided.
Neurologic phenotypes
Seizure characteristics, EEG data, neurodevelopmental characteristics and neuroimaging data are summarized in Table 1.
All patients had generalized seizures; 65.4% additionally had focal seizures. Seizure types included a mixed motor pattern with or without autonomic features. EEGs showed encephalopathy patterns in 80.7% (21/26) patients, except those age < 1.5 years at time of last available EEG. All patients had multifocal and/or generalized epileptiform activity; 1 patient additionally had frequent occipital spikes.
All patients had global developmental delay, which was severe in all patients evaluated at or beyond 2 years of age (N=21). Developmental regression was seen in 15/26 patients (57.7%). Of 24 patients evaluated beyond 1 year of age, 10 (41.7 %) were able to crawl or walk independently or with support, 6 (25.0%) had a pincer grasp and/or ability to press switches, and 10 (41.7%) could communicate with words, signs or augmentative communication devices.
MRIs of the brain were normal in 15/26 (57.7%) patients, demonstrated variable degree of mild to moderate diffuse atrophy in 7/26 patients (26.9%), and showed additional nonspecific abnormalities as outlined in Table 1.
Vigabatrin was used in 13 of 26 patients (50%), initiated at a median age of 1.0 year (IQR 0.7, 1.5 years) with median duration of use 1.7 years (IQR 1.1, 3.1 years). A subset of patients (N=4) continued treatment at last follow-up. Visual field restriction was not documented for any of the patients, based on confrontation visual field testing. We did not observe a correlation between the timing of vigabatrin use and visual acuity, and full information on total dose received was not available for all patients. Longitudinal data were primarily available for patients followed for treatment with vigabatrin. Thus, we did not have sufficient comparison data in vigabatrin-naïve patients to determine whether vigabatrin affected the rate of change in visual acuity during development.
Ophthalmological phenotype
Ophthalmological features are outlined in Table 2. Median age at time of first ophthalmologic examination including visual acuity testing was 1.3 years [IQR 0.9, 2.3 years], with median follow-up time of 1.3 years [IQR 0, 5.7 years] (Tables 1 and 2). CVI was diagnosed by ophthalmologists and neurologists in all 21 patients over 2 years of age.11 Of 13 patients excluded for lack of ophthalmologic examination at BCH, 11 had diagnosis of CVI and 2 were too young to assess (3 months and 7 months at time of evaluation in our Center of Excellence).
No patients had structural eye abnormalities. The majority of patients were found by cycloplegic refraction to be hyperopic with no difference in the spherical equivalent between the right eye and left eye (median +2.00 sphere right eye and left eye, Wilcoxon signed rank test, p = 0.5). Nystagmus was observed in 10/26 (28.4%) patients and strabismus in 24/26 (92.3%) patients. Strabismus was characterized as an intermittent exotropia in 18 patients and intermittent esotropia in 6 patients. Electroretinograms were performed in 6/26 patients to monitor for possible vigabatrin toxicity, all demonstrating mild abnormalities consistent with vigabatrin use but not impacting function.
Visual acuity testing was performed in 24/26 patients, with a median of 3 longitudinal assessments [IQR 2, 8] (Table 2). The median age at first assessment of acuity was 1.3 years [IQR 0.9, 2.3 years]; the median age at most recent assessment of acuity was 3.0 years [IQR 1.0, 8.2 years]. Visual acuity, as measured by both the PL method and the sVEP method, demonstrated overall subnormal acuity (Figure 1A, 1B) compared with age-matched published norms.13,15,14
Figure 1. Binocular visual acuities in cycles per degree (cpd) by two methods.
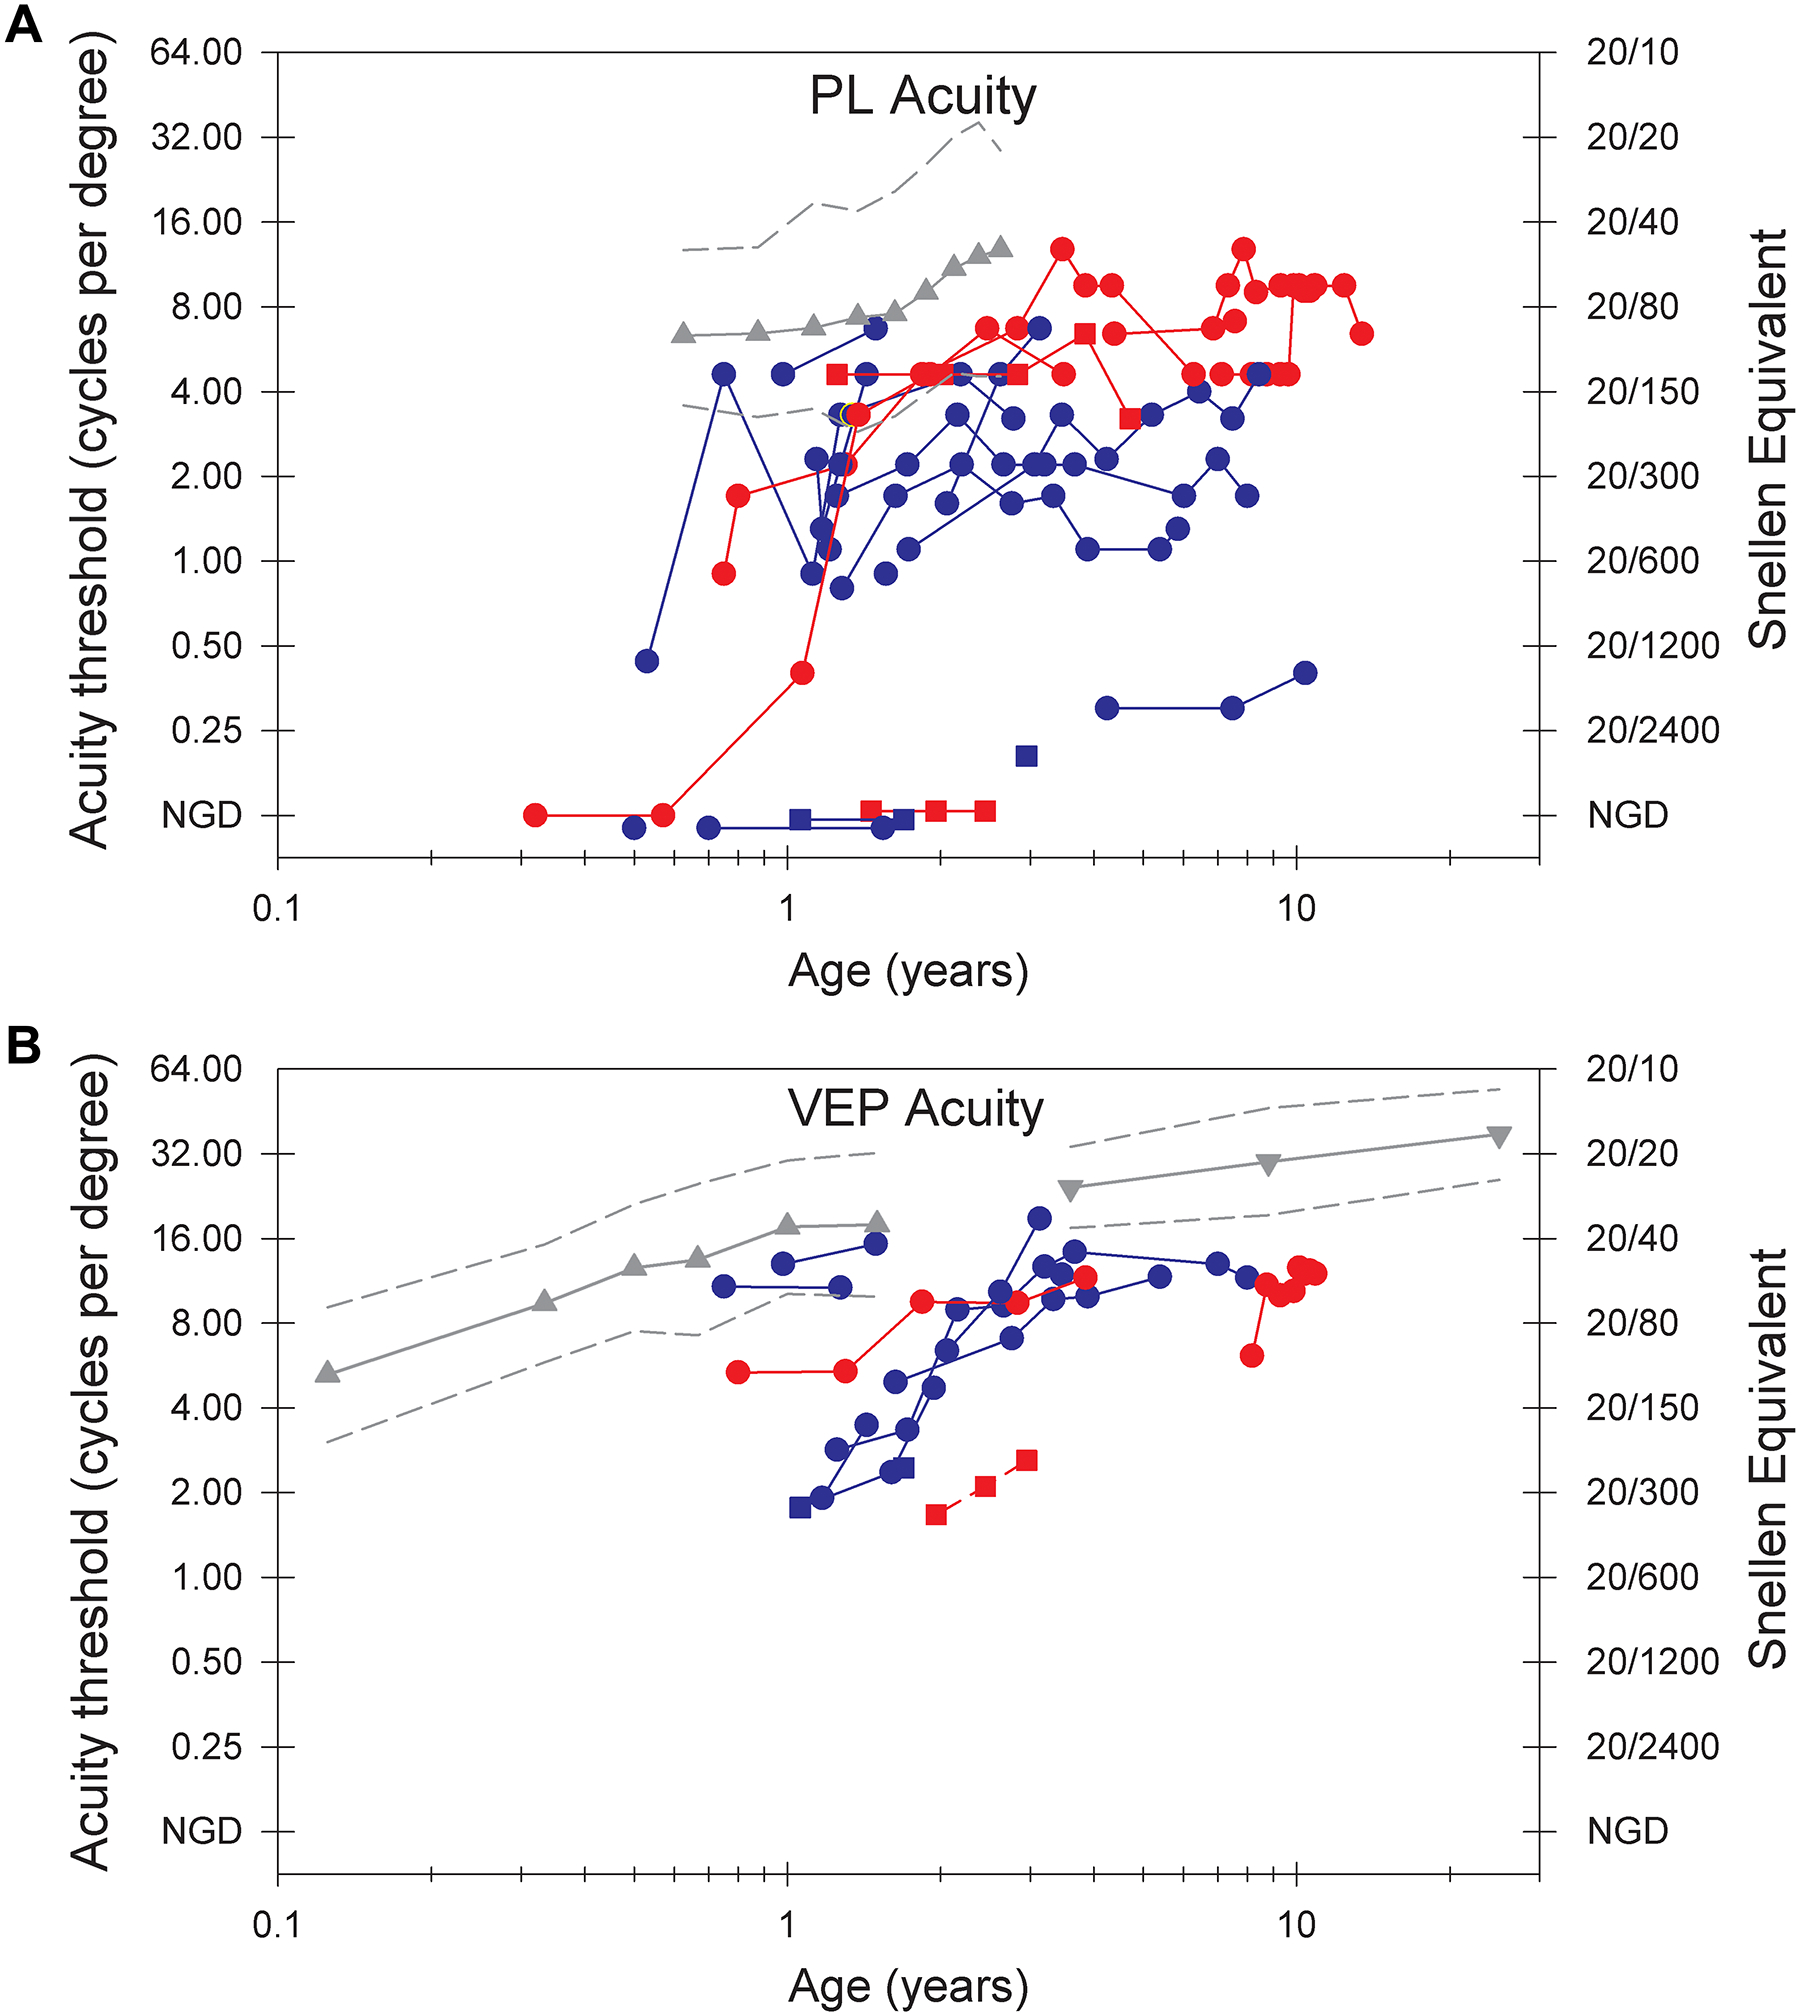
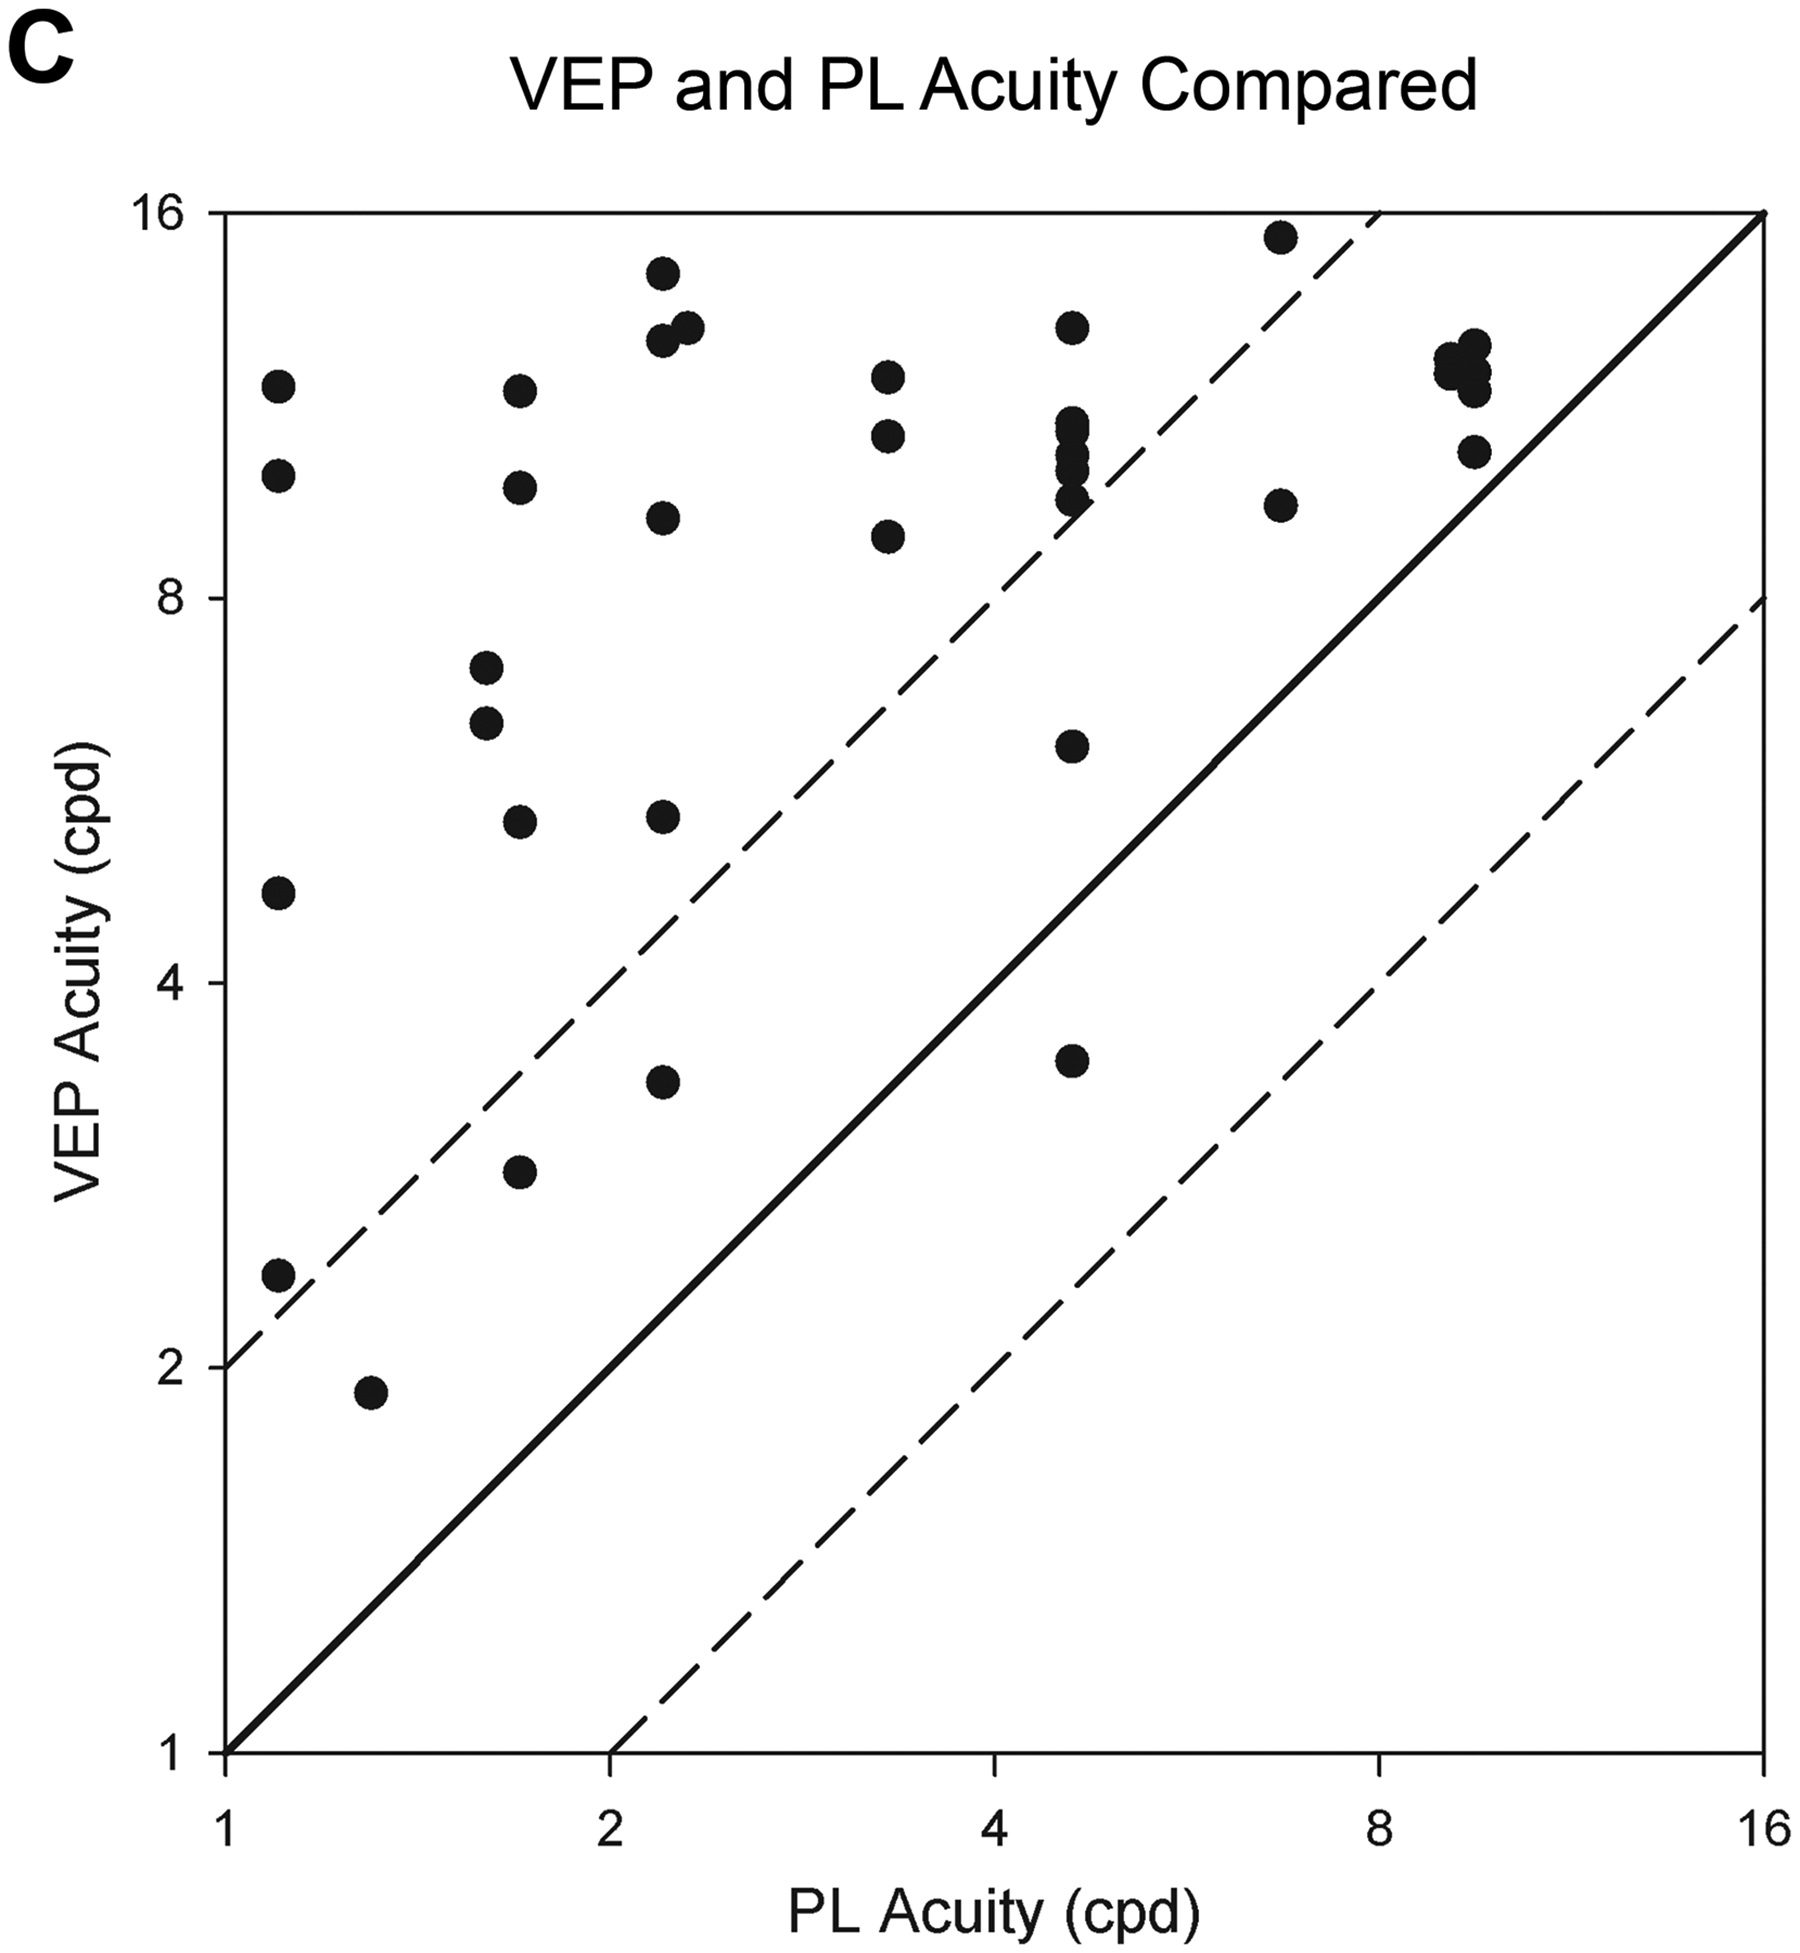
Acuity (Y axis) is on a log2 scale and age (X axis) in a log 10 scale. Longitudinal data from an individual are connected by line segments. Patients are indicated by sex (Female= circle, male = square) and mobility (mobile= red, non-mobile = blue). A) Preferential looking (PL) acuities. Mean normal PL acuity (gray triangles) and the 95% limits of normal acuity (gray dashed lines) are based on published results.14 NGD (no gradient detected) indicates the patient did not detect any grating. Lack of mobility is associated with worse PL visual acuity. B) Visual Evoked Potential (sVEP) acuities. Mean normal sVEP acuity in healthy controls (gray triangles13; inverted gray triangles15); the gray dashed lines represent the 95% limits of normal acuity. Visual acuities by sVEP are below normal but show some improvement in early childhood. C) The relationship of preferential looking (PL) and visual evoked potential (sVEP) acuities. Results from the 13 patients who had both PL and sVEP testing are plotted; individual patients contribute 1 to 8 points. The diagonal lines have a slope of 1.0. Data would lie on the solid line if PL and sVEP acuity values were in perfect agreement. The dashed lines are 1 octave above and below the solid line.
Twenty patients (83.3%) had measurable visual acuity by the PL method; four patients had no response (16.7%) (Table 2). Two of the four patients with no response had measurable acuity by the sVEP method, and sVEP testing was not done for the other two. Mean PL acuity in 16 individuals with testing at 2 years or older was 5.2 cpd (SD 4.1), using the maximum acuity measurement for each patient, compared to mean acuity of 11.0 cpd (Snellen equivalent 20/55) at 2 years in a control population.14 The lower 95% prediction limit in the control population was 4.7 cpd.14
We evaluated possible predictors of visual acuity by PL test after 2 years including developmental skills, presence of ongoing refractory epilepsy, daily seizures, vigabatrin use, and genetic factors (sex, genotype group, and mosaicism; Tables 1, S1). Median visual acuity was higher in patients who were able to mobilize by crawling or walking (with or without support) and in those without daily seizures based on simple linear regression analysis (p =0.018 and p = 0.023). Adjusting for age of visual maturity (4 years) and sex, the mean visual acuity for patients with independent or assisted mobility was 5.1 cpd [95% CI 1.20 to 8.98 cdp] higher than in patients without mobility (p = 0.014, model R2 0.55) (Table S1). Figure 1A demonstrates this relationship between mobility status and PL visual acuity. One outlier is a male with no response to PL testing, and he requires maximal assistance to take steps.
There was not a significant association of visual acuity with mosaicism, sex or resolution of epilepsy (Table S1). There were notably insufficient numbers of patients in each group to power evaluation of these potential confounders. Three of four males in the cohort had visual acuities at the lowest end of the scale or not measurable by both methods (Figure 1A, 1B). The fourth male with higher visual acuities had a mosaic variant and had an overall milder developmental profile with ability to walk independently and communicate nonverbally.
For 5 patients who had a decline or significant variability in PL acuity, changes in EEG patterns and seizure frequency did not explain the variability. EEG time points did not match time points of acuity testing, however. In one patient there was decline in VA in the setting of multiple hospitalizations with acute illnesses despite being seizure free. In the other patients we could not identify a clear clinical explanation for decline or variability in VA.
Half of the cohort (13/26) also had visual acuity measured by sVEP; 11 had longitudinal data including 2 for whom visual acuity was not measurable by the PL method (Figure 1B). Visual acuity by sVEP demonstrated improvement in parallel with normal visual development, especially in the first 3 years. Visual acuity overlapped with the lower end of the normal range in only 3 individuals (Figure 1B), one of whom did not have a diagnosis of CVI as of last assessment at 1 year 3 months and two of whom did have a diagnosis of CVI based on overall ophthalmologic assessment. Median visual acuity by sVEP in 8 individuals with testing at 2 years or older was 12.2 cpd [IQR 7.1, 16.6], Snellen equivalent of 20/49.
Plotting PL compared to sVEP in parallel for each patient demonstrated a persistent gap of 1 octave or more in 9 patients with longitudinal data and 2 patients (P5 and P9) demonstrated improvement of PL acuity to approximate sVEP acuity over time (Figure S2). In both patients, the initial improvement in PL acuity to reach the sVEP acuity occurred in the setting of simplification of the anti-seizure medication regimen with improved alertness. For P5, further improvement occurred when seizures were controlled after adding phenobarbital. Plotting the parallel PL and sVEP acuities for each patient when tested with both measures on the same day (11 patients, 42 data points), demonstrated a gap of greater than 1 octave higher sVEP acuity consistently (Figure 1C). There was moderate correlation between log base 2 PL and sVEP acuities (Pearson correlation, r = 0.45, p = 0.002).
Discussion
We report a detailed analysis of the ophthalmological phenotype, consistent with CVI, in a population of patients with CDD and demonstrate that visual acuity can serve as a quantifiable outcome measure. We establish that visual acuity can be readily measured by 2 independent methods that are suitable for a population with developmental impairment and can demonstrate change over time. Visual acuity additionally correlated with gross motor skills. Visual acuity by sVEP may serve as a biomarker with further validation.
Our entire cohort, when formally assessed at 2 years of age or older, displayed evidence for CVI, compared to the broader group of individuals evaluated in the CDKL5 Centers of Excellence, in whom CVI was diagnosed in 70 of 92 individuals (76%).2 The current study adds detailed ophthalmological evaluation at a single center including visual acuity data by two methods and review of data from both neurologic and ophthalmologic perspectives.2 While it may also reflect ascertainment bias due to requirement of ophthalmologic evaluation, we observed a similar rate of diagnosis in our patients excluded due to lack of ophthalmologic evaluation. Additionally, patients were followed by ophthalmology not only for symptoms of concern but also for monitoring on vigabatrin. This work highlights the importance of vision assessment in individuals with CDD and similar neurodevelopmental disorders.
The gap in visual acuity compared to controls appears similar in patients with CDD compared to prior work that demonstrated a mean 1.3 octave lower acuity in individuals with developmental disabilities without ophthalmologic disorders.16 Visual acuities would ideally be assessed after 5 years of age when vision is fully mature, but we did not have sufficient data points for this later age. The small sample size further limits statistical correlation of clinical characteristics with visual acuity, as demonstrated by sex, which we hypothesize may show an association in a study with larger power for multivariable logistic regression analysis.
It is expected that visual acuity by sVEP is initially higher than by the PL method, however they mature at different rates and the PL acuity variably improves to reach the sVEP acuity threshold over time.17–19 This pattern was approximated in only 2 individuals, related to limiting sedating medications and improved seizure control. Across the cohort, we observed better PL acuity in association with less than daily seizures, however variability or decline in PL acuity within individual patients over time was not fully attributable to EEG or seizure patterns.
There are known potential effects of vigabatrin on vision,20 primarily visual fields. The abnormalities in visual acuity in this study were independent of vigabatrin use. Other anti-seizure medications could also affect visual acuity.21 We saw improvement with minimizing anti-seizure medications in 2 patients, but overall not a clear association with specific medications. A limitation of the use of visual acuity as a biomarker for CDD severity is the potential for confounding effects from seizures, epileptic encephalopathy, and anti-seizure medications. Multiple studies have demonstrated abnormalities in visual function, including but not limited to acuity and CVI, in cohorts of patients with epileptic encephalopathies.22–24
The difference between PL and sVEP acuities in this study was consistent with literature reporting sVEP acuity 1–2.5 octaves higher than PL acuity in patients with CVI.17,18 The present study demonstrated within-patient variability consistent with expected test-retest differences.25,26 We suspect that the gap between PL and sVEP acuity, as also demonstrated in a cohort of children with hypoxic ischemic enephalopathy,19 is supportive of CVI as a contributor to visual dysfunction in the CDD population. Further investigation is needed to relate this gap to established metrics of CVI assessment.
Scales of CVI are published and validated but not used routinely in clinical practice.27–29 A CVI scale may provide a more comprehensive approach to quantification of visual function in the CDD population. Severe cognitive and motor impairments in the CDD population limit use of validated questionnaires, however, because many questions cannot be answered.
Visual acuity is more routinely measured in a clinical setting, and can serve as a quantitative clinical outcome measure, or in the case of sVEP as a biomarker of disease. There is moderate correlation between the 2 measures, which was expected. We demonstrate a relationship between mobility and visual acuity in the CDD population. Prospective multi-center studies with consistent time points could systematically evaluate visual acuity over time in larger populations, validate utility and further assess relationship to disease severity and confounding variables. These findings are valuable for counseling of families, including encouraging them to seek services for individuals with vision impairments, and provide a possible outcome measure for clinical trials. Whereas measurements of visual acuity or other aspects of visual function are not currently established outcome measures for trials in neurodevelopmental disorders, visual acuity is a validated outcome measure for clinical trials in multiple sclerosis, providing a precedent for this type of measure as a trial outcome.30
The CDKL5 research community has identified a need for quantifiable outcome measures other than seizure frequency (CDKL5 Forum, London, UK, 10/2018 and Boston, MA, USA 11/2019). Measurements of visual function are promising as measures that may reflect overall disease severity and may indicate target engagement of potentially therapeutic agents. Studies of Cdkl5 null mice and heterozygous knockout females have demonstrated abnormal VEPs with reduced amplitudes, reduced visual acuity and reduced contrast sensitivity compared to controls, suggesting that measures of visual responses may be promising translatable outcome measures in this population.7 VEPs were collected as a biomarker of disease in the CDKL5 population as part of the Rett Syndrome, MECP2 Duplication, and Rett-Related Disorders Consortium, Rare Disease Clinical Research Network: Neurophysiologic Correlates study (NCT03077308), and will continue to be collected prospectively by the funded U01 grant for clinical trial readiness in CDD (NINDS, 1U01NS114312–01A1) in correlation with clinical assessments.
In conclusion, we demonstrate a phenotype of CVI in CDD and propose that visual acuity may serve as a reliable and quantifiable outcome measure that correlates with disease severity with future work for validation. We anticipate that visual acuity will serve as a dynamic biomarker in the CDD population, providing a meaningful non-seizure outcome for future disease-specific clinical trials. It may also serve as a measure for evaluation of target engagement for pre-clinical trials in rodent models. Beyond CDD, the use of these measures will require studies to establish the relevance of visual acuity in other genetic developmental and epileptic encephalopathies.
Supplementary Material
Figure S1. Flowchart of study enrollment and evaluations.
Figure S2. Binocular visual acuity by PL (circles) and sVEP (triangles) as a function of age for 6 patients with CDD. PL acuities are consistently lower, but do reach the sVEP acuity over time in two patients, P5 and P9.
Table S1. Simple and multivariable regression evaluating association of visual acuity after 2 years with clinical severity and genetic factors. Adjusting for age of visual maturity and sex, visual acuity by preferential looking test at 2 years of age or older is on average 5.1 cpd higher for patients with mobility at last follow-up compared to those who were non-mobile.
What this paper adds.
Cerebral visual impairment is highly prevalent in CDKL5 Deficiency Disorder.
Visual acuity is a measurable quantitative outcome measure in CDKL5 Deficiency Disorder.
Visual acuity in CDKL5 Deficiency Disorder correlates with gross motor ability.
Acknowledgments:
We thank the patients and families who participated in the CDKL5 Center for Excellence at Boston Children’s Hospital. We thank our colleagues who referred families to our center, our clinical colleagues at BCH who evaluated patients in the CDKL5 Center, and our collaborators in the other CDKL5 Centers of Excellence. We thank Shaye Moore, Elizabeth Jarvis, and Hanna De Bruyn for editing and formatting support. This study was supported by the National Institute of Neurologic Disorders and Stroke (K23 NS107646-02, PI Olson) and the International Foundation for CDKL5 research (PI Olson, supported JAC and LCS) with administrative core support through Boston Children’s Hospital IDDRC (1U54HD090255). WEK was supported by the International Foundation for CDKL5 Research and Rettsyndrome.org. TAB was supported by International Foundation for CDKL5 Research, NIH/NICHD U54 HD061222, and the Children’s Hospital Colorado Foundation Ponzio Family Chair in Neurology Research. ABF was supported by the Massachusetts Lions Eye Research Fund. RH was supported by the Massachusetts Lions Eye Research Fund. AP was supported by the Boston Children’s Hospital Translational Research Program.
HEO received consulting fees from Takeda Pharmaceuticals regarding clinical trial design; this study involves identification of a biomarker potentially relevant for future clinical trials. WEK is a member of the Scientific Advisory Boards for the International Foundation of CDKL5 Research and the CDKL5 Research Collaborative and a member of the Medical Advisory Board for the International Rett Syndrome Foundation and the Scientific Advisory Board of the International FOXG1 Foundation. WEK reports consulting with the following companies: Anavex Life Sciences Corp., Neuren Pharmaceuticals, Marinus Pharmaceuticals SpA, GW Pharmaceuticals, Biohaven, AveXis (Novartis), Zynerba Pharmaceuticals, Stalicla, Ovid Therapeutics. TAB reports consultancy for AveXis, Ovid, GW Pharmaceuticals, International Rett Syndrome Foundation, Takeda, and Marinus; Clinical Trials with Acadia, Ovid, GW Pharmaceuticals, Marinus and Rett Syndrome Research Trust; all remuneration has been made to his department. JAC, LCS, ABF, RH, AP, and GH report no disclosures relevant to the content of the manuscript.
Abbreviations:
- BCH
Boston Children’s Hospital
- CDD
CDKL5 deficiency disorder
- CDKL5
cyclin-dependent kinase-like 5
- CI
confidence interval
- CPD
cycles per degree
- CVI
cerebral visual impairment
- EEG
electroencephalogram
- IQR
interquartile range
- MRI
magnetic resonance imaging
- PL
preferential looking
- SD
standard deviation
- sVEP
sweep visual evoked potential
- VEP
visual evoked potential
Footnotes
Supporting information
The following additional material may be found online:
References
- 1.Olson HE, Demarest ST, Pestana-Knight EM, Swanson LC, Iqbal S, Lal D, Leonard H, Cross JH, Devinsky O, Benke TA. Cyclin-Dependent Kinase-Like 5 Deficiency Disorder: Clinical Review. Pediatr Neurol 2019; 97: 18–25. [DOI] [PMC free article] [PubMed] [Google Scholar]
- 2.Demarest ST, Olson HE, Moss A, Pestana-Knight E, Zhang X, Parikh S, Swanson LC, Riley KD, Bazin GA, Angione K, Niestroj LM, Lal D, Juarez-Colunga E, Benke TA. CDKL5 deficiency disorder: Relationship between genotype, epilepsy, cortical visual impairment, and development. Epilepsia 2019; 60: 1733–42. [DOI] [PMC free article] [PubMed] [Google Scholar]
- 3.Bahi-Buisson N, Nectoux J, Rosas-Vargas H, Milh M, Boddaert N, Girard B, Cances C, Ville D, Afenjar A, Rio M, Heron D, N’Guyen Morel MA, Arzimanoglou A, Philippe C, Jonveaux P, Chelly J, Bienvenu T. Key clinical features to identify girls with CDKL5 mutations. Brain 2008; 131: 2647–61. [DOI] [PubMed] [Google Scholar]
- 4.Fehr S, Leonard H, Ho G, Williams S, de Klerk N, Forbes D, Christodoulou J, Downs J. There is variability in the attainment of developmental milestones in the CDKL5 disorder. J Neurodev Disord 2015; 7: 2. [DOI] [PMC free article] [PubMed] [Google Scholar]
- 5.Olson HE, Poduri A. CDKL5 mutations in early onset epilepsy: Case report and review of the literature. J Pediatr Epilepsy 2012: 151–9. [Google Scholar]
- 6.LeBlanc JJ, DeGregorio G, Centofante E, Vogel-Farley VK, Barnes K, Kaufmann WE, Fagiolini M, Nelson CA. Visual evoked potentials detect cortical processing deficits in Rett syndrome. Ann Neurol 2015; 78: 775–86. [DOI] [PMC free article] [PubMed] [Google Scholar]
- 7.Mazziotti R, Lupori L, Sagona G, Gennaro M, Della Sala G, Putignano E, Pizzorusso T. Searching for biomarkers of CDKL5 disorder: early-onset visual impairment in CDKL5 mutant mice. Hum Mol Genet 2017; 26: 2290–8. [DOI] [PMC free article] [PubMed] [Google Scholar]
- 8.Richards S, Aziz N, Bale S, Bick D, Das S, Gastier-Foster J, Grody WW, Hegde M, Lyon E, Spector E, Voelkerding K, Rehm HL, Committee ALQA. Standards and guidelines for the interpretation of sequence variants: a joint consensus recommendation of the American College of Medical Genetics and Genomics and the Association for Molecular Pathology. Genet Med 2015; 17: 405–24. [DOI] [PMC free article] [PubMed] [Google Scholar]
- 9.Gross-Tsur V, Banin E, Shahar E, Shalev RS, Lahat E. Visual impairment in children with epilepsy treated with vigabatrin. Ann Neurol 2000; 48: 60–4. [PubMed] [Google Scholar]
- 10.Fehr S, Downs J, Ho G, de Klerk N, Forbes D, Christodoulou J, Williams S, Leonard H. Functional abilities in children and adults with the CDKL5 disorder. Am J Med Genet A 2016; 170: 2860–9. [DOI] [PubMed] [Google Scholar]
- 11.Sakki HEA, Dale NJ, Sargent J, Perez-Roche T, Bowman R. Is there consensus in defining childhood cerebral visual impairment? A systematic review of terminology and definitions. Br J Ophthalmol 2018; 102: 424–32. [DOI] [PubMed] [Google Scholar]
- 12.Mayer DL, Beiser AS, Warner AF, Pratt EM, Raye KN, Lang JM. Monocular acuity norms for the Teller Acuity Cards between ages one month and four years. Invest Ophthalmol Vis Sci 1995; 36: 671–85. [PubMed] [Google Scholar]
- 13.Birch EE. Assessing infant acuity, fusion, and stereopsis with visual evoked potentials. In: Heckenlively JR, Arden GB editors. Principles and practice of clinical electrophysiology of vision. Cambridge, MA, USA: The MIT Press; 2006. 353–60. [Google Scholar]
- 14.Leone JF, Mitchell P, Kifley A, Rose KA, Sydney Childhood Eye Studies. Normative visual acuity in infants and preschool-aged children in Sydney. Acta Ophthalmol 2014; 92: e521–9. [DOI] [PubMed] [Google Scholar]
- 15.Orel-Bixler DA. Subjective and visual evoked potential measures of acuity in normal and amblyopic adults and children. University of California; at Berkeley; 1989. [Google Scholar]
- 16.Mayer DL, Fulton AB, Sossen PL. Preferential looking acuity of pediatric patients with developmental disabilities. Behav Brain Res 1983; 10: 189–97. [DOI] [PubMed] [Google Scholar]
- 17.Almoqbel F, Leat SJ, Irving E. The technique, validity and clinical use of the sweep VEP. Ophthalmic Physiol Opt 2008; 28: 393–403. [DOI] [PubMed] [Google Scholar]
- 18.Watson T, Orel-Bixler D, Haegerstrom-Portnoy G. Early visual-evoked potential acuity and future behavioral acuity in cortical visual impairment. Optom Vis Sci 2010; 87: 80–6. [DOI] [PMC free article] [PubMed] [Google Scholar]
- 19.Lim M, Soul JS, Hansen RM, Mayer DL, Moskowitz A, Fulton AB. Development of visual acuity in children with cerebral visual impairment. Arch Ophthalmol 2005; 123: 1215–20. [DOI] [PubMed] [Google Scholar]
- 20.Agrawal S, Mayer DL, Hansen RM, Fulton AB. Visual fields in young children treated with vigabatrin. Optom Vis Sci 2009; 86: 767–73. [DOI] [PubMed] [Google Scholar]
- 21.Hilton EJ, Hosking SL, Betts T. The effect of antiepileptic drugs on visual performance. Seizure 2004; 13: 113–28. [DOI] [PubMed] [Google Scholar]
- 22.Kim BH, Yu YS, Kim SJ. Ophthalmologic Features of Lennox-Gastaut Syndrome. Korean J Ophthalmol 2017; 31: 263–7. [DOI] [PMC free article] [PubMed] [Google Scholar]
- 23.Rando T, Bancale A, Baranello G, Bini M, De Belvis AG, Epifanio R, Frisone MF, Guzzetta A, La Torre G, Ricci D, Signorini S, Tinelli F, Biagioni E, Veggiotti P, Mercuri E, Fazzi E, Cioni G, Guzzetta F. Visual function in infants with West syndrome: correlation with EEG patterns. Epilepsia 2004; 45: 781–6. [DOI] [PubMed] [Google Scholar]
- 24.Ricci D, Chieffo D, Battaglia D, Brogna C, Contaldo I, De Clemente V, Losito E, Dravet C, Mercuri E, Guzzetta F. A prospective longitudinal study on visuo-cognitive development in Dravet syndrome: Is there a “dorsal stream vulnerability”? Epilepsy Res 2015; 109: 57–64. [DOI] [PubMed] [Google Scholar]
- 25.Prager TC, Zou YL, Jensen CL, Fraley JK, Anderson RE, Heird WC. Evaluation of methods for assessing visual function of infants. J AAPOS 1999; 3: 275–82. [DOI] [PubMed] [Google Scholar]
- 26.Birch EE. Infant interocular acuity differences and binocular vision. Vision Res 1985; 25: 571–6. [DOI] [PubMed] [Google Scholar]
- 27.Macintyre-Beon C, Young D, Calvert J, Ibrahim H, Dutton GN, Bowman R. Reliability of a question inventory for structured history taking in children with cerebral visual impairment. Eye (Lond) 2012; 26: 1393. [DOI] [PMC free article] [PubMed] [Google Scholar]
- 28.Ortibus E, Laenen A, Verhoeven J, De Cock P, Casteels I, Schoolmeesters B, Buyck A, Lagae L. Screening for cerebral visual impairment: value of a CVI questionnaire. Neuropediatrics 2011; 42: 138–47. [DOI] [PubMed] [Google Scholar]
- 29.Roman-Lantzy C Cortical Visual Impairment: An Approach to Assessment and Treatment. New York NY: AFB Press; 2018. [Google Scholar]
- 30.Balcer LJ, Raynowska J, Nolan R, Galetta SL, Kapoor R, Benedict R, Phillips G, LaRocca N, Hudson L, Rudick R, Multiple Sclerosis Outcome Assessments C. Validity of low-contrast letter acuity as a visual performance outcome measure for multiple sclerosis. Mult Scler 2017; 23: 734–47. [DOI] [PMC free article] [PubMed] [Google Scholar]
Associated Data
This section collects any data citations, data availability statements, or supplementary materials included in this article.
Supplementary Materials
Figure S1. Flowchart of study enrollment and evaluations.
Figure S2. Binocular visual acuity by PL (circles) and sVEP (triangles) as a function of age for 6 patients with CDD. PL acuities are consistently lower, but do reach the sVEP acuity over time in two patients, P5 and P9.
Table S1. Simple and multivariable regression evaluating association of visual acuity after 2 years with clinical severity and genetic factors. Adjusting for age of visual maturity and sex, visual acuity by preferential looking test at 2 years of age or older is on average 5.1 cpd higher for patients with mobility at last follow-up compared to those who were non-mobile.