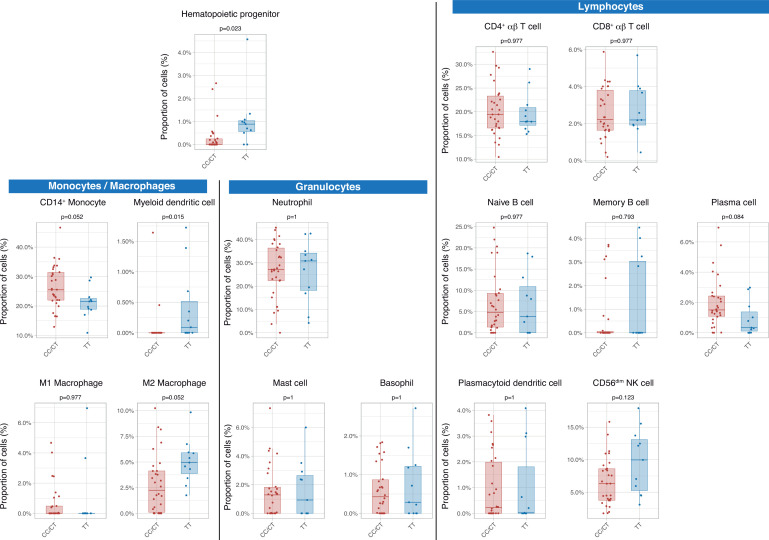
Figure 3. Differences in circulating cell populations according to IFIH1 rs1990760 variants (31 and 11 samples from patients with a CC/CT or TT variant, respectively).
Proportions of each cell line were estimated by deconvolution of RNAseq data. P-values were calculated using a Wilcoxon test and adjusted using the Benjamini-Hochberg method for a false discovery rate of 5%. Points represent individual patient data. In boxplots, bold line represents the median, lower and upper hinges correspond to the first and third quartiles (25th and 75th percentiles) and upper and lower whiskers extend from the hinge to the largest or smallest value no further than 1.5 times the interquartile range.


