

Abstract
Cerebrovascular reactivity (CVR), which measures the ability of cerebral blood vessels to dilate or constrict in response to vasoactive stimuli such as CO2 inhalation, is an important index of the brain’s vascular health. Quantification of CVR using BOLD MRI with hypercapnia challenge has shown great promises in research and clinical studies. However, in order for it to be used as a potential imaging biomarker in large-scale and multi-site studies, the reliability of CO2-CVR quantification across different MRI acquisition platforms and researchers/raters must be examined. The goal of this report from the MarkVCID small vessel disease biomarkers consortium is to evaluate the reliability of CO2-CVR quantification in three studies. First, the inter-rater reliability of CO2-CVR data processing was evaluated by having raters from 5 MarkVCID sites process the same 30 CVR datasets using a cloud-based CVR data processing pipeline. Second, the inter-scanner reproducibility of CO2-CVR quantification was assessed in 10 young subjects across two scanners of different vendors. Third, test-retest repeatability was evaluated in 20 elderly subjects from 4 sites with a scan interval of less than 2 weeks. In all studies, the CO2 CVR measurements were performed using the fixed inspiration method, where the subjects wore a nose clip and a mouthpiece and breathed room air and 5% CO2 air contained in a Douglas bag alternatively through their mouth. The results showed that the inter-rater CoV of CVR processing was 0.08 ± 0.08% for whole-brain CVR values and ranged from 0.16% to 0.88% in major brain regions, with ICC of absolute agreement above 0.9959 for all brain regions. Inter-scanner CoV was found to be 6.90 ± 5.08% for whole-brain CVR values, and ranged from 4.69% to 12.71% in major brain regions, which are comparable to intra-session CoVs obtained from the same scanners on the same day. ICC of consistency between the two scanners was 0.8498 for whole-brain CVR and ranged from 0.8052 to 0.9185 across major brain regions. In the test-retest evaluation, test-retest CoV across different days was found to be 18.29 ± 17.12% for whole-brain CVR values, and ranged from 16.58% to 19.52% in major brain regions, with ICC of absolute agreement ranged from 0.6480 to 0.7785. These results demonstrated good inter-rater, inter-scanner, and test-retest reliability in healthy volunteers, and suggested that CO2-CVR has suitable instrumental properties for use as an imaging biomarker of cerebrovascular function in multi-site and longitudinal observational studies and clinical trials.
Keywords: Cerebrovascular reactivity, Hypercapnia, BOLD, Carbon dioxide, End-tidal CO2
1. Introduction
Cerebrovascular reactivity (CVR), which denotes the ability of cerebral blood vessels to dilate or constrict in response to vasoactive stimuli, is an important index of the brain’s vascular health. As a dynamic property of the cerebral blood vessels, CVR provides vital information of vascular reserve that is complementary to steady-state vascular parameters, such as cerebral blood flow (CBF) and cerebral blood volume (CBV). CVR has been shown to be a sensitive biomarker in various brain diseases and conditions such as dementia (Cantin et al., 2011; Silvestrini et al., 2006; Sur et al., 2020; Yezhuvath et al., 2012), arterial stenosis (De Vis et al., 2015b; Donahue et al., 2013; Gupta et al., 2012; Mandell et al., 2008; Mikulis et al., 2005), stroke (Geranmayeh et al., 2015; Krainik et al., 2005), small vessel disease (Greenberg, 2006; Marstrand et al., 2002), mild cognitive impairment (McKetton et al., 2019; Sur et al., 2020; van der Thiel et al., 2019), multiple sclerosis (Marshall et al., 2014; Pelizzari et al., 2020), brain tumors (Fierstra et al., 2016; Pillai and Zaca, 2011; Zaca et al., 2014), traumatic brain injury (Chan et al., 2015; Kenney et al., 2016), substance abuse (Han et al., 2008), and normal aging (De Vis et al., 2015a; Gauthier et al., 2013; Lu et al., 2011). Additionally, CVR can also be used to account for vascular contributions in blood-oxygenation-level-dependence (BOLD) signals in functional MRI studies to obtain a more quantitative measure of task-induced neural activities (Chen and Gauthier, 2021; Davis et al., 1998; Hoge et al., 1999; Kannurpatti and Biswal, 2008; Liu et al., 2013a; Liu et al., 2013b; Restom et al., 2008; Song et al., 2016; Tsvetanov et al., 2015).
CVR is typically obtained by inducing a vasoactive challenge to the participant while monitoring changes in hemodynamic MRI signals. Among the available vasoactive challenges including the injection of acetazolamide, inhalation of hypercapnic gas, and breath-holding, hypercapnia inhalation has been increasingly used in recent literature due to its potency in causing vasodilation, rapid onset and cessation of the effect, as well as recent advances in MRI-compatible gas delivery apparatus (Lu et al., 2014; Slessarev et al., 2007; Tancredi et al., 2014; Wise et al., 2007; Yezhuvath et al., 2009). For MRI acquisition, although CBF and CBV techniques have been utilized to monitor hemodynamic changes upon the vasoactive challenge (Davis et al., 1998; Donahue et al., 2014; Donahue et al., 2009; Hoge et al., 1999; Hua et al., 2011), the BOLD sequence is by far the most widely used acquisition technique due to its superior signal-to-noise ratio (SNR) and wide availability relative to CBF and CBV MRI techniques. Therefore, there is a surging interest to use BOLD fMRI with hypercapnia challenge to quantify CVR in research and clinical studies. However, before its wider application in large-scale studies which are typically based on a multi-site setting, e.g. the MarkVCID study (Lu et al., 2021), reliability of CO2-CVR in terms of sessions, raters, and scanner vendors needs to be examined.
The goal of the present report, performed as part of the MarkVCID cerebral small vessel disease biomarkers consortium, is to systematically address these questions in a series of three instrumental validation studies. In the first inter-rater reliability study, we evaluated the rater-dependence of a cloud-based CVR data processing pipeline, which is essential for broad availability of the CO2-CVR technique. In the second inter-scanner study, we conducted a multi-vendor comparison study to evaluate the reproducibility of CO2-CVR on two MRI platforms (on the same day). In the third study, we conducted a test-retest repeatability study to evaluate CVR across different days (on the same scanner). To ensure that the test-retest repeatability results are generalizable for multi-center trials, Study 3 was conducted at different MarkVCID sites.
2. Methods
2.1. General
Five MarkVCID sites, all located in the United States, participated in this study. All sites were equipped with 3T whole-body MRI systems. Table 1 lists demographic information of the participants in all sites by studies. The MarkVCID Consortium harmonized the study protocol and it was approved by the institutional review board (IRB) of each site, specifically the Johns Hopkins Medicine IRB, the University of Kentucky IRB, the University of New Mexico IRB, the University of Southern California IRB, and the University of Texas Health San Antonio IRB. Informed written consent was obtained from each participant. The participants included in this study had no history of neurologic or psychiatric diseases.
Table 1.
Scanner and demographic information of the study.
| Site 1 | Site 2 | Site 3 | Site 4 | Site 5 | |
|---|---|---|---|---|---|
| Inter-rater reliability | |||||
| Scanner | Philips Achieva | Siemens Trio | Siemens Prisma | Siemens Trio | – |
| N | 15 | 6 | 7 | 2 | – |
| M/F | 7M/8F | 2M/4F | 2M/5F | 0M/2F | – |
| Age | 69.5±4.9 | 72.4±5.7 | 68.8±3.6 | 78.4±3.6 | – |
| Inter-scanner reproducibility | |||||
| Scanner | Philips Achieva and Siemens Prisma | – | – | – | – |
| N | 10 | – | – | – | – |
| M/F | 7/3 | – | – | – | – |
| Age (y) | 23.9±2.4 | – | – | – | – |
| Test-retest repeatability | |||||
| Scanner | Philips Achieva | Siemens Trio | Siemens Prisma | – | Siemens Trio |
| N | 6 | 4 | 4 | – | 6 |
| M/F | 0M/6F | 1M/3F | 1M/3F | – | 1M/5F |
| Age (y) | 64.3±5.6 | 78.9±2.9 | 75.0±5.1 | – | 67.9±3.9 |
2.2. CO2-CVR acquisition
The CO2 inhalation setup and procedure followed the procedure described by the MarkVCID consortium (Lu et al., 2021). Specifically, subjects were fitted with a mouthpiece and a nose-clip, and mild hypercapnia air (5% CO2, 21% oxygen, and 74% nitrogen) was administered using a Douglas bag, with a valve to switch between room-air and hypercapnic air (Lu et al., 2014). After the initial 15s of room air breathing, subjects breathed 50s of hypercapnic air and 70s room-air alternatively for 3 times, followed by an additional 45s room air, for a total duration of 420 seconds. CO2 concentration in the exhaled air was sampled at 100 Hz and the resulting CO2 trace was recorded using capnography (NM3, Philips, Pittsburgh, PA). BOLD fMRI images were continuously acquired during the entire 420-second period. The scan parameters were: gradient echo EPI, in-plane resolution = 3.4 × 3.4 mm 2, matrix size = 64 × 64, 34–36 axial slices (depending on MRI scanner model) with 3.8mm slice thickness for whole brain coverage, repetition time (TR) = 1500ms, echo time (TE) = 21ms, flip angle (FA) = 90°, 281 volumes with 6 dummy volumes for scanner stabilization. These parameters were chosen based on our previous technical development studies to minimize artifact in CVR results. Specifically, Based on recent theoretical and experimental evidence (Ravi et al., 2016), the use of a TE of 21ms, which is shorter than those used in fMRI (typically 30–45ms), can minimize the artificially negative CVR values in the ventricle regions. A high resolution 3D T1-weighted multi-echo magnetization-prepared rapid-acquisition-of-gradient-echo (ME-MPRAGE) was performed (1 × 1 × 1mm3 voxel size, 4 echoes, TR/TE/ΔTE/TI = 2530/1.66/1.9/1300 ms for Philips scanner and 2530/1.64/1.86/1100 or 1200 ms for Siemens scanners) for anatomic reference (Lu et al., 2021).
2.3. CO2-CVR processing pipeline
CVR data processing was performed using a cloud-based online processing tool referred to as CVR-MRICloud (Version 5, https://braingps.mricloud.org/cvr.v5) (Baker et al., 2019). With this cloud-based processing tool, the users uploaded the de-identified CVR data files to the cloud server, including the BOLD image files, the CO2 trace file (after manually trimmed to remove extra recording periods before the mouthpiece was put on and after it was taken off), and the T1-MPRAGE image (average of the ME-MPRAGE images across all echoes) which allow the normalization of CVR results to the standard MNI space. Next, the server performed the CVR processing automatically. Once completed, the users downloaded a set of output results from the server, including the CVR maps and CVR values of the whole brain and different anatomic brain regions.
The CVR processing performed on the cloud server followed the method established previously (Liu et al., 2019; Lu et al., 2014; Yezhuvath et al., 2009). Briefly, the BOLD data were first motion corrected and smoothed by an 8mm Gaussian kernel. The end-tidal CO2 (EtCO2) curve was extracted from the CO2 trace using an automatic algorithm to identify the peak CO2 of each breath. The EtCO2 curve was time-shifted to align with the whole-brain BOLD signal time course and then used as a regressor for a voxel-wise linear regression with the BOLD data, which yields the CVR map. The CVR map was then coregistered to the MPRAGE-image-space and transformed to the MNI-space using SPM. Finally, the segmented MPRAGE image was used to calculate ROI CVR values by applying the anatomical ROI masks to the BOLD data to obtain ROI-time-courses for ROI CVR computation. The final CVR value is written in the units of % BOLD signal change per mmHg of EtCO2 (%/mmHg). Brain regions investigated included gray matter ROIs of frontal lobe, parietal lobe, temporal lobe, limbic lobe, occipital lobe, insular, basal ganglia and thalamus (Wu et al., 2016), cerebral white matter ROI, as well as calculation of a whole-brain CVR value that includes both gray and white matters.
2.4. Inter-rater reliability (Study 1)
The inter-rater reliability indicates the degree of agreement among independent raters assessing the same dataset. The objective of this analysis was to investigate whether different raters reported consistent CVR results obtained in the same sample. This sample included 30 participants imaged with the above-described CO2-CVR protocol at four different sites (Sites 1, 2, 3, and 4). The 30 CO2-CVR datasets were sent to all five participating sites (Sites 1, 2, 3, 4, and 5) for analysis. Written instructions and a webinar were given to the investigators from each participating site for training (Training materials are published at https://markvcid.partners.org/consortium-protocols-resources). One rater from each site analyzed the datasets independently using the CVR-MRICloud processing pipeline and shared outputs with the lead site (site 1), resulting in 5 raters × 30 subjects CVR measures.
2.5. Inter-scanner reproducibility (Study 2)
The inter-scanner reproducibility indicates the ability to obtain similar observations using the same methodology on different scanners. To evaluate the reproducibility of CO2-CVR on different MRI platforms, a cross-vendor comparison was performed at the lead site (Site 1). Ten healthy subjects (3 females, age 23.9 ± 2.4y) participated in this study. Each subject was scanned on a Philips (Achieva) and a Siemens (Prisma) 3 T scanner within a 2.5-hour period. On each scanner, CVR scans were performed twice with repositioning. The order of the scanners was counterbalanced across subjects. The imaging acquisition and analysis protocol followed that described earlier, resulting in 2 vendors × 10 subjects × 2 repetitions CVR measures. To reduce the effects of physiological variations (Bright et al., 2011; Hou et al., 2020), the CVR values were further corrected for basal and ΔEtCO2 differences between repetitions and across the scanners using the association between them established previously (Hou et al., 2020), given by CVR2, corr = CVR2 + 0.0036(EtCO2basal,2 - EtCO2basal,1) + 0.0072 (ΔEtCO22 - ΔEtCO21).
2.6. Test-retest repeatability (Study 3)
Test-retest repeatability indicates the degree of agreement of CVR measurements on the same scanner but on different days. To evaluate the test–retest repeatability of CO2-CVR on different days, four participating sites (Sites 1, 2, 3, and 5) recruited a total of 20 individuals. Each participant received two CO2-CVR scans using the same scanner and protocol with a gap 4 to 13 days (average 8.9 ± 2.9 days). The number of the subjects from each site are shown in Table 1. This study was performed in a multi-site fashion to simulate conditions in a multi-center trial where sites will have varying levels of prior experience with CVR-specific procedures (e.g., placement of mouthpiece and switching of gas). The participants in this test-retest study are also representative in age of individuals expected to be enrolled in a future small vessel disease trial. (Table 1). On-site training of the CVR experiment procedure was given at each participating site by the lead site prior to the start of the study. Participating sites shared the de-identified data with the lead site for analysis. One subject from Site 2 was excluded due to the absence of CO2 inhalation in the first scan, and another subject from Site 3 was excluded due to mouthpiece displacement (resulting in CO2 trace recording failure) during the second scan, so these two subjects were excluded from the test-retest analysis, resulting in 18 subjects × 2 repetitions CVR measures across 4 sites. Basal and ΔEtCO2 differences between the tests were also accounted for (Hou et al., 2020).
2.7. Statistical analyses
All statistical analyses were performed using Matlab and visualized using Excel. Regression analysis and Bland-Altman (Bland and Altman, 1986) plot were used to visualize the agreement of whole-brain CVR values obtained from different sites (inter-rater reliability study), scanners (inter-scanner reproducibility study) and sessions (test-retest repeatability study). Variability was assessed by coefficient of variance (CoV), given by standard deviation across measures divided by mean values. Intraclass correlation coefficient (Shrout and Fleiss, 1979) (ICC) were used to evaluate the whole-brain CVR and ROI CVR values. Specifically, ICC using a 2-way (same raters) random-effects model (same participants) with single measure and absolute agreement form (noted as ICCAA) was calculated for CVR values obtained from different sites (inter-rater reliability study) and sessions (test-retest repeatability study). ICC using a 2-way random-effects model with single measure and consistency form (noted as ICCC) was calculated for CVR values obtained from different scanners (inter-scanner reproducibility study) considering systematic error between them. In the inter-scanner reproducibility study, two measures from each scanner were averaged to reduce physiological variation in the inter-scanner comparison, and additional single-site inter-session reliability evaluation was performed for each scanner by calculating inter-session CoV and ICCAA using the two whole-brain CVR measures obtained from each scanner. ICC values less than 0.5, between 0.5 and 0.75, between 0.75 and 0.9, and more than 0.90 were considered to be poor, moderate, good, and excellent, respectively (Koo and Li, 2016). For the inter-scanner reproducibility study and the test-retest repeatability study, paired t-test was also used to compare the repeated measures. A p < 0.05 was considered to be significantly different.
3. Results
3.1. Inter-rater reliability
Figure 1 illustrates the whole-brain CVR values of 30 individuals processed by independent raters of the five participating sites. Visual inspection suggested good agreement across the sites. Inter-rater CoV was 0.08 ± 0.08% for whole-brain CVR values, and ranged from 0.16 % to 0.88 % in major brain regions (see Table 2). ICCAA of whole-brain CVR measures generated by the five sites was found to be 0.9999, p < 0.0001, indicating excellent reliability, i.e. a very strong agreement, between the different raters (i.e. sites) when using the CVR-MRICloud analysis pipeline on the same CO2-CVR datasets. ICCAA of regional CVR values generated by the five sites ranged from 0.9959 to 0.9999 (see Table 2).
Figure 1.
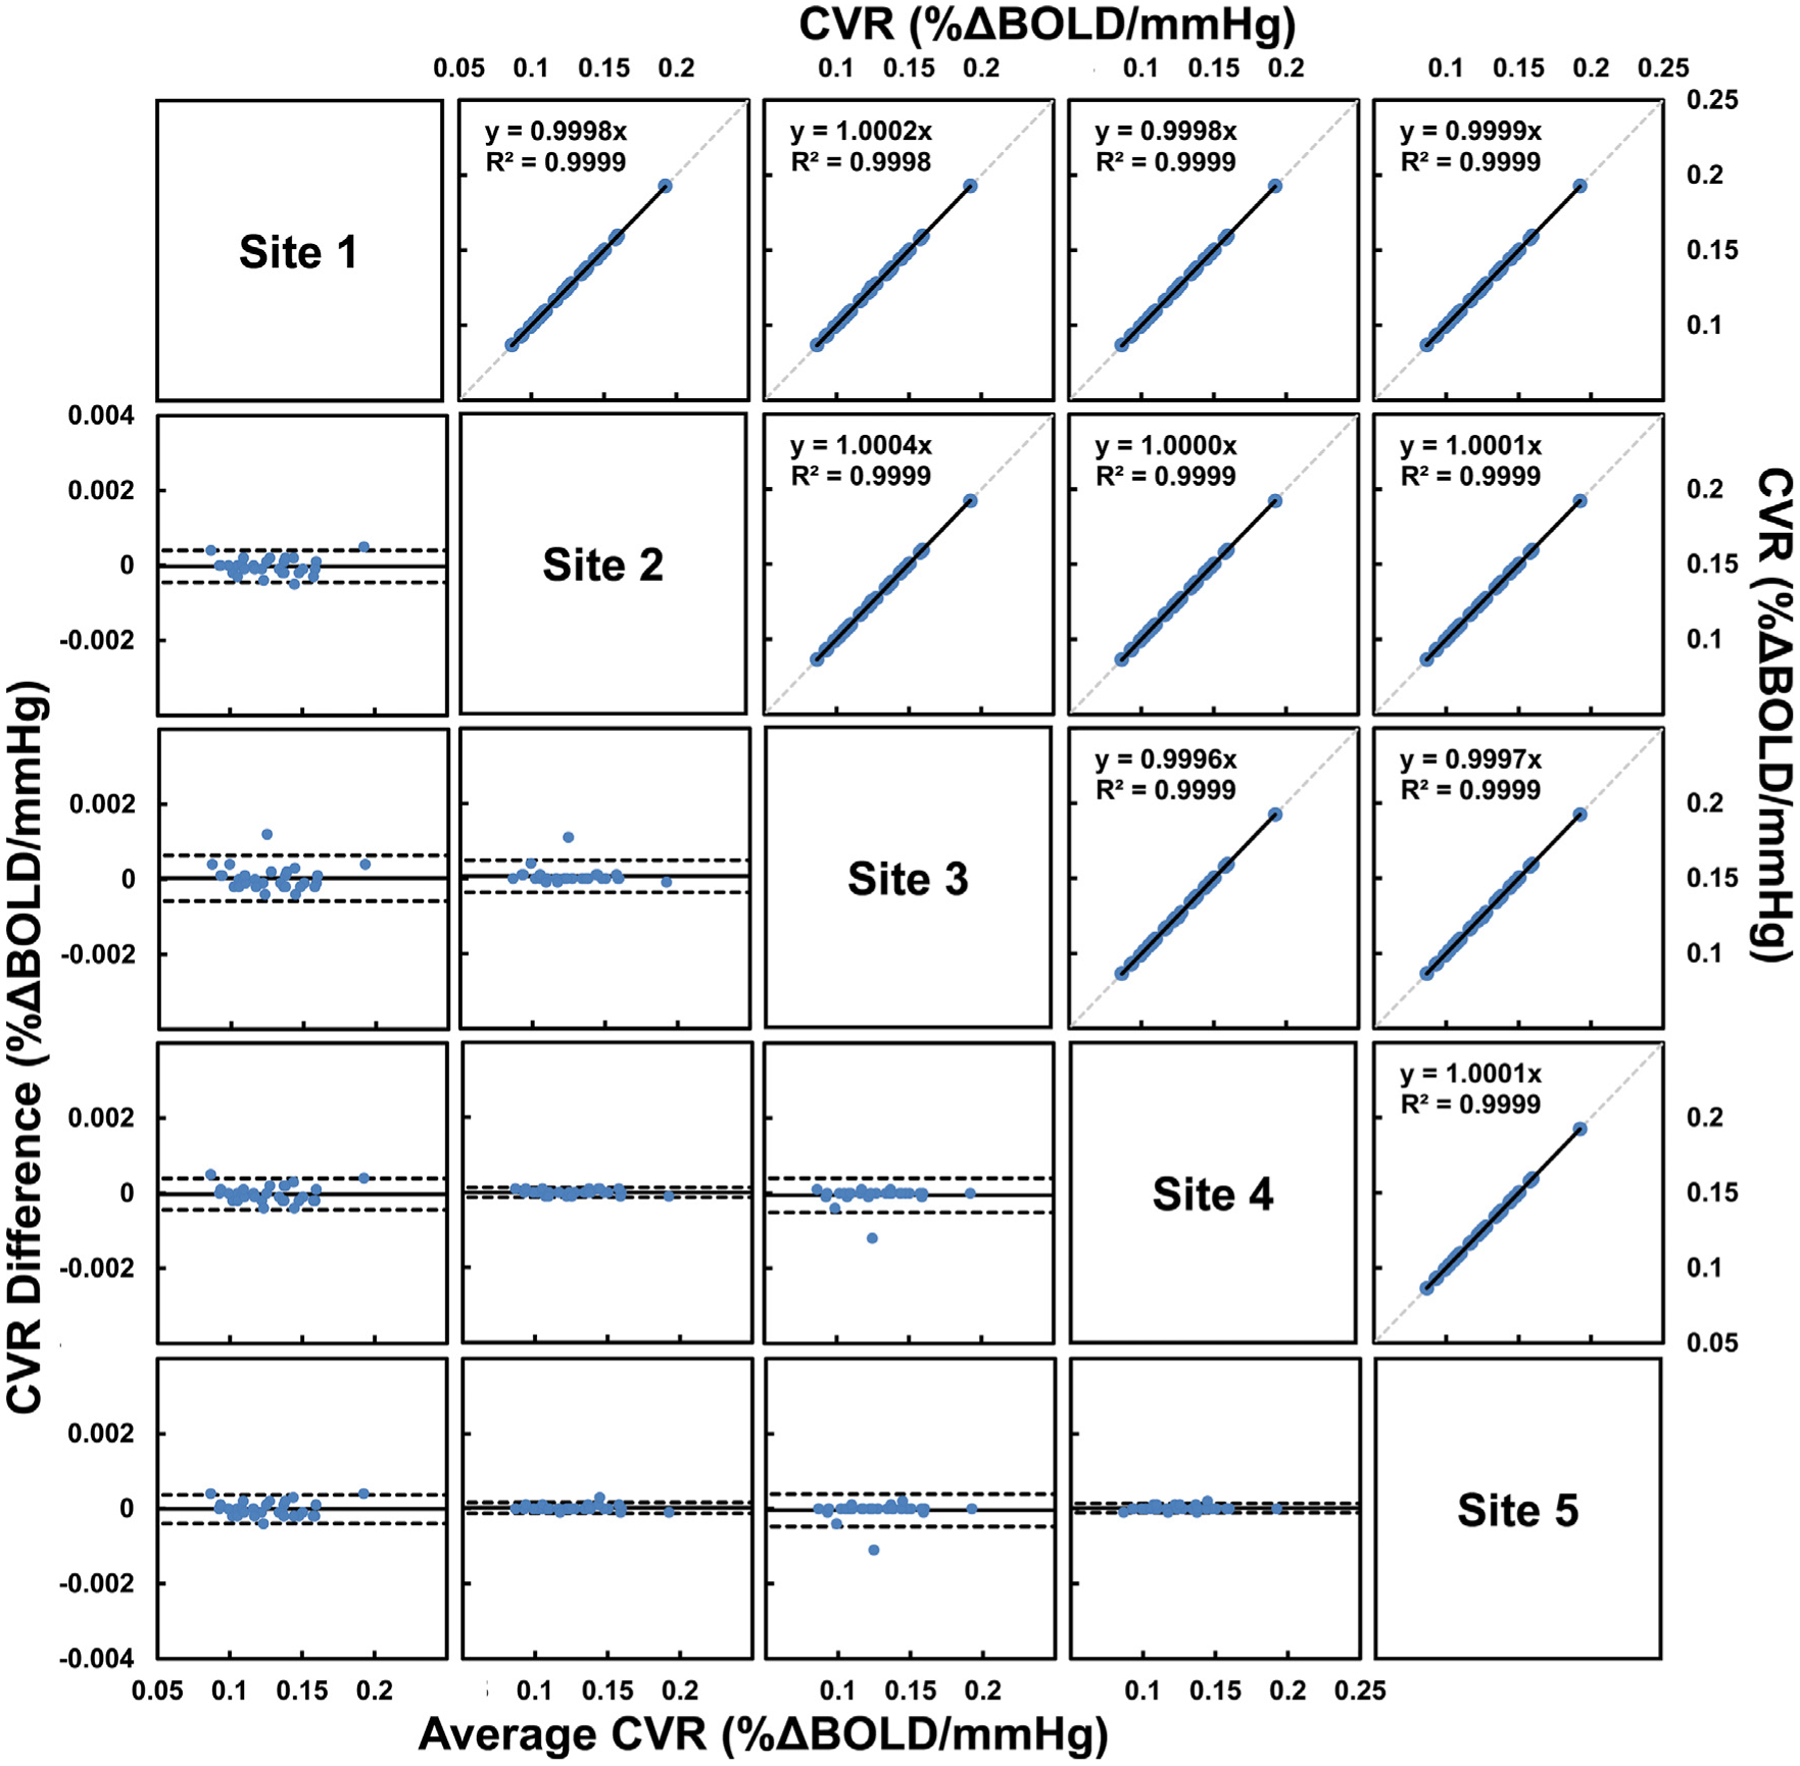
Comparisons of whole-brain CVR obtained from five different sites in the inter-rater reliability study (Study 1). Scatterplots are shown in the upper triangle panel with linear regression line in black and identity line as dashed gray line. Bland-Altman plots are shown in the lower triangle panel with black lines indicate mean and dashed lines indicates 95% confidence interval. Each blue dot represents one subject.
Table 2.
Summary of the inter-rater, inter-scanner and inter-session reproducibility of the study.
| Whole-brain | Frontal | Parietal | Temporal | Limbic | Occipital | Insula | BasalGang | Thalamus | White matter | |
|---|---|---|---|---|---|---|---|---|---|---|
| Inter-rater reliability | ||||||||||
| CoV (%) | 0.08±0.08 | 0.34±0.95 | 0.50±1.56 | 0.49±1.03 | 0.33±0.35 | 0.88±0.92 | 0.21±0.21 | 0.22±0.37 | 0.16±0.11 | 0.41±1.17 |
| ICCAA | 0.9999 | 0.9977 | 09976 | 0.9995 | 0.9970 | 0.9999 | 0.9999 | 0.9999 | 0.9997 | 0.9972 |
| Inter-scanner reproducibility | ||||||||||
| CoV (%) | 6.90±5.08 | 7.99±5.93 | 8.21±6.61 | 7.53±5.56 | 8.46±7.87 | 7.92±6.96 | 12.71±13.32 | 10.27±9.56 | 4.69±4.39 | 12.04±8.01 |
| ICCC | 0.8498 | 0.9185 | 0.8528 | 0.8052 | 0.8872 | 0.8068 | 0.8364 | 0.9175 | 0.8687 | 0.6592 |
| Test-retest repeatability | ||||||||||
| CoV (%) | 17.09±16.28 | 15.92±13.29 | 18.14±10.89 | 16.66±14.60 | 17.82±16.05 | 19.95±12.23 | 16.98±17.17 | 17.45±19.20 | 18.58±16.59 | 22.65±20.45 |
| ICCAA | 0.6568 | 0.7658 | 0.7427 | 0.7097 | 0.7281 | 0.6375 | 0.7542 | 0.7729 | 0.7139 | 0.4506 |
3.2. Inter-scanner reproducibility
Figure 2a showed the CVR maps obtained from a representative subject at each session of each scanner. Visual inspection suggested good agreement between the scanners. Scatter plot and Bland-Altman plot of whole-brain CVR for 10 individuals imaged at two different scanners are shown in Figure 2b and 2c, respectively. Mean whole-brain CVR of the 10 healthy young subjects was 0.133 ± 0.029 % ΔBOLD/mmHg and 0.126 ± 0.025 % ΔBOLD/mmHg from the Philips scanner and Siemen scanner, respectively, with no significant difference between them (p = 0.16). Inter-scanner CoV was 6.90 ± 5.08% for whole-brain CVR values, and ranged from 4.69 % to 12.71 % in major brain regions (see Table 2). ICCC of whole-brain CVR measures from the two scanners was found to be 0.8498, p = 0.0005. ICCC of regional CVR values between two scanners ranged from 0.8052 to 0.9185 (see Table 2), indicating good to excellent reproducibility.
Figure 2.
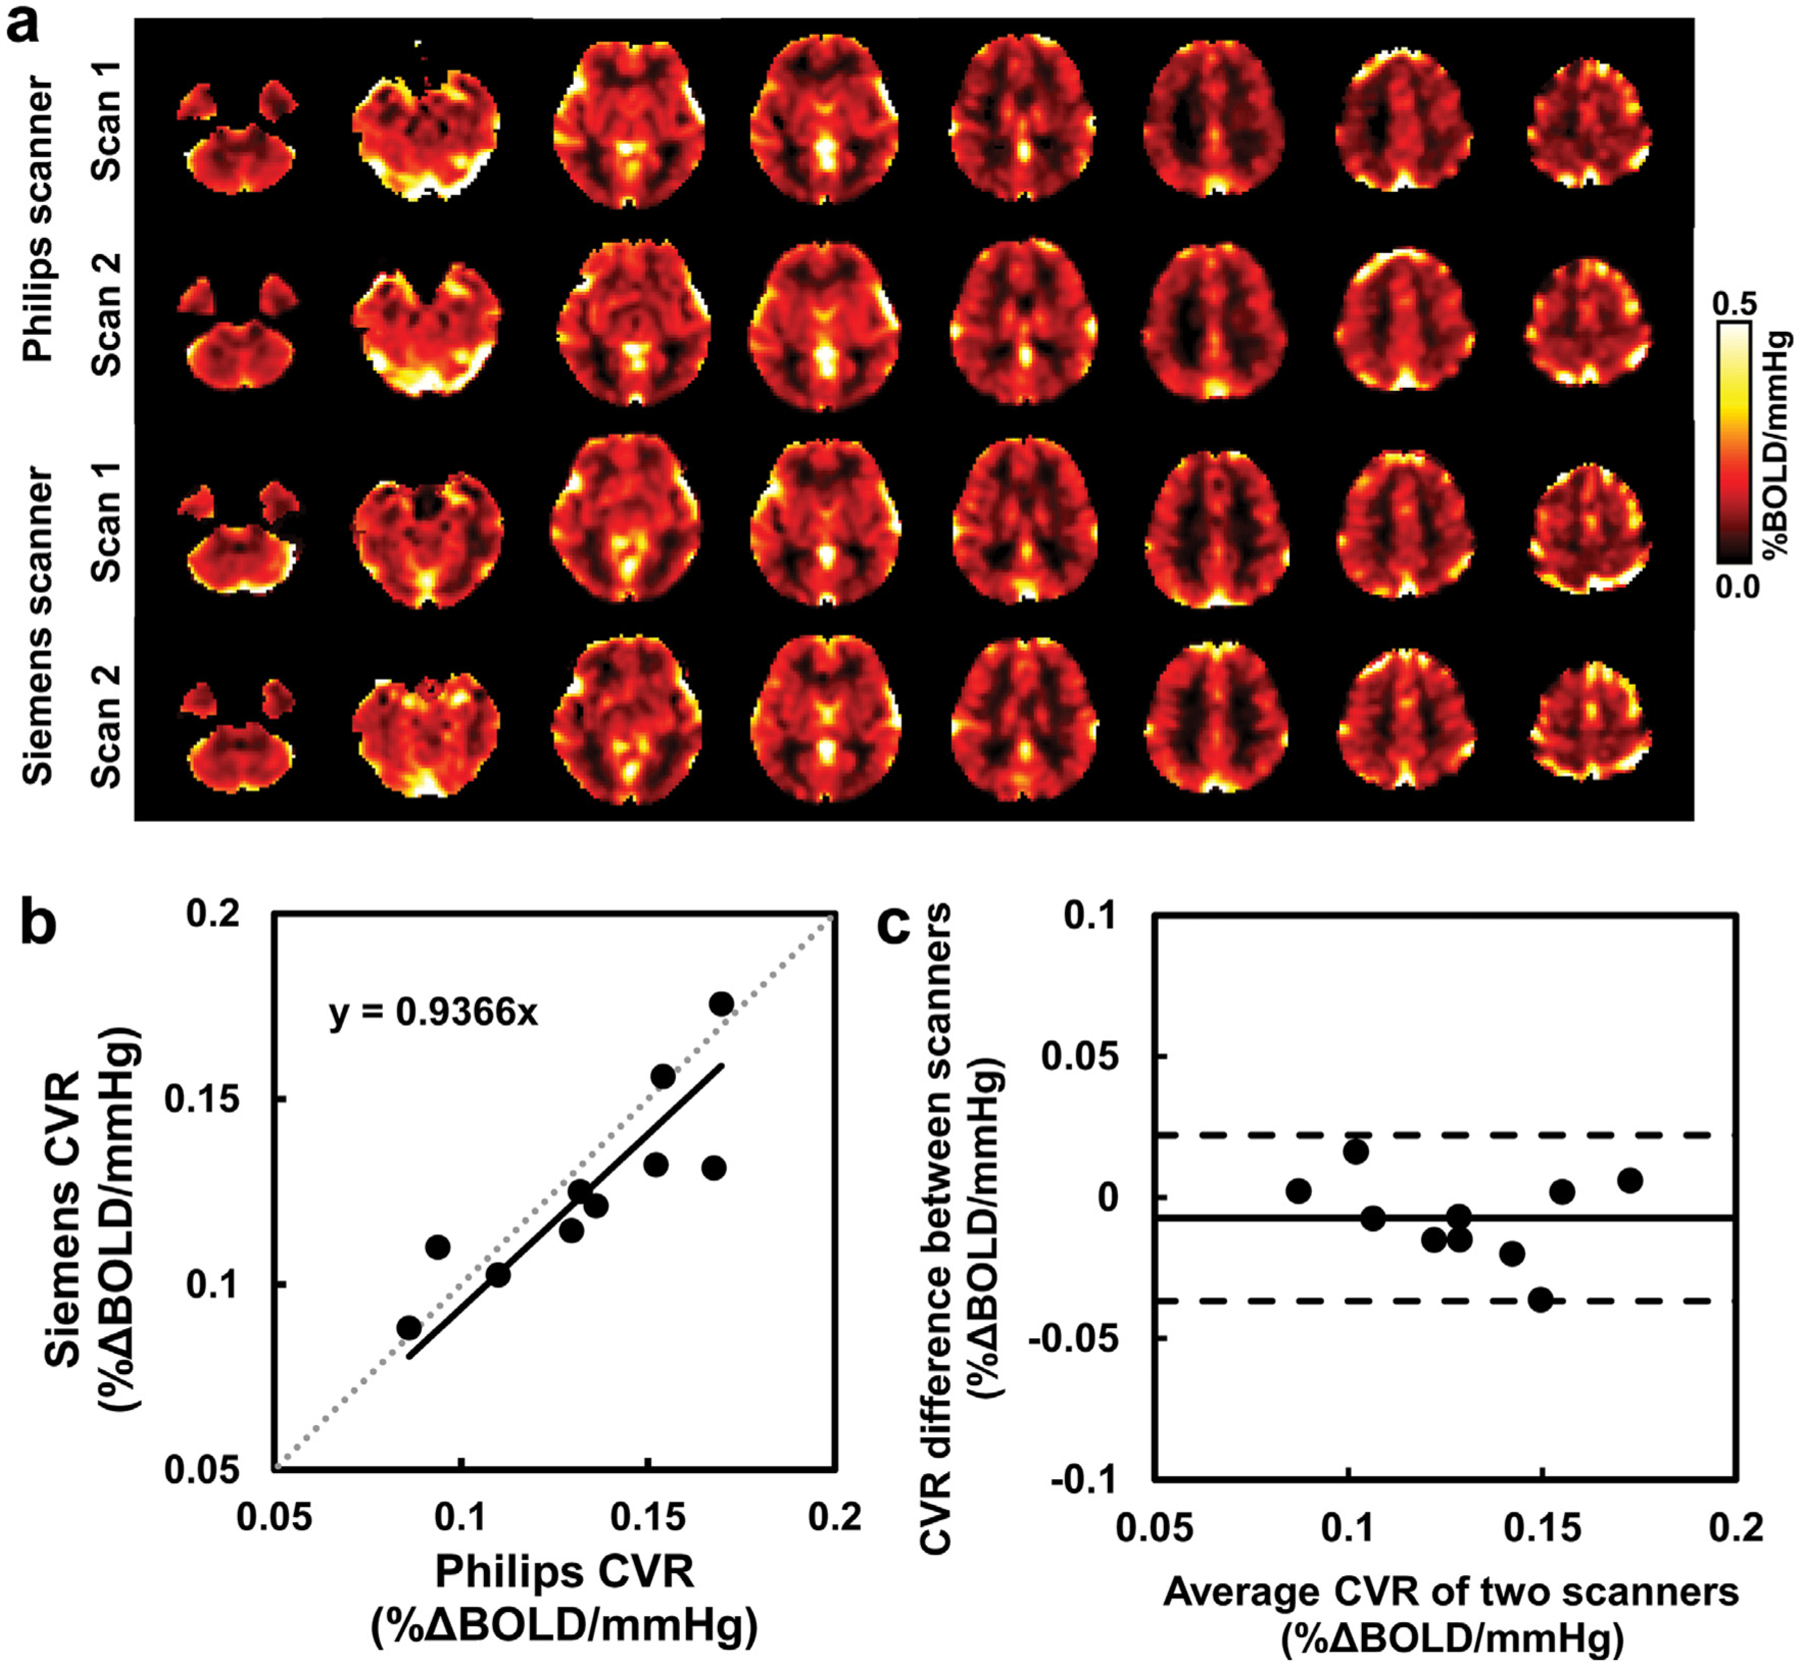
Comparisons of whole-brain CVR obtained from two scanners in the inter-scanner reproducibility study (Study 2). (a) CVR maps of a representative subject at different sessions of different scanners. (b) Scatterplot of the whole-brain CVR measures with linear regression line in black and identity line as dashed gray line. (c) Bland-Altman plot of the whole-brain CVR measures with black lines indicate mean and dashed lines indicates 95% confidence interval. Each dot represents data from one subject.
Mean basal EtCO2 of the 10 subjects was 38.42 ± 3.57 mmHg and 39.15 ± 3.57 mmHg from the Philips scanner and Siemens scanner, respectively. Mean EtCO2 change (ΔEtCO2) in response to the 5% CO2 inhalation was 9.59 ± 1.68 mmHg and 9.47 ± 1.26 mmHg, respectively. Mean whole-brain BOLD percent signal change (% ΔBOLD) due to CO2 inhalation was 1.31 ± 0.37% and 1.23 ± 0.25%, respectively. No significant inter-scanner differences were found for these parameters (p > 0.24). Inter-scanner CoV and ICCC of these measures from the two scanners are shown in Table 3.
Table 3.
Summary of the basal EtCO2, ΔEtCO2 and ΔBOLD results in the inter-scanner and inter-session reproducibility studies.
| Basal EtCO2 (mmHg) | ΔEtCO2 (mmHg) | %ΔBOLD (%) | |
|---|---|---|---|
| Inter-scanner reproducibility | |||
| CoV (%) | 3.00±2.13 | 6.47±3.74 | 11.43±8.82 |
| ICCC | 0.8670 | 0.7215 | 0.6886 |
| Test-retest repeatability | |||
| CoV (%) | 18.29±17.12 | 18.79±11.39 | 18.51±17.30 |
| ICCAA | 0.6498 | 0.7152 | 0.7429 |
Additionally, same-day inter-session (with repositioning) analysis in the 10 subjects showed that for whole-brain CVR measures, inter-session CoV was 6.30 ± 8.97% for the Philips scanner, and 7.39 ± 7.03% for the Siemens scanner, with no significant difference between them (p = 0.86). Inter-session ICCAA was 0.8744, p < 0.0001 for the Philips scanner, and 0.7781, p = 0.001 for the Siemens scanner. For the Philips sessions, same day inter-session CoV was 1.59 ± 1.51%, 5.95 ± 6.44% and 9.58 ± 6.14% for basal EtCO2, ΔEtCO2 and % ΔBOLD, respectively, with ICCAA of 0.9127, 0.7845 and 0.9359, respectively. For the Siemens sessions, same day inter-session CoV was 2.63 ± 2.54%, 6.38 ± 4.28% and 14.34 ± 11.56% for basal EtCO2, ΔEtCO2 and % ΔBOLD, respectively, with ICCAA of 0.7571, 0.7890 and 0.5840, respectively. No significant differences between the ICC values of the two scanners were found for any of these parameters (p > 0.19).
3.3. Test-retest repeatability
Figure 3 illustrates test and retest whole-brain CVR measures in 18 subjects across 4 sites. Mean whole-brain CVR of the 18 elderly subjects was 0.109 ± 0.037 % ΔBOLD/mmHg and 0.111 ± 0.040 % ΔBOLD/mmHg from the test-retest scans, respectively, with no significant difference between them (p = 0.90). Test-retest CoV was 17.09 ± 16.28% for whole-brain CVR values, and ranged from 15.92% to 22.65% in major brain regions (see Table 2). ICCAA between test and retest whole-brain CVR measures was found to be 0.6568, p = 0.0014. ICCAA of regional CVR values between the two measures ranged from 0.4506 to 0.7729 (see Table 2), indicating moderate to good repeatability in whole-brain and gray matter regions. There was not a site effect in the CoV values for the four sites.
Figure 3.
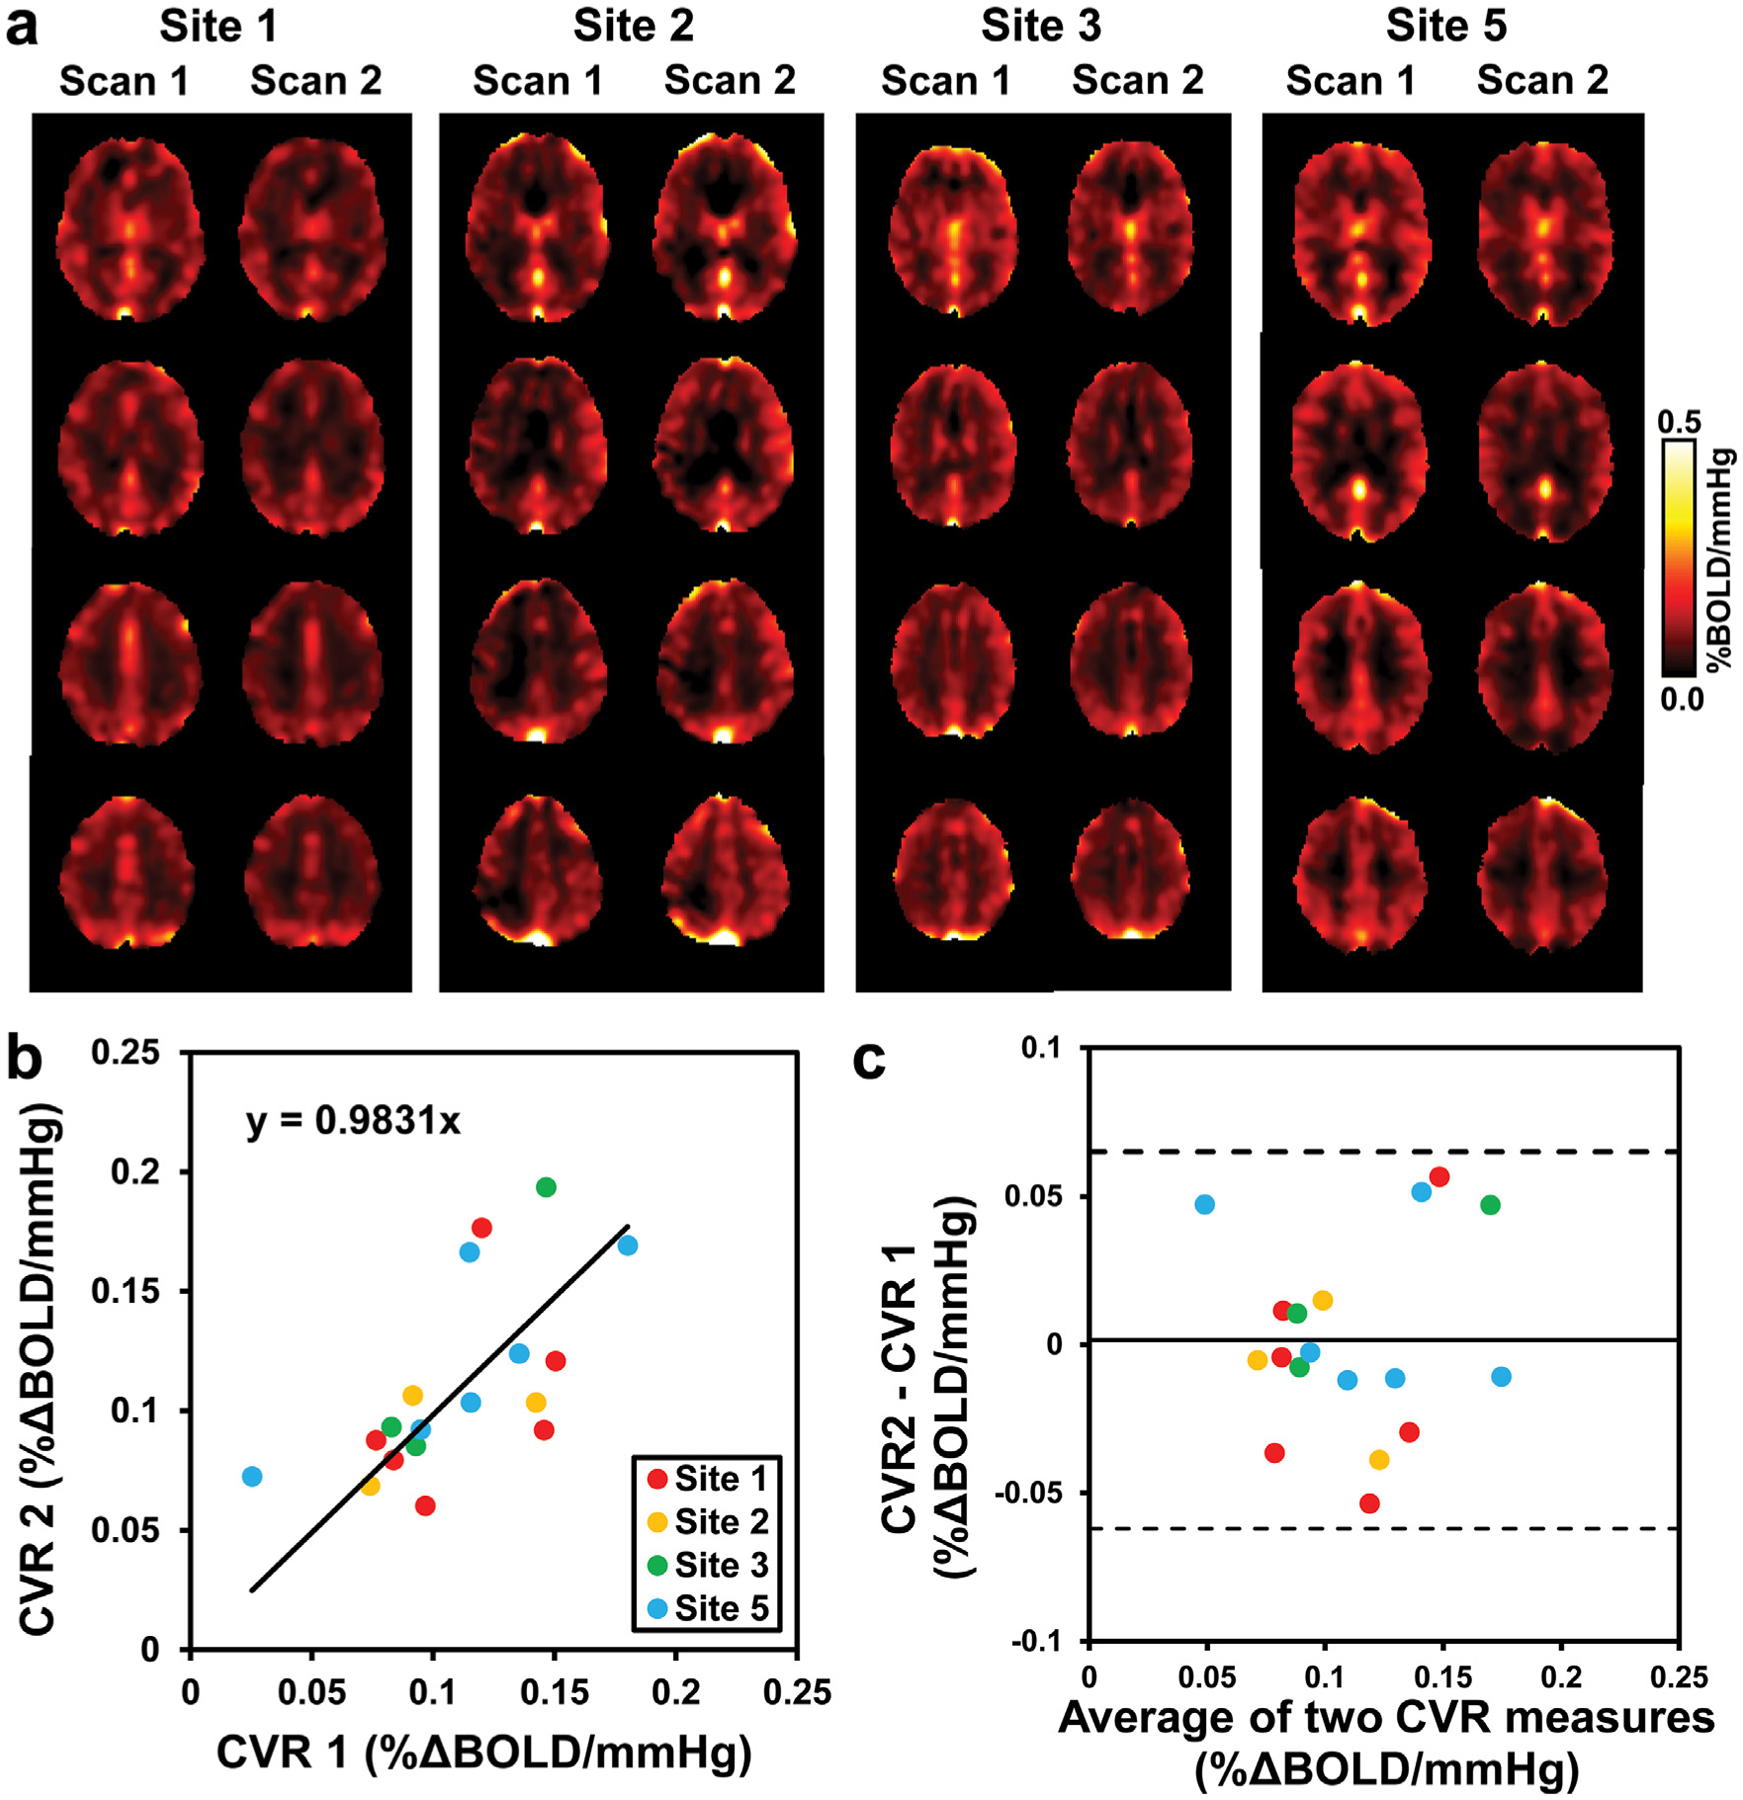
Comparisons of whole-brain CVR obtained from different days in the test-retest repeatability study (Study 3). (a) CVR maps of one representative subject from each site at different days. (b) Scatterplot of the whole-brain CVR measures with linear regression line in black and identity line as dashed gray line. (c) Bland-Altman plot of the whole-brain CVR measures with black lines indicate mean and dashed lines indicates 95% confidence interval. Each dot represents data from one subject. Data from different sites are shown in different colors.
Mean basal EtCO2 of the 18 subjects was 38.91 ± 8.08 mmHg and 40.82 ± 5.59 mmHg from the test-retest scans, respectively. Mean ΔEtCO2 was 8.72 ± 2.64 mmHg and 8.79 ± 2.67 mmHg, respectively. Mean % ΔBOLD was 0.80 ± 0.36% and 0.91 ± 0.39%, respectively. No significant test-retest differences were found for these parameters (p > 0.24). Test-retest CoV was 7.12 ± 17.0%, 16.37 ± 15.80% and 32.14 ± 241.85% for basal EtCO2, ΔEtCO2 and % ΔBOLD, respectively, with ICCAA of 0.4666, 0.5392 and 0.4919, respectively.
4. Discussion
In the present work we performed a series of studies to evaluate the variability, reliability and reproducibility of CVR quantification using BOLD MRI with hypercapnia inhalation, which provides important benchmarks for CO2-CVR as a quantitative biomarker for the future clinical studies. We focused on instrumental validation of three biomarker properties that would be essential to applying CVR to a large multi-center trial: inter-rater reliability, inter-scanner reproducibility, and test-retest repeatability.
4.1. Inter-rater reliability
Inter-rater reliability was evaluated by comparing the quantitative CVR values obtained by raters at five different sites analyzing the same CO2-CVR data. With written instructions and a training webinar, all sites were able to process the CO2-CVR data independently using the CVR-MRICloud analysis pipeline. Our results showed that ICC of absolute agreement of CVR values across all participating sites was above 0.997 for whole-brain and major brain regions, reflecting excellent inter-rater reliability in CO2-CVR quantification. The variability in the CVR results originates from a manual step in the processing pipeline, which involves the selection of the segment of the CO2 trace to be used. Slight variations in this “CO2 trimming” step, such as how much extra recording to be included before the first CO2 inhalation period and after the last CO2 inhalation period decided by each rater, could affect the determination of the optimal time-shift between EtCO2 and BOLD signal time courses, which in turn influences the CVR value. However, our results suggested that this rater-dependence has minimal effects in CVR quantification. There has been no study in literature that examined the inter-rater reliability of CO2-CVR quantification previously, so our study provided the first reference for the reliability of CO2-CVR quantifications using the CVR-MRICloud tool (Baker et al., 2019).
4.2. Inter-scanner reproducibility
Inter-scanner reliability was evaluated by comparing quantitative CVR values obtained from a group of young individuals scanned on two different MRI scanners on the same day. Standardization of MRI protocols across vendors is the first step in virtually all MRI techniques for large-scale, multi-site studies (Jack et al., 2008). Due to the differences in hardware specifications and software programming environments across scanners, it is not possible to match every parameter between the BOLD MRI protocols of the two vendors. For the BOLD MRI sequence, the most important components are TR, TE and FA. We used the harmonized CVR protocols of the MarkVCID study (Lu et al., 2021), where TR/TE/FA are identical across vendors and the other parameters are also maximally consistent. Whole-brain CVR measures were found to be highly consistent between the Philips and Siemens systems, with ICCC of 0.85 and CoV of 6.9%, which is comparable to the same-day within scanner, inter-session ICCAA and CoV obtained from the same subjects. This inter-scanner CoV of 6.9% for BOLD CVR is slightly higher than the anatomic measures, such as brain volume (around 4% for whole brain measures (Huppertz et al., 2010)) and ADC (around 5% (Magnotta et al., 2012)), but is lower than other functional measures, such as ASL (about 15% (Mutsaerts et al., 2015)) and functional MRI (about 20% (Friedman et al., 2006)). If using ASL CoV as reference, both whole-brain and regional CVR showed excellent inter-scanner reproducibility. To our knowledge, this is the first report of inter-scanner variability of CVR quantification. These results support the validity to pool data from multiple sites when using the MarkVCID CVR protocol (Lu et al., 2021) without increasing the heterogeneity of the imaging measurements.
4.3. Test-retest repeatability
Test-retest repeatability was evaluated by comparing CVR values obtained using the same MRI scanners on different days within an interval of < 2 weeks, an interval in which an individual’s vascular disease is unlikely to change. The evaluation of test-retest reliability of CVR measurements is critical for longitudinal studies, as it is important to interpret longitudinal changes observed with reference to intra-subject variations due to normal physiological variations and MRI acquisition differences such as subject and imaging slice positioning, shimming, and operator technique. Our results showed that test-retest CoV was about 17% of whole brain CVR and 16–20% of regional CVR across different sites, with ICC of absolute agreement to be 0.66 for whole-brain CVR and 0.65–0.78 for regional CVR in gray matter, when measured on different days within a two-week interval. These CoV values were higher than those observed in Study 2 (~7%), which were obtained by a single-site (i.e. the lead-author’s site) on the same day, but compared with typical fMRI measures, they are considered good. A previous study showed a CoV of about 11% and ICC of about 0.75 for CO2 CVR measured in 10 young subjects at a single site 3T scanner with 2-days interval (Leung et al., 2016). A single-site study on 19 healthy volunteers reported ICC of 0.81 and 0.66 for gray matter and white matter CVR, respectively, using a 1.5T scanner with a median range of 15 days apart (Kassner et al., 2010). Another single-site study on 15 healthy subjects reported CoV of 11.7–70.2% for gray matter CVR and 27.5–141.0% for white matter CVR in various brain regions using similar hypercapnia inhalation paradigm on a 1.5T scanner in two separate visits (Thrippleton et al., 2018).
The higher CoV observed in Study 3 relative to the inter-scanner variability shown in Study 2 may be attributed to several causes. Differences could reflect actual day-to-day variability over the interscan interval of up to 2 weeks. The correction of basal and ΔEtCO2 helped to reduce the day-to-day variation of EtCO2, as without this correction, CoV and ICCAA of the whole-brain CVR in Study 3 was 18.66 ± 17.33% and 0.4859, respectively. However, there are other sources that contribute to the day-to-day variability. In particular, we did not control the participants’ uptake of vasoactive drugs or beverages prior to the MRI scan. For example, it is known that caffeine can reduce CBF by up to 25% (Xu et al., 2015), thus consumption of coffee may alter the measured CVR value. Second, older subjects may reveal a higher inter-scan CoV due to a higher tendency to move or otherwise not comply with instructions (e.g. opening their mouths) as well as potentially greater underlying day-to-day variations in brain physiology. Finally, CO2-CVR testing requires the delivery of CO2 gas mixture inside the MRI scanner as well as recording of end-tidal CO2 trace. Thus, the skill level of the experimenter may play a role in the quality of the data (e.g. when the mouthpiece is not placed comfortably, the subject may have greater motion). This can affect the success rate and lead to data exclusion due to technical issues related to CO2 delivery and recording. It should also be mentioned that the CoV of CVR is much smaller than the CoV of % ΔBOLD in both the inter-scanner and test-retest studies. This is because the variations in BOLD signal changes are largely attributed to EtCO2 variations, especially ΔEtCO2 variations. Therefore, the calculated CVR values, which accounted for EtCO2 variations, have smaller CoV than % ΔBOLD alone.
Nonetheless, the observed CoV of approximately 17% is within the range of previous studies, and is less variable than typical task-fMRI measures (Clement and Belleville, 2009; Gountouna et al., 2010). Importantly, it should be emphasized that disease-related differences in CVR are often greater than 50% (Cantin et al., 2011; Sur et al., 2020; Yezhuvath et al., 2012). Thus, CVR still possesses the sensitivity in detecting pathological effects in brain diseases. Assuming a 15% difference in whole-brain CVR between cognitive impaired patients and healthy controls (Sur et al., 2020), with the CoV of 17%, 20 subjects are needed for each group to detect a significant group difference with a power of 0.8. Similarly, assuming a 25% difference in CVR between multiple sclerosis patients and healthy controls (Marshall et al., 2016), 8 subjects are needed for each group to detect a significant group difference with a power of 0.8. In future clinical trials, test-retest variability can be further reduced by improvements in experimental procedures such as control of uptake of vasoactive drugs and/or beverages prior to the MRI scan as well as enhanced training of personnel performing the CVR MRI measurement.
There are a few limitations of this study. First, the sample size of some sites in Study 3 is considered small. Therefore, no comparisons among the individual sites were performed due to this sample size limitation. Second, we focused on the reproducibility of CVR values, but did not study the CO2 bolus transit and response time which can also be a sensitive index in cerebrovascular diseases, especially in large vessel diseases. There are a few advanced CVR analysis methods that could be evaluated, which yield transit/delay maps and even functional connectivity maps (Bhogal et al., 2015; Blockley et al., 2011; Donahue et al., 2016; Hou et al., 2019). It should also be noted that there are two categories of CO2 delivery for CVR mapping (Liu et al., 2019), which are the fixed CO2 concentration in the inspired gas (Lu et al., 2014; Tancredi et al., 2014) and fixed CO2 concentration in the exhaled air (Slessarev et al., 2007; Wise et al., 2007). In this study we only evaluated the CVR mapping method using fixed CO2 concentration (5%) in the inspired gas. Compared with the fixed exhaled CO2 concentration, the fixed inspiration method is less expensive, involves less training and preparation for both the researcher and the participant, and troubleshooting is simpler. Therefore, it is thought to be more suited for multi-site studies where researchers are not always experienced with CVR mapping. In the MarkVCID study, the gas delivery packages were disseminated to all participating site by the lead site, following the item list published previously (Lu et al., 2014). The nose clip and mouthpiece setup were able to fit 32 and 64 channel head coils at all sites. Researchers in the participating site were trained on-site by the lead site for the procedure of the CVR experiment. With proper preparation prior to each experiment, the setup time of nose clip and mouthpiece for the subjects were 3–5min before the CVR scan. Out of the 40 CVR experiments in the scan-rescan reproducibility study, only two failed to provide usable datasets due to technical error (CO2 air was not delivered) and subject not cooperating (subject pushed mouthpiece out during the scan), suggesting the effectiveness of the training. The CVR analysis training were conducted as an online webinar, and all sites were able to follow the instructions and generate CVR mapping results.
5. Conclusion
The present study evaluated reliability of CVR quantification using CO2 inhalation and BOLD MR imaging. The CO2-CVR values obtained have demonstrated good inter-rater, inter-scanner, and test-retest reliabilities in healthy volunteers. These findings suggest that CO2-CVR can be a reliable imaging biomarker of vascular function in the brain, and provide important reference for its applications in future multi-site and longitudinal observational studies and clinical trials.
Acknowledgments
This study was supported in part by NIH UH3 NS100588 (to H.L.), NIH UH3 NS100598 (to A.C.), NIH UH3 NS100606 (to G.J.), NIH UH3 NS100605 (to S.S.), NIH UH3 NS100614 (to. D.W.), NIH U24 NS100591 (to S.G.), NIH R01 NS115771 (to P.L.), NIH R21 AG061851 (to P.L.), and NIH P41 EB031771 (to H.L.).
Footnotes
Declaration of Competing Interest
The authors have no conflicts of interest or financial disclosures to report.
CRediT authorship contribution statement
Peiying Liu: Conceptualization, Methodology, Software, Formal analysis, Investigation, Writing - original draft, Visualization, Funding acquisition. Dengrong Jiang: Investigation, Data Curation, Writing - review & editing. Marilyn Albert: Resources, Writing - review & editing, Supervision, Funding acquisition. Christopher E. Bauer: Formal analysis, Writing - review & editing. Arvind Caprihan: Conceptualization, Investigation, Resources, Writing - review & editing, Supervision, Project administration, Funding acquisition. Brian T. Gold: Conceptualization, Investigation, Resources, Writing - review & editing, Supervision, Project administration, Funding acquisition. Steven M. Greenberg: Conceptualization, Writing - review & editing, Project administration, Funding acquisition. Karl G. Helmer: Conceptualization, Data Curation, Writing - review & editing. Kay Jann: Investigation, Formal analysis, Data Curation, Writing - review & editing. Gregory Jicha: Resources, Writing - review & editing, Supervision, Funding acquisition. Pavel Rodriguez: Formal analysis, Writing - review & editing. Claudia L. Satizabal: Conceptualization, Investigation, Resources, Writing - review & editing, Supervision, Project administration. Sudha Seshadri: Resources, Writing - review & editing, Supervision, Funding acquisition. Herpreet Singh: Project administration. Jeffrey F. Thompson: Formal analysis, Writing - review & editing. Danny J.J. Wang: Conceptualization, Investigation, Resources, Writing - review & editing, Supervision, Project administration, Funding acquisition. Hanzhang Lu: Conceptualization, Methodology, Investigation, Resources, Writing - review & editing, Supervision, Project administration, Funding acquisition.
Data and code availability statement
The data and code used in this work will be made available upon request on a case-by-case basis after obtaining approval from the funding agency.
References
- Baker Z, Li Y, Liu P, Li Y, Miller M, Mori S, Lu H, 2019. CVR-MRICloud: an automated online tool for the processing of cerebrovascular reactivity (CVR) MRI data. In: Proceedings of ISMRM 27th Annual Meeting, Montreal, Canada, p. 239. [Google Scholar]
- Bhogal AA, Philippens ME, Siero JC, Fisher JA, Petersen ET, Luijten PR, Hoogduin H, 2015. Examining the regional and cerebral depth-dependent BOLD cerebrovascular reactivity response at 7T. Neuroimage 114, 239–248. [DOI] [PubMed] [Google Scholar]
- Bland JM, Altman DG, 1986. Statistical methods for assessing agreement between two methods of clinical measurement. Lancet 1, 307–310. [PubMed] [Google Scholar]
- Blockley NP, Driver ID, Francis ST, Fisher JA, Gowland PA, 2011. An improved method for acquiring cerebrovascular reactivity maps. Magn. Reson. Med 65, 1278–1286. [DOI] [PubMed] [Google Scholar]
- Bright MG, Donahue MJ, Duyn JH, Jezzard P, Bulte DP, 2011. The effect of basal vasodilation on hypercapnic and hypocapnic reactivity measured using magnetic resonance imaging. J. Cereb. Blood Flow Metab 31, 426–438. [DOI] [PMC free article] [PubMed] [Google Scholar]
- Cantin S, Villien M, Moreaud O, Tropres I, Keignart S, Chipon E, Le Bas JF, Warnking J, Krainik A, 2011. Impaired cerebral vasoreactivity to CO2 in Alzheimer’s disease using BOLD fMRI. Neuroimage 58, 579–587. [DOI] [PubMed] [Google Scholar]
- Chan ST, Evans KC, Rosen BR, Song TY, Kwong KK, 2015. A case study of magnetic resonance imaging of cerebrovascular reactivity: a powerful imaging marker for mild traumatic brain injury. Brain Inj. 29, 403–407. [DOI] [PMC free article] [PubMed] [Google Scholar]
- Chen JJ, Gauthier CJ, 2021. The Role of Cerebrovascular-Reactivity Mapping in Functional MRI: Calibrated fMRI and Resting-State fMRI. Front. Physiol 12, 657362. [DOI] [PMC free article] [PubMed] [Google Scholar]
- Clement F, Belleville S, 2009. Test-retest reliability of fMRI verbal episodic memory paradigms in healthy older adults and in persons with mild cognitive impairment. Hum. Brain Mapp 30, 4033–4047. [DOI] [PMC free article] [PubMed] [Google Scholar]
- Davis TL, Kwong KK, Weisskoff RM, Rosen BR, 1998. Calibrated functional MRI: mapping the dynamics of oxidative metabolism. Proc. Natl. Acad. Sci. U. S. A 95, 1834–1839. [DOI] [PMC free article] [PubMed] [Google Scholar]
- De Vis JB, Hendrikse J, Bhogal A, Adams A, Kappelle LJ, Petersen ET, 2015a. Age-related changes in brain hemodynamics; A calibrated MRI study. Hum. Brain Mapp 36, 3973–3987. [DOI] [PMC free article] [PubMed] [Google Scholar]
- De Vis JB, Petersen ET, Bhogal A, Hartkamp NS, Klijn CJ, Kappelle LJ, Hendrikse J, 2015b. Calibrated MRI to evaluate cerebral hemodynamics in patients with an internal carotid artery occlusion. J. Cereb. Blood Flow Metab 35, 1015–1023. [DOI] [PMC free article] [PubMed] [Google Scholar]
- Donahue MJ, Ayad M, Moore R, van Osch M, Singer R, Clemmons P, Strother M, 2013. Relationships between hypercarbic reactivity, cerebral blood flow, and arterial circulation times in patients with moyamoya disease. J. Magn. Reson. Imaging doi: 10.1002/jmri.24070, In-press. [DOI] [PMC free article] [PubMed] [Google Scholar]
- Donahue MJ, Faraco CC, Strother MK, Chappell MA, Rane S, Dethrage LM, Hendrikse J, Siero JC, 2014. Bolus arrival time and cerebral blood flow responses to hypercarbia. J. Cereb. Blood Flow Metab 34, 1243–1252. [DOI] [PMC free article] [PubMed] [Google Scholar]
- Donahue MJ, Stevens RD, de Boorder M, Pekar JJ, Hendrikse J, van Zijl PC, 2009. Hemodynamic changes after visual stimulation and breath holding provide evidence for an uncoupling of cerebral blood flow and volume from oxygen metabolism. J. Cereb. Blood Flow Metab 29, 176–185. [DOI] [PMC free article] [PubMed] [Google Scholar]
- Donahue MJ, Strother MK, Lindsey KP, Hocke LM, Tong Y, Frederick BD, 2016. Time delay processing of hypercapnic fMRI allows quantitative parameterization of cerebrovascular reactivity and blood flow delays. J. Cereb. Blood Flow Metab 36, 1767–1779. [DOI] [PMC free article] [PubMed] [Google Scholar]
- Fierstra J, van Niftrik B, Piccirelli M, Burkhardt JK, Pangalu A, Kocian R, Valavanis A, Weller M, Regli L, Bozinov O, 2016. Altered intraoperative cerebrovascular reactivity in brain areas of high-grade glioma recurrence. Magn. Reson. Imaging 34, 803–808. [DOI] [PubMed] [Google Scholar]
- Friedman L, Glover GH, Fbirn C, 2006. Reducing interscanner variability of activation in a multicenter fMRI study: controlling for signal-to-fluctuation-noise-ratio (SFNR) differences. Neuroimage 33, 471–481. [DOI] [PubMed] [Google Scholar]
- Gauthier CJ, Madjar C, Desjardins-Crepeau L, Bellec P, Bherer L, Hoge RD, 2013. Age dependence of hemodynamic response characteristics in human functional magnetic resonance imaging. Neurobiol. Aging 34, 1469–1485. [DOI] [PubMed] [Google Scholar]
- Geranmayeh F, Wise RJ, Leech R, Murphy K, 2015. Measuring vascular reactivity with breath-holds after stroke: a method to aid interpretation of group-level BOLD signal changes in longitudinal fMRI studies. Hum. Brain Mapp 36, 1755–1771. [DOI] [PMC free article] [PubMed] [Google Scholar]
- Gountouna VE, Job DE, McIntosh AM, Moorhead TW, Lymer GK, Whalley HC, Hall J, Waiter GD, Brennan D, McGonigle DJ, Ahearn TS, Cavanagh J, Condon B, Hadley DM, Marshall I, Murray AD, Steele JD, Wardlaw JM, Lawrie SM, 2010. Functional Magnetic Resonance Imaging (fMRI) reproducibility and variance components across visits and scanning sites with a finger tapping task. Neuroimage 49, 552–560. [DOI] [PubMed] [Google Scholar]
- Greenberg SM, 2006. Small vessels, big problems. N. Engl. J. Med 354, 1451–1453. [DOI] [PubMed] [Google Scholar]
- Gupta A, Chazen JL, Hartman M, Delgado D, Anumula N, Shao H, Mazumdar M, Segal AZ, Kamel H, Leifer D, Sanelli PC, 2012. Cerebrovascular reserve and stroke risk in patients with carotid stenosis or occlusion: a systematic review and meta-analysis. Stroke 43, 2884–2891. [DOI] [PMC free article] [PubMed] [Google Scholar]
- Han JS, Mandell DM, Poublanc J, Mardimae A, Slessarev M, Jaigobin C, Fisher JA, Mikulis DJ, 2008. BOLD-MRI cerebrovascular reactivity findings in cocaine-induced cerebral vasculitis. Nat. Clin. Pract. Neurol 4, 628–632. [DOI] [PubMed] [Google Scholar]
- Hoge RD, Atkinson J, Gill B, Crelier GR, Marrett S, Pike GB, 1999. Investigation of BOLD signal dependence on cerebral blood flow and oxygen consumption: the deoxyhemoglobin dilution model. Magn. Reson. Med 42, 849–863. [DOI] [PubMed] [Google Scholar]
- Hou X, Liu P, Gu H, Chan M, Li Y, Peng SL, Wig G, Yang Y, Park D, Lu H, 2019. Estimation of brain functional connectivity from hypercapnia BOLD MRI data: Validation in a lifespan cohort of 170 subjects. Neuroimage 186, 455–463. [DOI] [PMC free article] [PubMed] [Google Scholar]
- Hou X, Liu P, Li Y, Jiang D, De Vis JB, Lin Z, Sur S, Baker Z, Mao D, Ravi H, Rodrigue K, Albert M, Park DC, Lu H, 2020. The association between BOLD-based cerebrovascular reactivity (CVR) and end-tidal CO2 in healthy subjects. Neuroimage 207, 116365. [DOI] [PMC free article] [PubMed] [Google Scholar]
- Hua J, Stevens RD, Huang AJ, Pekar JJ, van Zijl PC, 2011. Physiological origin for the BOLD poststimulus undershoot in human brain: vascular compliance versus oxygen metabolism. J. Cereb. Blood Flow Metab 31, 1599–1611. [DOI] [PMC free article] [PubMed] [Google Scholar]
- Huppertz HJ, Kroll-Seger J, Kloppel S, Ganz RE, Kassubek J, 2010. Intra- and inter-scanner variability of automated voxel-based volumetry based on a 3D probabilistic atlas of human cerebral structures. Neuroimage 49, 2216–2224. [DOI] [PubMed] [Google Scholar]
- Jack CR Jr., Bernstein MA, Fox NC, Thompson P, Alexander G, Harvey D, Borowski B, Britson PJ, J LW, Ward C, Dale AM, Felmlee JP, Gunter JL, Hill DL, Killiany R, Schuff N, Fox-Bosetti S, Lin C, Studholme C, DeCarli CS, Krueger G, Ward HA, Metzger GJ, Scott KT, Mallozzi R, Blezek D, Levy J, Debbins JP, Fleisher AS, Albert M, Green R, Bartzokis G, Glover G, Mugler J, Weiner MW, 2008. The Alzheimer’s Disease Neuroimaging Initiative (ADNI): MRI methods. J. Magn. Reson. Imaging 27, 685–691. [DOI] [PMC free article] [PubMed] [Google Scholar]
- Kannurpatti SS, Biswal BB, 2008. Detection and scaling of task-induced fMRI-BOLD response using resting state fluctuations. Neuroimage 40, 1567–1574. [DOI] [PMC free article] [PubMed] [Google Scholar]
- Kassner A, Winter JD, Poublanc J, Mikulis DJ, Crawley AP, 2010. Blood-oxygen level dependent MRI measures of cerebrovascular reactivity using a controlled respiratory challenge: reproducibility and gender differences. J. Magn. Reson. Imaging 31, 298–304. [DOI] [PubMed] [Google Scholar]
- Kenney K, Amyot F, Haber M, Pronger A, Bogoslovsky T, Moore C, Diaz-Arrastia R, 2016. Cerebral Vascular Injury in Traumatic Brain Injury. Exp. Neurol 275 (Pt 3), 353–366. [DOI] [PubMed] [Google Scholar]
- Koo TK, Li MY, 2016. A Guideline of Selecting and Reporting Intraclass Correlation Coefficients for Reliability Research. J Chiropr Med 15, 155–163. [DOI] [PMC free article] [PubMed] [Google Scholar]
- Krainik A, Hund-Georgiadis M, Zysset S, von Cramon DY, 2005. Regional impairment of cerebrovascular reactivity and BOLD signal in adults after stroke. Stroke 36, 1146–1152. [DOI] [PubMed] [Google Scholar]
- Leung J, Kim JA, Kassner A, 2016. Reproducibility of cerebrovascular reactivity measures in children using BOLD MRI. J. Magn. Reson. Imaging 43, 1191–1195. [DOI] [PubMed] [Google Scholar]
- Liu P, De Vis JB, Lu H, 2019. Cerebrovascular reactivity (CVR) MRI with CO2 challenge: A technical review. Neuroimage 187, 104–115. [DOI] [PMC free article] [PubMed] [Google Scholar]
- Liu P, Hebrank AC, Rodrigue KM, Kennedy KM, Park DC, Lu H, 2013a. A comparison of physiologic modulators of fMRI signals. Hum. Brain Mapp 34, 2078–2088. [DOI] [PMC free article] [PubMed] [Google Scholar]
- Liu P, Hebrank AC, Rodrigue KM, Kennedy KM, Section J, Park DC, Lu H, 2013b. Age-related differences in memory-encoding fMRI responses after accounting for decline in vascular reactivity. Neuroimage 78, 415–425. [DOI] [PMC free article] [PubMed] [Google Scholar]
- Lu H, Kashani AH, Arfanakis K, Caprihan A, DeCarli C, Gold BT, Li Y, Maillard P, Satizabal CL, Stables L, Wang DJJ, Corriveau RA, Singh H, Smith EE, Fischl B, van der Kouwe A, Schwab K, Helmer KG, Greenberg SM, Mark VC, 2021. MarkVCID cerebral small vessel consortium: II. Neuroimaging protocols. Alzheimers Dement 17, 716–725. [DOI] [PMC free article] [PubMed] [Google Scholar]
- Lu H, Liu P, Yezhuvath U, Cheng Y, Marshall O, Ge Y, 2014. MRI mapping of cerebrovascular reactivity via gas inhalation challenges. J. Vis. Exp (94) 52306. [DOI] [PMC free article] [PubMed] [Google Scholar]
- Lu H, Xu F, Rodrigue KM, Kennedy KM, Cheng Y, Flicker B, Hebrank AC, Uh J, Park DC, 2011. Alterations in cerebral metabolic rate and blood supply across the adult lifespan. Cereb. Cortex 21, 1426–1434. [DOI] [PMC free article] [PubMed] [Google Scholar]
- Magnotta VA, Matsui JT, Liu D, Johnson HJ, Long JD, Bolster BD Jr., Mueller BA, Lim K, Mori S, Helmer KG, Turner JA, Reading S, Lowe MJ, Aylward E, Flashman LA, Bonett G, Paulsen JS, 2012. Multicenter reliability of diffusion tensor imaging. Brain Connect 2, 345–355. [DOI] [PMC free article] [PubMed] [Google Scholar]
- Mandell DM, Han JS, Poublanc J, Crawley AP, Stainsby JA, Fisher JA, Mikulis DJ, 2008. Mapping cerebrovascular reactivity using blood oxygen level-dependent MRI in Patients with arterial steno-occlusive disease: comparison with arterial spin labeling MRI. Stroke 39, 2021–2028. [DOI] [PubMed] [Google Scholar]
- Marshall O, Chawla S, Lu H, Pape L, Ge Y, 2016. Cerebral blood flow modulation insufficiency in brain networks in multiple sclerosis: A hypercapnia MRI study. J. Cereb. Blood Flow Metab 36, 2087–2095. [DOI] [PMC free article] [PubMed] [Google Scholar]
- Marshall O, Lu H, Brisset JC, Xu F, Liu P, Herbert J, Grossman RI, Ge Y, 2014. Impaired cerebrovascular reactivity in multiple sclerosis. JAMA Neurol. 71, 1275–1281. [DOI] [PMC free article] [PubMed] [Google Scholar]
- Marstrand JR, Garde E, Rostrup E, Ring P, Rosenbaum S, Mortensen EL, Larsson HB, 2002. Cerebral perfusion and cerebrovascular reactivity are reduced in white matter hyperintensities. Stroke 33, 972–976. [DOI] [PubMed] [Google Scholar]
- McKetton L, Cohn M, Tang-Wai DF, Sobczyk O, Duffin J, Holmes KR, Poublanc J, Sam K, Crawley AP, Venkatraghavan L, Fisher JA, Mikulis DJ, 2019. Cerebrovascular Resistance in Healthy Aging and Mild Cognitive Impairment. Front Aging Neurosci 11, 79. [DOI] [PMC free article] [PubMed] [Google Scholar]
- Mikulis DJ, Krolczyk G, Desal H, Logan W, Deveber G, Dirks P, Tymianski M, Crawley A, Vesely A, Kassner A, Preiss D, Somogyi R, Fisher JA, 2005. Preoperative and postoperative mapping of cerebrovascular reactivity in moyamoya disease by using blood oxygen level-dependent magnetic resonance imaging. J. Neurosurg 103, 347–355. [DOI] [PubMed] [Google Scholar]
- Mutsaerts HJ, van Osch MJ, Zelaya FO, Wang DJ, Nordhoy W, Wang Y, Wastling S, Fernandez-Seara MA, Petersen ET, Pizzini FB, Fallatah S, Hendrikse J, Geier O, Gunther M, Golay X, Nederveen AJ, Bjornerud A, Groote IR, 2015. Multi-vendor reliability of arterial spin labeling perfusion MRI using a near-identical sequence: implications for multi-center studies. Neuroimage 113, 143–152. [DOI] [PubMed] [Google Scholar]
- Pelizzari L, Lagana MM, Baglio F, Bergsland N, Cecconi P, Viotti S, Pugnetti L, Nemni R, Baselli G, Clerici M, Mendozzi L, 2020. Cerebrovascular reactivity and its correlation with age in patients with multiple sclerosis. Brain Imaging Behav 14, 1889–1898. [DOI] [PubMed] [Google Scholar]
- Pillai JJ, Zaca D, 2011. Clinical utility of cerebrovascular reactivity mapping in patients with low grade gliomas. World J Clin Oncol 2, 397–403. [DOI] [PMC free article] [PubMed] [Google Scholar]
- Ravi H, Thomas BP, Peng SL, Liu H, Lu H, 2016. On the optimization of imaging protocol for the mapping of cerebrovascular reactivity. J. Magn. Reson. Imaging 43, 661–668. [DOI] [PMC free article] [PubMed] [Google Scholar]
- Restom K, Perthen JE, Liu TT, 2008. Calibrated fMRI in the medial temporal lobe during a memory-encoding task. Neuroimage 40, 1495–1502. [DOI] [PMC free article] [PubMed] [Google Scholar]
- Shrout PE, Fleiss JL, 1979. Intraclass correlations: uses in assessing rater reliability. Psychol. Bull 86, 420–428. [DOI] [PubMed] [Google Scholar]
- Silvestrini M, Pasqualetti P, Baruffaldi R, Bartolini M, Handouk Y, Matteis M, Moffa F, Provinciali L, Vernieri F, 2006. Cerebrovascular reactivity and cognitive decline in patients with Alzheimer disease. Stroke 37, 1010–1015. [DOI] [PubMed] [Google Scholar]
- Slessarev M, Han J, Mardimae A, Prisman E, Preiss D, Volgyesi G, Ansel C, Duffin J, Fisher JA, 2007. Prospective targeting and control of end-tidal CO2 and O2 concentrations. J. Physiol 581, 1207–1219. [DOI] [PMC free article] [PubMed] [Google Scholar]
- Song Z, McDonough IM, Liu P, Lu H, Park DC, 2016. Cortical amyloid burden and age moderate hippocampal activity in cognitively-normal adults. Neuroimage Clin 12, 78–84. [DOI] [PMC free article] [PubMed] [Google Scholar]
- Sur S, Lin Z, Li Y, Yasar S, Rosenberg P, Moghekar A, Hou X, Kalyani R, Hazel K, Pottanat G, Xu C, van Zijl P, Pillai J, Liu P, Albert M, Lu H, 2020. Association of cerebrovascular reactivity and Alzheimer pathologic markers with cognitive performance. Neurology 95, e962–e972. [DOI] [PMC free article] [PubMed] [Google Scholar]
- Tancredi FB, Lajoie I, Hoge RD, 2014. A simple breathing circuit allowing precise control of inspiratory gases for experimental respiratory manipulations. BMC Res Notes 7, 235. [DOI] [PMC free article] [PubMed] [Google Scholar]
- Thrippleton MJ, Shi Y, Blair G, Hamilton I, Waiter G, Schwarzbauer C, Pernet C, Andrews PJ, Marshall I, Doubal F, Wardlaw JM, 2018. Cerebrovascular reactivity measurement in cerebral small vessel disease: Rationale and reproducibility of a protocol for MRI acquisition and image processing. Int J Stroke 13, 195–206. [DOI] [PubMed] [Google Scholar]
- Tsvetanov KA, Henson RN, Tyler LK, Davis SW, Shafto MA, Taylor JR, Williams N, Cam C, Rowe JB, 2015. The effect of ageing on fMRI: Correction for the confounding effects of vascular reactivity evaluated by joint fMRI and MEG in 335 adults. Hum. Brain Mapp 36, 2248–2269. [DOI] [PMC free article] [PubMed] [Google Scholar]
- van der Thiel M, Rodriguez C, Van De Ville D, Giannakopoulos P, Haller S, 2019. Regional Cerebral Perfusion and Cerebrovascular Reactivity in Elderly Controls With Subtle Cognitive Deficits. Front Aging Neurosci 11, 19. [DOI] [PMC free article] [PubMed] [Google Scholar]
- Wise RG, Pattinson KT, Bulte DP, Chiarelli PA, Mayhew SD, Balanos GM, O’Connor DF, Pragnell TR, Robbins PA, Tracey I, Jezzard P, 2007. Dynamic forcing of end-tidal carbon dioxide and oxygen applied to functional magnetic resonance imaging. J. Cereb. Blood Flow Metab 27, 1521–1532. [DOI] [PubMed] [Google Scholar]
- Wu D, Ma T, Ceritoglu C, Li Y, Chotiyanonta J, Hou Z, Hsu J, Xu X, Brown T, Miller MI, Mori S, 2016. Resource atlases for multi-atlas brain segmentations with multiple ontology levels based on T1-weighted MRI. Neuroimage 125, 120–130. [DOI] [PMC free article] [PubMed] [Google Scholar]
- Xu F, Liu P, Pekar JJ, Lu H, 2015. Does acute caffeine ingestion alter brain metabolism in young adults? Neuroimage 110, 39–47. [DOI] [PMC free article] [PubMed] [Google Scholar]
- Yezhuvath US, Lewis-Amezcua K, Varghese R, Xiao G, Lu H, 2009. On the assessment of cerebrovascular reactivity using hypercapnia BOLD MRI. NMR Biomed. 22, 779–786. [DOI] [PMC free article] [PubMed] [Google Scholar]
- Yezhuvath US, Uh J, Cheng Y, Martin-Cook K, Weiner M, Diaz-Arrastia R, van Osch M, Lu H, 2012. Forebrain-dominant deficit in cerebrovascular reactivity in Alzheimer’s disease. Neurobiol. Aging 33, 75–82. [DOI] [PMC free article] [PubMed] [Google Scholar]
- Zaca D, Jovicich J, Nadar SR, Voyvodic JT, Pillai JJ, 2014. Cerebrovascular reactivity mapping in patients with low grade gliomas undergoing presurgical sensorimotor mapping with BOLD fMRI. J. Magn. Reson. Imaging 40, 383–390. [DOI] [PMC free article] [PubMed] [Google Scholar]
Associated Data
This section collects any data citations, data availability statements, or supplementary materials included in this article.
Data Availability Statement
The data and code used in this work will be made available upon request on a case-by-case basis after obtaining approval from the funding agency.