

Abstract
Background.
Older adults with late-life depression (LLD) often experience incomplete or lack of response to first-line pharmacotherapy. The treatment of LLD could be improved using objective biological measures to predict response. Transcranial magnetic stimulation (TMS) can be used to measure cortical excitability, inhibition, and plasticity, which have been implicated in LLD pathophysiology, and associated with brain stimulation treatment outcomes in younger adults with depression. TMS measures have not yet been investigated as predictors of treatment outcomes in LLD, or pharmacotherapy outcomes in adults of any age with depression.
Methods.
We assessed whether pre-treatment single-pulse and paired-pulse TMS measures, combined with clinical and demographic measures, predict venlafaxine treatment response in 76 outpatients with LLD. We compared the predictive performance of machine learning models including or excluding TMS predictors.
Results.
Two single-pulse TMS measures predicted venlafaxine response: cortical excitability (neuronal membrane excitability), and the variability of cortical excitability (dynamic fluctuations in excitability levels). In cross-validation, models using a combination of these TMS predictors, clinical markers of treatment resistance, and age, classified patients with 73±11% balanced accuracy (average correct classification rate of responders and non-responders; permutation testing, p<0.005); these models significantly outperformed (corrected t-test, p=0.025) models using clinical and demographic predictors alone (60±10% balanced accuracy).
Conclusions.
These preliminary findings suggest that single-pulse TMS measures of cortical excitability may be useful predictors of response to pharmacotherapy in LLD. Future studies are needed to confirm these findings and determine whether combining TMS predictors with other biomarkers further improves the accuracy of predicting LLD treatment outcome.
Keywords: late-life depression, geriatric depression, TMS, cortical excitability, support vector machine, genetic algorithm, neurophysiology, predictive biomarker
INTRODUCTION
Whereas objective biological data are commonly used to guide treatment decisions in general medicine, patient-reported outcomes and trial-and-error guide treatment decisions for depression. Over half of older adults with depression do not respond to first-line antidepressant pharmacotherapy(1, 2). To date, demographic and clinical variables have shown only modest utility as predictors of antidepressant outcome(3). Brain-based measures may improve the prediction of treatment outcome beyond what can be accomplished using self-report or rater-assessed clinical data. For example, in large studies of primarily younger and middle-aged adults with depression, the inclusion of resting-state functional magnetic resonance imaging (fMRI) or electroencephalography (EEG) measures of brain function improved the prediction of antidepressant outcomes compared to demographic and clinical measures alone(4–6). However, fewer studies have investigated biological predictors of treatment outcome in older adults with depression.
Aging likely influences the pathophysiology of depression(7, 8), therefore some biological predictors of treatment response are likely unique in late-life depression (LLD). Preliminary studies have examined the relationship between baseline fMRI or EEG measures and antidepressant treatment outcomes in LLD(9–14). For example, Karim et al. found that fMRI indices improved the prediction of pharmacotherapy outcomes as compared to clinical measures in LLD(15). Previous evidence implicating executive function as a predictor of treatment response in LLD(16) might also suggest a role for cortical functioning(17) in the prediction of treatment outcomes. While fMRI and EEG provide valuable indices of brain activity and functional connectivity, these modalities alone cannot index specific forms of inhibitory and excitatory neurotransmission in the cortex.
Complementing fMRI and EEG measures of brain function, single-pulse and paired-pulse transcranial magnetic stimulation (TMS) can be used to measure specific excitatory and inhibitory mechanisms in cortical circuits in a cost-effective way. TMS uses electromagnetic induction to non-invasively stimulate the cortex. Cortical excitability, inhibition, facilitation, and plasticity can be measured by combining TMS of the motor cortex with electromyography measurements of motor output(18). These cortical mechanisms have been shown to change with advancing age(19, 20), and have been implicated in the pathophysiology of depression(21, 22) and LLD(8, 23). For example, TMS studies have found abnormally low cortical inhibition in patients with depression across the lifespan(8, 24–26), and an association between cortical plasticity and executive function in LLD(23). Furthermore, TMS studies in younger and mid-life adults with depression have found that less cortical inhibition(27, 28), greater plasticity(29), and greater excitability(29, 30) at baseline may be associated with better outcomes after brain stimulation treatment. Additionally, one study identified a relationship between cortical inhibition and response to 6 weeks of fluoxetine in sixteen youth with depression(31). However, neurophysiological predictors of pharmacotherapy and brain stimulation treatment likely differ(4, 32), and preliminary findings in children/adolescents cannot be directly extrapolated to adults. The relationship between TMS measures of cortical functioning and pharmacotherapy outcomes has not yet been studied in adults with depression of any age. Moreover, TMS measures have not been evaluated as predictors of response for any treatment avenues in LLD.
Therefore, we undertook a novel pilot study to assess whether pre-treatment single-pulse and paired-pulse TMS measures are neurophysiological predictors of depressive symptom improvement following 12 weeks of antidepressant (venlafaxine) pharmacotherapy in patients with LLD. We explored: (1) which TMS measures may be useful as predictors, and (2) whether combining TMS predictors with demographic and clinical predictors could be used to predict venlafaxine response more effectively than demographic and clinical predictors alone.
METHODS & MATERIALS
Participants
All participants were enrolled in one of two ‘Incomplete Response in Late-Life Depression: Getting to Remission’ (IRL-GRey) clinical trials at the Centre for Addiction and Mental Health (Toronto; ClinicalTrials.gov identifiers: NCT00892047 and NCT02263248)(33), which were designed to address incomplete response to conventional treatment in older adults with mild to severe depression. Baseline measurements were collected before participants initiated ~12 weeks of open-label treatment with venlafaxine (a serotonin-norepinephrine reuptake inhibitor, SNRI). A subset of the older adults with LLD studied here participated in a previously published investigation of longitudinal changes in cortical inhibition and plasticity during venlafaxine treatment(34). Inclusion and exclusion criteria are detailed in the Supplement. In accordance with the Declaration of Helsinki, the study was approved by the CAMH Research Ethics Board and all participants provided written, informed consent.
Venlafaxine Treatment and Clinical Outcomes
All participants took venlafaxine XR (extended-release) for approximately 12 weeks. Venlafaxine was initiated at 37.5 mg/day and was increased to a maximum dosage of 300 mg/day as needed. Low dosages of some sedatives or anxiolytics were allowed as needed, including benzodiazepines (up to the equivalent of lorazepam 2 mg/day), zopiclone (up to 15 mg/day), or trazodone (up to 50 mg/day). Details of the titration schedule and permitted medications have been reported previously(35). For this study, the primary clinical outcome was treatment response, defined as ≥ 50% MADRS score reduction, consistent with the observed bimodal distribution of symptom improvement (Figure 1A). In secondary analyses, treatment outcome was classified based on remission (MADRS score ≤10) or early partial response (>26.5% MADRS score reduction at 2 weeks(35); Supplement).
Figure 1. Depressive symptom changes in responder and non-responder subgroups.
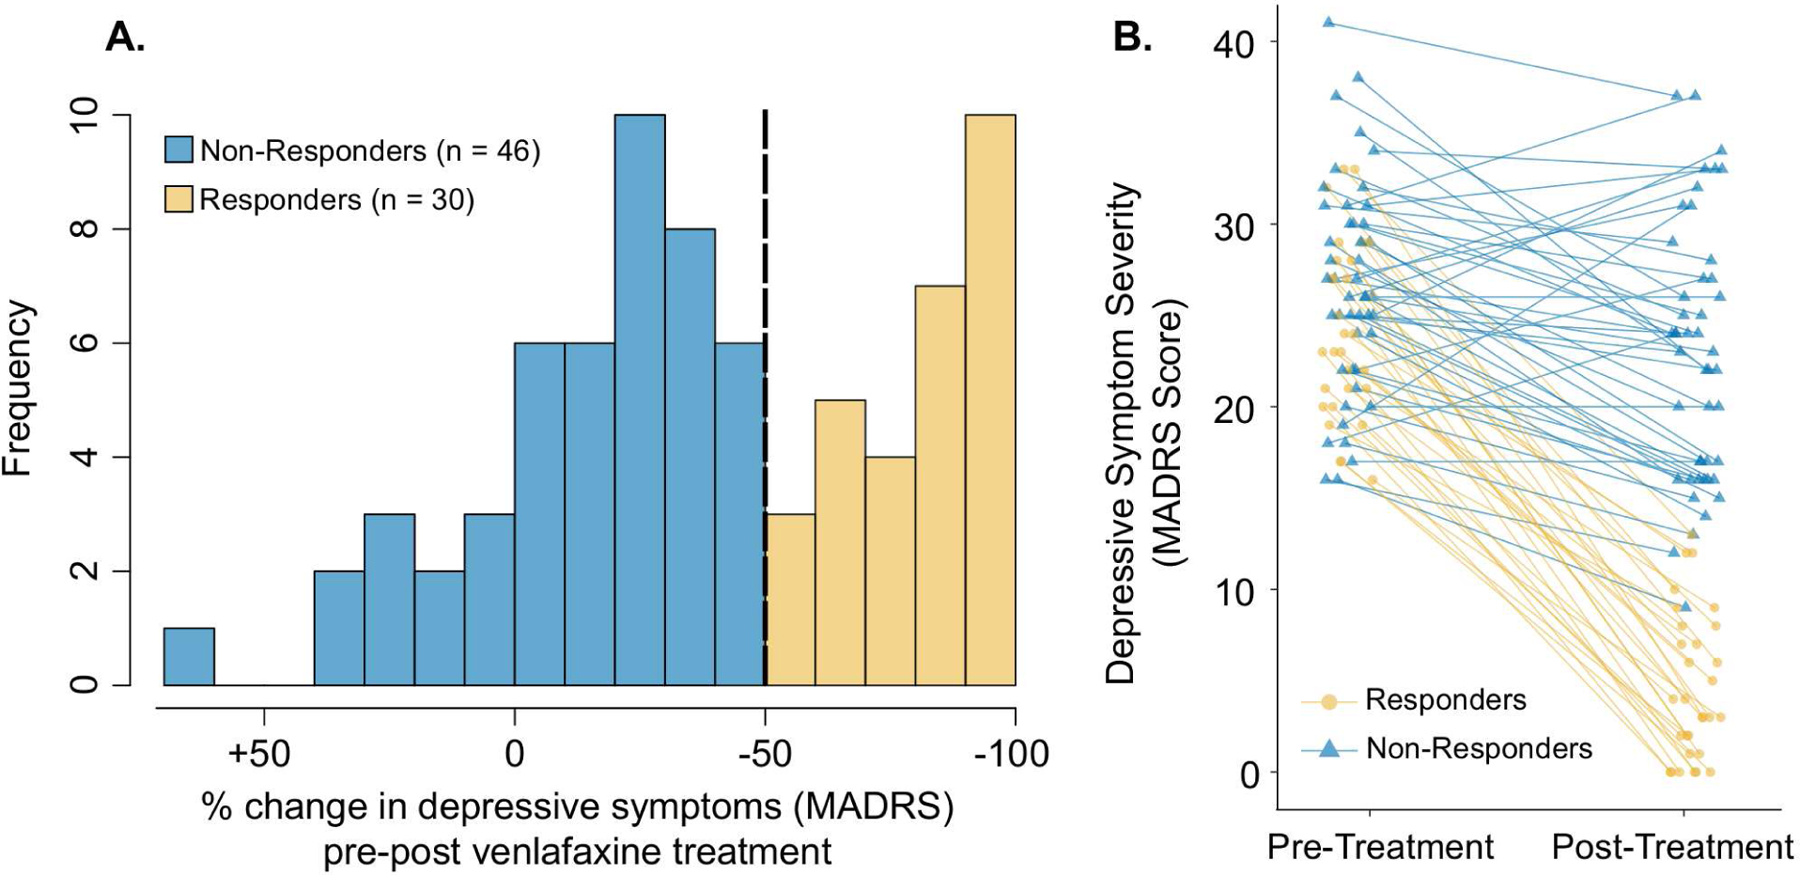
A. Histogram of percentage change in MADRS scores pre- to post-treatment in participants with LLD. Negative values reflect a decrease (i.e., an improvement) in depressive symptoms. The vertical dashed line indicates the threshold used to define response subgroups. B. Individual participant MADRS scores are plotted prior to and immediately following 12 weeks of venlafaxine treatment.
Pre-Treatment Demographic, Clinical, and Cognitive Measures
A set of demographic, clinical, and cognitive measures were considered based on published evidence of their association with pharmacotherapy outcome in LLD or TMS measures. After excluding measures with >25% of data missing or minimal variability across participants, 15 measures were selected: age(36, 37), sex(35), years of education(36), depressive symptom severity(35–37), self-reported sleep loss(36), pessimistic thoughts (e.g. guilt)(36), current depressive episode duration (natural log-transformed)(35–38), age of onset of first lifetime depressive episode(36, 38, 39), antidepressant treatment resistance prior to initiation of venlafaxine(35, 36, 40), anxiety severity(36, 37), medical comorbidity(37, 41, 42), concurrent low-dose sedative/anxiolytic use(43), diagnosis of a comorbid anxiety disorder(37), executive function(37, 44, 45), and delayed memory recall(36). Clinical and cognitive measurements are detailed in the Supplement.
Pre-Treatment Assessment of Cortical Functioning using TMS
TMS measures were collected as described in detail previously(23). Briefly, monophasic TMS pulses were delivered to the left motor cortex during electromyography recordings of the right abductor pollicis brevis muscle. A figure-of-eight TMS coil (Magstim) was positioned with the coil handle approximately 45° laterally from the midline to elicit posterior-anterior current and maximize the motor evoked potential (MEP) amplitude. Electromyography signals were amplified, band pass filtered (2–2.5 kHz) and digitized at 5 kHz. The electromyography signal was continuously monitored to ensure muscle relaxation. We assessed 8 TMS measures of cortical functioning: (1) resting motor threshold (RMT), (2) 1mV stimulator intensity (SI1mV), (3) coefficient of variation (CV) of MEP amplitudes, (4) cortical silent period, (5) short-interval intracortical inhibition (SICI), (6) intracortical facilitation (ICF), and (7) average and (8) maximum paired associative stimulation (PAS)-induced plasticity. See Table 1 for a summary of TMS paradigms.
Table 1.
Description of the single-pulse and paired-pulse TMS paradigms and their associated cortical mechanisms. The TMS paradigms were performed in the order listed in the table.
| TMS Paradigm | Description of Paradigm | Primary Underlying Cortical Mechanism |
|---|---|---|
| Measures of Cortical Excitability | ||
| (1) Resting motor threshold (RMT) | Minimum stimulator intensity that elicited a ≥50μV MEP in 5 of 10 consecutive trials at rest. | Neuronal membrane excitability |
| (2) 1mV stimulator intensity (SI1mv) | Suprathreshold stimulator intensity that elicited an average MEP amplitude of approximately 1mV at rest. | Neuronal membrane excitability |
| (3) Coefficient of variation (CV) of MEP amplitudes | Trial-to-trial CV of the MEP amplitudes elicited by single-pulse TMS (12 trials delivered at SI1mv). | Variability of cortical excitability |
| Measures of Intracortical Inhibition and Facilitation | ||
| (4) Short-interval intracortical inhibition (SICI) | Paired-pulse TMS: Conditioning pulse (80% of RMT) preceded test pulse (SI1mv) by 2ms (12 trials per condition). | GABAA receptor-mediated inhibitory neurotransmission |
| (5) Intracortical facilitation (ICF) | Paired-pulse TMS: Conditioning pulse (80% of RMT) preceded test pulse (SI1mv) by10ms (12 trials per condition). | NMDA receptor-mediated excitatory neurotransmission |
| (6) Cortical silent period | Single-pulse TMS (140% of RMT) during tonic muscle contraction (10 trials). | GABAB receptor-mediated inhibitory neurotransmission |
| Measures of Cortical Plasticity | ||
| (7) Average paired associative stimulation (PAS)-induced plasticity | Pre-PAS: Single-pulse TMS (SI1mV) PAS: Right median nerve stimulation preceded TMS by 25ms (180 pairings). Post-PAS: Single-pulse TMS (SI1mv) immediately after, and 15, 30 and 60 mins after PAS (20 trials per timepoint). Average potentiation calculated. | Long-term potentiation-like cortical plasticity |
| (8) Maximum PAS-induced plasticity | Same PAS procedures. Maximum potentiation calculated. | Long-term potentiation-like cortical plasticity |
Cortical Excitability
RMT and SI1mV were first established as indices of cortical excitability. Following RMT determination using the relative frequency method(46), stimulation was increased to 120% of RMT, and adjusted until the average peak-to-peak MEP amplitude across 15–20 consecutive pulses was approximately 1mV (0.5–1.5 mV; SI1mV). Both RMT and SI1mV were established using single pulses of TMS with a 5s inter-trial interval. A lower stimulation intensity indicates greater cortical excitability(47). Additionally, the variability (CV) of MEP amplitudes in response to suprathreshold single-pulse TMS (5s inter-trial interval) was used to index intrinsic fluctuations in the level of excitability. Trial-to-trial variability of cortically evoked MEPs has been attributed to spontaneous fluctuations in the excitability of cortical neurons, and is insensitive to stimulus intensity, spatial constancy of coil placement, and mental alertness(48–51).
Intracortical Inhibition and Facilitation
Cortical inhibition and facilitation were then assessed using SICI and ICF paradigms. The conditioning pulse reliably attenuates (SICI) or potentiates (ICF) the mean MEP amplitude compared to single-pulse TMS(47, 52), which probes inhibitory or excitatory neurotransmission in the cortex, respectively. Cortical inhibition was subsequently assessed using the cortical silent period paradigm, in which the abductor pollicis brevis muscle was contracted at 20% of maximum force using a pinch gauge during TMS. The duration of the ‘silent period’ was calculated from MEP onset to the return of electromyography activity.
Cortical Plasticity
Lastly, long-term potentiation-like cortical plasticity was assessed using the PAS paradigm(53). During PAS, participants focused their attention on the stimulated hand, and kept a running count of the stimulations, which was recorded periodically to assess attention levels. (i) Average and (ii) maximum PAS-induced plasticity were calculated as (i) the average MEP amplitude across all post-PAS timepoints normalized to the mean pre-PAS MEP amplitude, and (ii) the post-PAS timepoint with the highest mean MEP amplitude normalized to the mean pre-PAS MEP amplitude.
Dimensionality Reduction
Single-pulse and paired-pulse TMS measures, i.e., features, have not yet been investigated as predictors of LLD treatment outcome, therefore we used a data-driven method to (i) identify candidate TMS predictors of treatment response, and (ii) further reduce the number of features used for classification, decreasing the likelihood of overfitting due to high dimensionality. Each feature was scaled to achieve a Gaussian distribution with zero mean and unit variance. Missing observations were imputed using the mean of that measure. The distribution of each feature was checked using a histogram and Q-Q plot.
Feature selection was carried out using a random subset of 70% of the data, thus 30% of the data were held out. We used a genetic algorithm(54) to select candidate predictors, implemented using Distributed Evolutionary Algorithms in Python (DEAP)(55). A genetic algorithm is a stochastic search tool based on the principles of natural evolution that has been successfully used for feature selection in a wide range of classification problems in bioinformatics(56–59). Importantly, genetic algorithms can consider the interactions between features during feature selection, and hence serve to evaluate which measures are jointly informative for predicting treatment outcome.
We ran the genetic algorithm 20 times, each time using a random subsample of the data that was used for feature selection. From the 23 initial features (15 demographic and clinical, and 8 TMS features), each run of the genetic algorithm generated feature subsets as potential predictors. We then calculated the frequency with which each feature was included in the top 100 most predictive feature subsets across all 20 genetic algorithm runs. With this approach, the genetic algorithm is used to both identify candidate feature subsets and rank the relative importance of each feature (based on the frequency with which each measure is selected). Similar strategies have been shown to be stable and reproducible for feature selection in small samples in other fields(56). See Supplement and Figure S1 for details of the genetic algorithm.
Classification
We used a support vector machine (SVM) classifier(60) with a Gaussian kernel (Figure S2) to predict treatment response based on the top 4 pre-treatment predictors that were consistently selected by the genetic algorithm. We also evaluated classifiers using the top 2 to 6 predictors (Table S1). An SVM is a supervised machine learning classifier that identifies a hyperplane that optimally differentiates between treatment response subgroups in a multidimensional space (# of features = # of dimensions). SVM classifiers have been successfully used to predict antidepressant treatment outcomes using biological data(6). We also explored the performance of k-nearest neighbours (k-NN), logistic regression, and linear SVM classifiers (Supplement). All classifiers were implemented using the scikit-learn Python package(61, 62).
Monte Carlo cross-validation was performed using 200 random 80-20 train-test splits of the full dataset. In other words, each model was trained on 80% of the data, and evaluated on the held out 20% of the data, which was repeated 200 times with different train-test splits of the data. To evaluate whether TMS data could improve predictive performance compared to clinical and demographic data, cross-validation was performed for classifiers using (i) demographic, clinical, and TMS predictors, and (ii) demographic and clinical predictors only. Five classifier performance metrics were calculated during cross-validation: balanced accuracy, accuracy, sensitivity, specificity, and precision (Table 3).
Table 3.
Mean ± SD cross-validation performance metrics (using the full dataset) are displayed for SVM models including TMS, demographic, and clinical predictors, or only demographic and clinical predictors. Accuracy is the proportion of all predictions that were correct. Balanced accuracy is similar to accuracy, but accounts for imbalance in the class sizes. Balanced accuracy is the average of sensitivity and specificity, which is equivalent to the ROC curve area under the curve here. Sensitivity (also known as true positive rate) is the proportion of responders who were correctly classified by the model. Specificity (also known as true negative rate) is the proportion of non-responders who were correctly classified by the model. Precision (also known as positive predictive value) is the proportion of predicted responders who were actually responders.
| Performance Metric | TMS, Demographic & Clinical Data | Demographic & Clinical Data |
|---|---|---|
| Accuracy | 0.75 ± 0.10 | 0.61 ± 0.11 |
| Balanced Accuracy | 0.73 ± 0.10 | 0.61 ± 0.11 |
| Sensitivity | 0.61 ± 0.18 | 0.50 ± 0.23 |
| Specificity | 0.84 ± 0.12 | 0.71 ± 0.16 |
| Precision | 0.73 ± 0.20 | 0.53 ± 0.21 |
Statistics
Non-parametric permutation testing was used to assess the statistical significance of each classifier’s cross-validation results (using the full dataset). Treatment outcome labels were randomly shuffled (permuted) 200 times, and for each permutation, cross-validation was repeated to assess classifier performance using the permuted data. The resulting p-value reflects the proportion of mean cross-validation balanced accuracy scores obtained using permuted data that were greater than the mean cross-validation balanced accuracy score obtained without permutation. To validate that the genetic algorithm-SVM approach used here does not overfit the current dataset, we also performed feature selection and classification after permuting the outcome labels. We assessed SVM performance using the top 4 predictors selected by the genetic algorithm using the randomly permuted dataset. The performance of the model using the randomly permuted dataset should not have significant predictive ability. Additionally, a one-tailed corrected resampled t-test(63, 64) was used to assess whether including TMS predictors significantly improved classifier cross-validation performance, as compared to classifiers including only clinical and demographic predictors.
RESULTS
Participants
TMS measurements were collected prior to venlafaxine treatment in 84 participants. Eight participants did not have follow-up clinical measures to assess outcome, thus the final sample consisted of 76 participants with LLD (49 (64.5%) female; mean ± SD age: 67 ± 7 years). After 12 weeks of treatment, 30 participants were classified as ‘responders’ (mean ± SD MADRS score % reduction: 80.8 ± 16.1) and 46 participants as ‘non-responders’ (MADRS score % reduction: 14.0 ± 24.7). Figure 1 presents the distribution of changes in depressive symptom severity, and Table 2 summarizes the demographic, clinical, and neurophysiological characteristics of response subgroups.
Table 2.
Demographic, clinical, cognitive, and neurophysiological characteristics of participants by response subgroup. Mean ± standard deviation is reported throughout unless stated otherwise. Response subgroup comparisons were performed using an independent two-tailed t-test (continuous variables), Mann-Whitney U test (non-normally distributed continuous variables), or Fisher’s exact test (categorical variables). MADRS = Montgomery-Asberg Depression Rating Scale, % MSO = % of maximum stimulator output, MEP = motor evoked potential, SI1mV = 1mV stimulator intensity, CV = coefficient of variation, PAS = paired associative stimulation, SICI = short-interval intracortical inhibition, ICF = intracortical facilitation.
| Responders (n = 30) | Non-Responders (n = 46) | Statistics | |
|---|---|---|---|
| Demographics | |||
| Age (years) [range] | 66.2 ± 5.5 [57 – 86] | 66.9 ± 7.3 [53 – 92] | t74 = 0.43, p = 0.67 |
| % Female | 70.0 (n = 21) | 60.9 (n = 28) | p = 0.47 |
| % Caucasian | 93.3 (n = 28) | 95.7 (n = 44) | p = 0.73 |
| Years of education | 14.6 ± 2.2 | 14.6 ± 3.3 | t73 = 0.01, p = 0.99 |
| Clinical Measures | |||
| Baseline MADRS score | 24.2 ± 4.7 | 26.7 ± 5.7 | t74 = 2.03, p = 0.05 |
| Age of onset (years) [range] | 40.2 ± 17.3 [11 – 69] | 42.9 ± 18.3 [12 – 91] | t74 = 0.63, p = 0.53 |
| Duration of current depressive episode, median [range] | 46 [2 – 2100] weeks | 78 [8 – 1248] weeks | t74 = 1.45, p = 0.15 |
| % Non-response to ≥1 prior adequate antidepressant trial | 60.0 (n = 18) | 82.6 (n = 38) | p = 0.04 |
| % Concurrent anxiolytic / sedative use | 20.0 (n = 6) | 32.6 (n = 15) | p = 0.30 |
| % Comorbid anxiety disorder | 30.0 (n = 9) | 34.8 (n = 16) | p = 0.80 |
| Brief Symptom Inventory – Anxiety | 1.67 ± 0.90 | 1.59 ± 0.98 | t74 = 0.39, p = 0.69 |
| Medical comorbidity (CIRS-G total score) | 6.4 ± 4.0 | 6.5 ± 3.2 | t74 = 0.09, p = 0.92 |
| Reduced sleep (MADRS item 4 score) | 2.63 ± 1.47 | 2.83 ± 1.80 | t74 = 0.49, p = 0.63 |
| Pessimistic thoughts (MADRS item 9 score) | 2.63 ± 0.96 | 2.78 ± 1.07 | t74 = 0.62, p = 0.54 |
| Executive function score | 4.4 ± 1.6 | 4.4 ± 2.3 | t60 = 0.11, p = 0.91 |
| Delayed recall score (% retained) | 71.1 ± 29.4 | 73.6 ± 21.5 | t62 = 0.40, p = 0.69 |
| Week 12 venlafaxine dosage (mg/day) | 221.3 ± 79.0 | 266.6 ± 63.8 | W = 894, p = 0.01 |
| Neurophysiological Measures | |||
| Cortical Excitability | |||
| Resting motor threshold | 49.1 ± 9.2 % MSO | 48.5 ± 9.8 % MSO | t74 = 0.26, p = 0.79 |
| SI1mV | 62.7 ± 12.8 % MSO | 63.1 ± 16.7 % MSO | t74 = 0.12, p = 0.90 |
| CV of MEP amplitudes | 59.0 ± 19.5 % | 70.0 ± 24.7 % | t73 = 2.03, p = 0.05 |
| Cortical Inhibition & Facilitation | |||
| SICI Ratio | 0.58 ±0.38 | 0.68 ± 0.53 | t73 = 0.60, p = 0.55 |
| ICF Ratio | 1.83 ± 0.77 | 1.84 ± 0.87 | t73 = 0.25, p = 0.80 |
| Cortical silent period | 127.4 ± 34.5 ms | 123.2 ± 34.5 ms | t72 = 0.50, p = 0.62 |
| Cortical Plasticity | |||
| Average PAS Ratio | 1.09 ± 0.44 | 1.20 ± 0.57 | t58 = 0.64, p = 0.52 |
| Maximum PAS Ratio | 1.49 ± 0.67 | 1.64 ± 0.91 | t58 = 0.52, p = 0.61 |
TMS and Clinical Predictors
The top 4 predictors selected by the genetic algorithm included two single-pulse TMS measures, one demographic measure, and one clinical measure: (1) variability of cortical excitability (the CV of MEP amplitudes; 99.6% selection frequency); (2) cortical excitability (the stimulator output required to elicit a mean MEP amplitude of ~1mV; 89.4% selection frequency); (3) age (86.7% selection frequency); and (4) treatment resistance (ATHF score; 88.3% selection frequency). These predictors were consistently selected as top predictors when different initial feature selection data subsets were used. The identified TMS predictors also showed acceptable reliability in the current sample of LLD participants (Supplement). There were no missing data for the predictors, except for one missing observation for the variability of cortical excitability. Moreover, both TMS predictors were found to be modulated by venlafaxine treatment (Supplement).
Prediction of Treatment Outcome Using Pre-Treatment TMS and Clinical Data
The mean SVM balanced accuracy score obtained with the top 4 TMS, clinical, and demographic predictors was significantly greater than the balanced accuracy scores obtained across 200 permutation tests (p < 0.005). See Table 3 for a summary of SVM performance metrics. Additionally, random permutation of the outcome labels prior to feature selection led to an average SVM balanced accuracy score of only 0.53 ± 0.09 (p = 0.21 in permutation tests), suggesting that the genetic algorithm-SVM approach was not overfitting the data. Classifier performance using TMS, clinical and demographic predictors was also significant using k-NN, logistic regression, and linear SVM classifiers (Supplement).
By contrast, when TMS predictors were excluded, and the top 4 demographic, clinical, and cognitive predictors optimized with the genetic algorithm were used to classify treatment outcome (age, education, ATHF score, and executive function), the SVM was only modestly predictive of treatment outcome (p = 0.035 by permutation testing, see Table 3). The inclusion of TMS predictors significantly improved the prediction of treatment response compared to demographic and clinical predictors alone (corrected t-test, t199 = 1.96, p = 0.025). See Figure 2 for an illustration of SVM model performance including vs. excluding TMS predictors.
Figure 2. Illustration of model performances with different predictors.
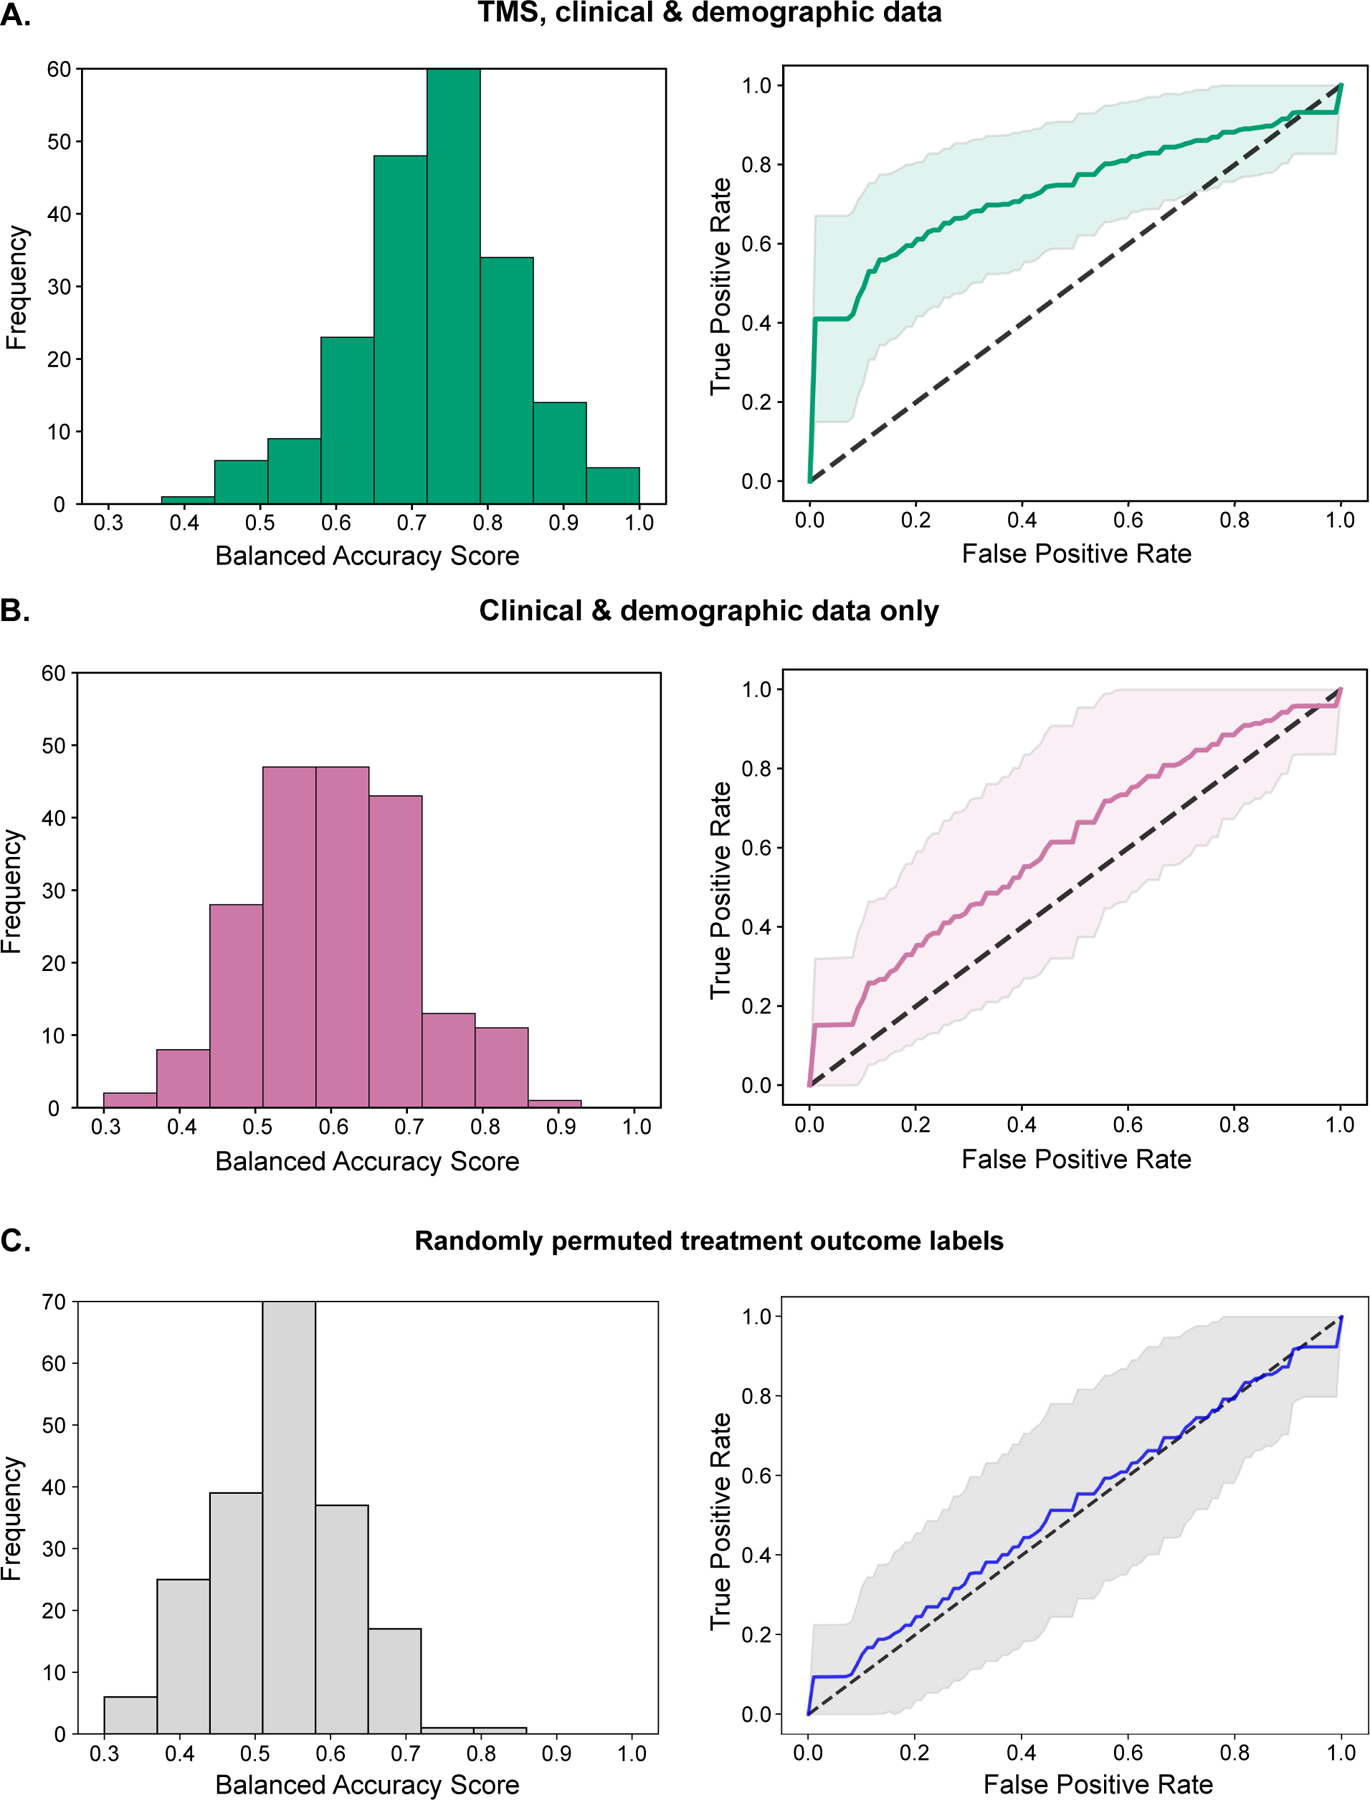
Histograms of balanced accuracy scores from 200 random train-test splits of the full dataset, and the corresponding mean ± SD receiver operating characteristic (ROC) curves. (a) SVM classifiers based on TMS, demographic, and clinical predictors (4 predictors: variability of cortical excitability, cortical excitability, age, and history of treatment resistance). (b) SVM classifiers based on demographic and clinical predictors alone (4 predictors: age, education, history of treatment resistance, and executive function). (c) SVM classifiers based on TMS, demographic, and clinical predictors with randomly shuffled treatment response labels (4 predictors: SICI, reduced sleep (MADRS item 4), medical comorbidity (CIRS-G total score), and sedative/anxiolytic use).
Classifier performance was consistently improved by the inclusion of TMS predictors, as observed across different types of models (Supplement, Figure S3), different model parameters (Figures S2, S3), and different numbers of predictors included in the model (Table S1). A sensitivity analysis excluding participants <60 years of age also showed significant improvement in classification accuracy when TMS predictors were included (Supplement). The identified predictors were specifically predictive of response or remission after 12 weeks of treatment; they were not predictive of early partial response to treatment (Supplement). Exploration of the linear associations between predictors showed no strong correlations between predictors (Supplement, Figure S4).
DISCUSSION
Being able to use biological data to guide treatment decisions (“precision psychiatry”) is a major goal in contemporary psychiatry. To our knowledge, this is the first prospective study to investigate single-pulse and paired-pulse TMS measures as predictors of response to antidepressant pharmacotherapy in adults. We found that pre-treatment TMS measures of cortical excitability may serve as useful predictors of venlafaxine treatment response in older adults with major depression. Combining TMS predictors with demographic and clinical predictors significantly improved the accuracy with which machine learning models predicted treatment response compared to demographic and clinical predictors alone (mean ± SD balanced accuracy: 73 ± 11% vs. 60 ± 10%). This preliminary result demonstrates the potential additive predictive value of TMS measures relative to traditional demographic and clinical predictors. Of the TMS measures we investigated, cortical excitability and the variability of cortical excitability were identified as valuable predictors. These neuronal membrane potential-related TMS predictors were modulated by venlafaxine treatment (Supplement), suggesting that these indices of cortical excitability are examples of neural targets that are both engaged by venlafaxine treatment and predictive of response to venlafaxine. By contrast, TMS measures of cortical inhibition, facilitation, and plasticity were not identified as top predictors; this is consistent with earlier work showing that these GABA and glutamate-related measures are unchanged during venlafaxine treatment(34). For many older adults with depression who do not improve with first-line pharmacotherapy, a clinical decision support tool based on relatively easy-to obtain biomarkers such as these single-pulse TMS measures could substantially improve the efficacy and efficiency of treatment.
We used motor cortex TMS-electromyography as a proxy for general cortical functioning, given the similar cellular organization across cortical regions(65). Previous studies have investigated the relationship between motor cortex TMS measures and brain stimulation treatment outcomes in depression(27, 29, 66). However, motor cortex TMS predictors may be particularly relevant to pharmacotherapy outcomes, as compared to brain stimulation outcomes, given that repetitive TMS targets non-motor cortical regions, whereas antidepressant medications such as SNRIs have a more widespread influence in the cortex(67–69). Compared with more involved whole-brain measurement techniques, single-pulse motor cortex TMS predictors require relatively brief (< 20 mins) measurement and analysis procedures that place little burden on the patient. These single-pulse TMS predictors can be reliably measured by a non-clinician by (i) establishing the TMS intensity that elicits a ~1mV MEP, and (ii) delivering 12 – 30 single TMS pulses at this intensity. Following replication of our preliminary results in future work, these non-invasive neurophysiologic TMS predictors would be relatively cost-effective to obtain in a clinic, as compared to many neuroimaging modalities.
Our finding that neurophysiological data can be used to enhance the prediction of treatment outcome is in line with recent investigations of other brain-based predictors of pharmacotherapy outcome. In particular, machine learning models based on resting-state EEG and fMRI predictors significantly outperformed models based on clinical predictors alone(4, 5, 15). Moreover, a robust EEG predictor of sertraline treatment outcome (which differentially predicted outcome with brain stimulation treatment, and did not predict outcome with placebo) showed a moderately strong association with cortical excitability as assessed using single-pulse TMS(4), supporting the current findings that single-pulse TMS measures may be useful as predictors of antidepressant treatment outcome. Altogether, current evidence suggests that measures of brain function collected prior to treatment initiation may convey important information about a patient’s likelihood to improve with pharmacotherapy. Future studies should consider combining brain-based predictors (e.g., TMS, EEG and fMRI) and established clinical predictors to develop multi-modal signatures of brain function that can more accurately guide treatment decisions.
The SI1mV TMS predictor is thought to reflect neuronal membrane excitability at suprathreshold stimulation intensities(47, 70). Like RMT, SI1mV is mediated by voltage-gated Na+ channels(70) and K+ channels(71), but not by GABA(70). Congruent with our findings, previous studies have identified associations between similar metrics of excitability (RMT and MEP amplitude) and brain stimulation treatment outcomes in depression(27, 30), particularly when combined with other demographic, clinical, and neurophysiological predictors(29). It could be speculated that cortical excitability and the variability of excitability in particular were predictive of venlafaxine response because of their relationship with venlafaxine pharmacology. The observed modulation of cortical excitability by venlafaxine is in line with evidence from rodents that both norepinephrine and serotonin can influence resting membrane potential in the cortex(72–74). Of note however, while these TMS measures were identified as useful predictors of treatment outcome, they may not play a direct role in antidepressant outcomes; other biological factors, such as the presence of amyloid(75), could mediate the observed relationship.
TMS measures were predictive of treatment outcome when combined with previously identified demographic and clinical predictors. Age and a history of antidepressant treatment resistance were the two top demographic and clinical predictors of treatment response, in line with prior findings(35, 36, 76). Advancing age may interact with the identified TMS predictors(20), therefore further work is needed to clarify whether the TMS predictors we identified generalize across the lifespan or whether they apply specifically to LLD. Other previously identified demographic and clinical predictors, including years of education, baseline pessimistic thoughts (e.g. guilt), and executive function were also identified as predictors of treatment response in some of our models. However, the inclusion of these predictors did not improve model performance (Table S1). We also previously found that measures of executive functions related to LLD treatment outcomes (e.g. cognitive flexibility) were not strongly associated with the TMS measures studied here(23). On their own, demographic and clinical predictors were only modestly predictive of treatment outcome, in line with previous reports(3, 4, 6).
Some limitations of the current study should be considered. First, as the first investigation of TMS predictors of LLD treatment outcome, this novel pilot study was intended to explore the value of easy-to-obtain motor cortex TMS measures as predictors of pharmacotherapy outcome, rather than to develop a definitive predictive model. This preliminary work identified candidate neurophysiological predictors for future studies; replication of these results in a larger, independent dataset is needed. Second, the modest sample size, data-driven feature selection approach, and overlap in the data used for feature selection and classification likely led to some degree of overfitting to the current dataset. However, we took a number of steps to mitigate the risk of overfitting: (a) demonstrating consistent findings with multiple parsimonious classifiers, (b) using only a subset of the full sample for feature selection, (c) regularizing feature selection by choosing candidate predictors based on their frequency of selection across multiple genetic algorithm runs, (d) training and evaluating all models with a minimal number of features, and (e) using Monte Carlo cross-validation to assess model performance. We also evaluated the degree of overfitting by running the current pipeline with randomized treatment outcome labels; as expected, the resulting model performed at chance levels. Third, the specificity of the identified predictors to venlafaxine cannot be assessed in the absence of another antidepressant or treatment modality. Thus, the predictors we identified could be associated with treatment response in general and non-specific mechanisms of response. Fourth, although low-dose benzodiazepine use was taken into account as a potential predictor during feature selection, the possible interaction between low-dose benzodiazepine use in some patients and the TMS measures cannot be ruled out. Fifth, our findings were specific to the TMS paradigms investigated here, and future studies of predictive biomarkers should consider additional TMS measures that probe overlapping but distinct components of cortical functioning, such as long-interval intracortical inhibition. Similarly, our findings are specific to motor cortex measurements. Sixth, age-related cortical atrophy could have influenced the TMS measures. Future work expanding beyond the motor cortex should account for cortical atrophy using structural MRI. Finally, limited ethnic and racial diversity in our participants precluded the assessment of ethnicity or race as predictors. This limitation highlights the challenges with recruiting diverse samples in clinical research, which needs to be addressed in future work.
In conclusion, combining pre-treatment TMS predictors with established demographic and clinical predictors may improve the prediction of treatment outcome in LLD as compared to demographic and clinical predictors alone. In particular, cortical excitability and the variability of cortical excitability may be useful as single-pulse TMS predictors. This is encouraging given their relative simplicity from a clinical implementation standpoint. These preliminary results warrant a larger study wherein TMS measures, ideally in combination with other promising biomarkers, are applied to the prediction of LLD treatment outcomes.
Supplementary Material
Acknowledgements
We would like to acknowledge Yu Qi Zhang, Shang Wang, Hsin-Yu Lo, and Weicheng Cao for their contributions to the feature selection and machine learning methods. This study was funded in part by a Brain and Behaviour Research Foundation New Investigator Award (DMB), the Canadian Institutes of Health Research and the National Institutes of Health (R01MH083643, R34MH101365). We would also like to acknowledge the Temerty Centre and the Canada Foundation for Innovation for providing TMS equipment.
BHM currently receives research funding from Brain Canada, the Centre for Addiction and Mental Health (CAMH) Foundation, Patient-Centered Outcomes Research Institute (PCORI), and the US National Institute of Health (NIH). During the last five years, he also received research funding from the Canadian Institutes of Health Research (CIHR), and support in kind from Capital Solution Design LLC (software used in a study funded by CAMH Foundation), HAPPYneuron (software used in a study funded by Brain Canada), Bristol-Myers Squibb (medications for a NIH-funded clinical trial), Eli-Lilly (medications for a NIH-funded clinical trial), and Pfizer (medications for a NIH-funded clinical trial). He directly own stocks of General Electric (less than $5,000).
RC has received research support from a Canadian Institutes of Health Research Foundation Grant, Catherine Manson Chair in Movement Disorders, Dystonia Medical Research Foundation and Weston Brain Institute. He received honoraria from GE Healthcare, Merz and Allergan.
JD has received research support from the Arrell Family Foundation, Brain Canada, the Buchan Family Foundation, the Canadian Biomarker Integration Network in Depression, the Canadian Institutes of Health Research (CIHR), the Klarman Family Foundation, NIMH, the Ontario Brain Institute, and the Weston Family Foundation; he has received travel stipends from Lundbeck and ANT Neuro; he has served as an adviser for BrainCheck, Restorative Brain Clinics, and TMS Neuro Solutions.
JFK received medication supplies from Indivior to support this investigator initiated trial. He has also received medication supplies from Pfizer for investigator initiated work. JFK receives research funding from NIH and PCORI.
EJL reports research funding (current/past) from Janssen, Alkermes, Acadia, Takeda, Lundbeck, Barnes Jewish Foundation, PCORI, and Taylor Family Institute for Innovative Psychiatric Research. TKR has received research support from Brain Canada, Brain and Behavior Research Foundation, BrightFocus Foundation, Canada Foundation for Innovation, Canada Research Chair, Canadian Institutes of Health Research, Centre for Aging and Brain Health Innovation, National Institutes of Health, Ontario Ministry of Health and Long-Term Care, Ontario Ministry of Research and Innovation, and the Weston Brain Institute.
CFR has received research support from the NIH, PCORI, the Center for Medicare and Medicaid Services, the American Foundation for Suicide Prevention, the Brain and Behavior Research Foundation, and the Commonwealth of Pennsylvania. Bristol Meyers Squib and Pfizer have provided pharmaceutical supplies for his NIH sponsored research.
In the last 5 years, ZJD has received research and equipment in-kind support for an investigator-initiated study through Brainsway Inc and Magventure Inc. His work was supported by the Ontario Mental Health Foundation (OMHF), the Canadian Institutes of Health Research (CIHR), the National Institutes of Mental Health (NIMH) and the Temerty Family and Grant Family and through the Centre for Addiction and Mental Health (CAMH) Foundation and the Campbell Institute.
DMB has received research support from CIHR, NIH, Brain Canada and the Temerty Family through the CAMH Foundation and the Campbell Research Institute. He receives research support and in-kind equipment support for an investigator-initiated study from Brainsway Ltd. and he is the site principal investigator for three sponsor-initiated studies for Brainsway Ltd. He also receives in-kind equipment support from Magventure for an investigator-initiated study. He receives medication supplies for an investigator-initiated trial from Indivior.
Footnotes
Publisher's Disclaimer: This is a PDF file of an unedited manuscript that has been accepted for publication. As a service to our customers we are providing this early version of the manuscript. The manuscript will undergo copyediting, typesetting, and review of the resulting proof before it is published in its final form. Please note that during the production process errors may be discovered which could affect the content, and all legal disclaimers that apply to the journal pertain.
Disclosures
JIL, AJB, MAB, and RZ report no biomedical financial interests or potential conflicts of interest.
References.
- 1.Tedeschini E, Levkovitz Y, Iovieno N, Meral V, Nelson C, Papakostas G (2011): Efficacy of antidepressants for late-life depression: A meta-analysis and meta-regression of placebo-controlled randomized trials. J Clin Psychiatry 72: 1660–1668. [DOI] [PubMed] [Google Scholar]
- 2.Nelson JC, Delucchi K, Schneider LS (2008): Efficacy of second generation antidepressants in late-life depression: A meta-analysis of the evidence. Am J Geriatr Psychiatry 16: 558–567. [DOI] [PubMed] [Google Scholar]
- 3.Chekroud AM, Zotti RJ, Shehzad Z, Gueorguieva R, Johnson MK, Trivedi MH, et al. (2016): Cross-trial prediction of treatment outcome in depression: A machine learning approach. Lancet Psychiatry 3: 243–250. [DOI] [PubMed] [Google Scholar]
- 4.Wu W, Zhang Y, Jiang J, Lucas MV, Fonzo GA, Rolle CE, et al. (2020): An electroencephalographic signature predicts antidepressant response in major depression. Nat Biotechnol 38: 439–447. [DOI] [PMC free article] [PubMed] [Google Scholar]
- 5.Korgaonkar MS, Goldstein-Piekarski AN, Fornito A, Williams LM (2020): Intrinsic connectomes are a predictive biomarker of remission in major depressive disorder. Mol Psychiatry 25: 1537–1549. [DOI] [PMC free article] [PubMed] [Google Scholar]
- 6.Drysdale AT, Grosenick L, Downar J, Dunlop K, Mansouri F, Meng Y, et al. (2017): Resting-state connectivity biomarkers define neurophysiological subtypes of depression. Nat Med 23: 28–38. [DOI] [PMC free article] [PubMed] [Google Scholar]
- 7.McKinney BC, Sibille E (2013): The age-by-disease interaction hypothesis of late-life depression. Am J Geriatr Psychiatry 21: 418–432. [DOI] [PMC free article] [PubMed] [Google Scholar]
- 8.Lissemore JI, Bhandari A, Mulsant BH, Lenze EJ, Reynolds CF, Karp JF, et al. (2018): Reduced GABAergic cortical inhibition in aging and depression. Neuropsychopharmacology 43: 2277–2284. [DOI] [PMC free article] [PubMed] [Google Scholar]
- 9.Ward MJ, Karim HT, Jessen ZF, Ghuman AS, Richardson RM, Reynolds III CF, et al. (2020): Association between increased theta cordance and early response to ECT in late-life depression. Int J Geriatr Psychiatry 35: 147–152. [DOI] [PMC free article] [PubMed] [Google Scholar]
- 10.Alexopoulos GS, Hoptman MJ, Kanellopoulos D, Murphy CF, Lim KO, Gunning FM (2012): Functional connectivity in the cognitive control network and the default mode network in late-life depression. J Affect Disord 139: 56–65. [DOI] [PMC free article] [PubMed] [Google Scholar]
- 11.Andreescu C, Tudorascu DL, Butters MA, Tamburo E, Patel M, Price J, et al. (2013): Resting state functional connectivity and treatment response in late-life depression. Psychiatry Res Neuroimaging 214: 313–321. [DOI] [PMC free article] [PubMed] [Google Scholar]
- 12.Steffens DC, Wang L, Pearlson GD (2019): Functional connectivity predictors of acute depression treatment outcome. Int Psychogeriatr 31: 1831–1835. [DOI] [PMC free article] [PubMed] [Google Scholar]
- 13.Emam H, Steffens DC, Pearlson GD, Wang L (2019): Increased ventromedial prefrontal cortex activity and connectivity predict poor sertraline treatment outcome in late-life depression. Int J Geriatr Psychiatry 34: 730–737. [DOI] [PMC free article] [PubMed] [Google Scholar]
- 14.Narushima K, McCormick LM, Yamada T, Thatcher RW, Robinson RG (2010): Subgenual cingulate theta activity predicts treatment response of repetitive transcranial magnetic stimulation in participants with vascular depression. J Neuropsychiatry Clin Neurosci 22: 75–84. [DOI] [PMC free article] [PubMed] [Google Scholar]
- 15.Karim HT, Wang M, Andreescu C, Tudorascu D, Butters MA, Karp JF, et al. (2018): Acute trajectories of neural activation predict remission to pharmacotherapy in late-life depression. Neuroimage Clin 19: 831–839. [DOI] [PMC free article] [PubMed] [Google Scholar]
- 16.Pimontel MA, Rindskopf D, Rutherford BR, Brown PJ, Roose SP, Sneed JR (2016): A meta-analysis of executive dysfunction and antidepressant treatment response in late-life depression. Am J Geriatr Psychiatry 24: 31–41. [DOI] [PMC free article] [PubMed] [Google Scholar]
- 17.Niendam TA, Laird AR, Ray KL, Dean YM, Glahn DC, Carter CS (2012): Meta-analytic evidence for a superordinate cognitive control network subserving diverse executive functions. Cogn Affect Behav Neurosci 12: 241–268. [DOI] [PMC free article] [PubMed] [Google Scholar]
- 18.Hallett M (2007): Transcranial magnetic stimulation: A primer. Neuron 55: 187–199. [DOI] [PubMed] [Google Scholar]
- 19.Cueva AS, Galhardoni R, Cury RG, Parravano DC, Correa G, Araujo H, et al. (2016): Normative data of cortical excitability measurements obtained by transcranial magnetic stimulation in healthy subjects. Clin Neurophysiol 46: 43–51. [DOI] [PubMed] [Google Scholar]
- 20.Bhandari A, Radhu N, Farzan F, Mulsant BH, Rajji TK, Daskalakis ZJ, et al. (2016): A meta-analysis of the effects of aging on motor cortex neurophysiology assessed by transcranial magnetic stimulation. Clin Neurophysiol 127: 2834–2845. [DOI] [PMC free article] [PubMed] [Google Scholar]
- 21.Radhu N, de Jesus DR, Ravindran LN, Zanjani A, Fitzgerald PB, Daskalakis ZJ (2013): A meta-analysis of cortical inhibition and excitability using transcranial magnetic stimulation in psychiatric disorders. Clin Neurophysiol 124: 1309–1320. [DOI] [PubMed] [Google Scholar]
- 22.Player MJ, Taylor JL, Weickert CS, Alonzo A, Sachdev P, Martin D, et al. (2013): Neuroplasticity in depressed individuals compared with healthy controls. Neuropsychopharmacology 38: 2101–2108. [DOI] [PMC free article] [PubMed] [Google Scholar]
- 23.Lissemore JI, Shanks HRC, Butters MA, Bhandari A, Zomorrodi R, Rajji TK, et al. (2019): An inverse relationship between cortical plasticity and cognitive inhibition in late-life depression. Neuropsychopharmacology 44: 1659–1666. [DOI] [PMC free article] [PubMed] [Google Scholar]
- 24.Bajbouj M, Lisanby SH, Lang UE, Danker-Hopfe H, Heuser I, Neu P (2006): Evidence for impaired cortical inhibition in patients with unipolar major depression. Biol Psychiatry 59: 395–400. [DOI] [PubMed] [Google Scholar]
- 25.Lefaucheur JP, Lucas B, Andraud F, Hogrel JY, Bellivier F, Del Cul A, et al. (2008): Inter-hemispheric asymmetry of motor corticospinal excitability in major depression studied by transcranial magnetic stimulation. J Psychiatr Res 42: 389–398. [DOI] [PubMed] [Google Scholar]
- 26.Levinson AJ, Fitzgerald PB, Favalli G, Blumberger DM, Daigle M, Daskalakis ZJ (2010): Evidence of cortical inhibitory deficits in major depressive disorder. Biol Psychiatry 67: 458–464. [DOI] [PubMed] [Google Scholar]
- 27.Fitzgerald PB, Brown TL, Marston NAU, Daskalakis ZJ, de Castella A, Bradshaw JL, et al. (2004): Motor cortical excitability and clinical response to rTMS in depression. J Affect Disord 82: 71–76. [DOI] [PubMed] [Google Scholar]
- 28.Voineskos D, Levinson AJ, Sun Y, Barr MS, Farzan F, Rajji TK, et al. (2016): The relationship between cortical inhibition and electroconvulsive therapy in the treatment of major depressive disorder. Sci Rep 6: 37461. [DOI] [PMC free article] [PubMed] [Google Scholar]
- 29.Oliveira-Maia AJ, Press D, Pascual-Leone A (2017): Modulation of motor cortex excitability predicts antidepressant response to prefrontal cortex repetitive transcranial magnetic stimulation. Brain Stimul 10: 787–794. [DOI] [PMC free article] [PubMed] [Google Scholar]
- 30.Lisanby SH, Husain MM, Rosenquist PB, Maixner D, Gutierrez R, Krystal A, et al. (2009): Daily left prefrontal repetitive transcranial magnetic stimulation in the acute treatment of major depression: Clinical predictors of outcome in a multisite, randomized controlled clinical trial. Neuropsychopharmacology 34: 522–534. [DOI] [PubMed] [Google Scholar]
- 31.Croarkin PE, Nakonezny PA, Husain MM, Port JD, Melton T, Kennard BD, et al. (2014): Evidence for pretreatment lici deficits among depressed children and adolescents with nonresponse to fluoxetine. Brain Stimul 7: 243–251. [DOI] [PubMed] [Google Scholar]
- 32.Widge AS, Avery DH, Zarkowski P (2013): Baseline and treatment-emergent EEG biomarkers of antidepressant medication response do not predict response to repetitive transcranial magnetic stimulation. Brain Stimul 6: 929–931. [DOI] [PMC free article] [PubMed] [Google Scholar]
- 33.Lenze EJ, Mulsant BH, Blumberger DM, Karp JF, Newcomer JW, Anderson SJ, et al. (2015): Efficacy, safety, and tolerability of augmentation pharmacotherapy with aripiprazole for treatment-resistant depression in late life: A randomised, double-blind, placebo-controlled trial. Lancet 386: 2404–2412. [DOI] [PMC free article] [PubMed] [Google Scholar]
- 34.Lissemore JI, Mulsant BH, Rajji TK, Karp JF, Reynolds CF, Lenze EJ, et al. (2021): Cortical inhibition, facilitation, and plasticity in late-life depression: Effects of venlafaxine pharmacotherapy. J Psychiatry Neurosci 46: E88–E96. [DOI] [PMC free article] [PubMed] [Google Scholar]
- 35.Joel I, Begley AE, Mulsant BH, Lenze EJ, Mazumdar S, Dew MA, et al. (2014): Dynamic prediction of treatment response in late-life depression. Am J Geriatr Psychiatry 22: 167–176. [DOI] [PMC free article] [PubMed] [Google Scholar]
- 36.Smagula SF, Butters MA, Anderson SJ, Lenze EJ, Dew MA, Mulsant BH, et al. (2015): Antidepressant response trajectories and associated clinical prognostic factors among older adults. JAMA Psychiatry 72: 1021–1028. [DOI] [PMC free article] [PubMed] [Google Scholar]
- 37.Tunvirachaisakul C, Gould RL, Coulson MC, Ward EV, Reynolds G, Gathercole RL, et al. (2018): Predictors of treatment outcome in depression in later life: A systematic review and meta-analysis. J Affect Disord 227: 164–182. [DOI] [PubMed] [Google Scholar]
- 38.First MB, Spitzer RL, Gibbon M, Williams JB Structured clinical interview for DSM-IV-tr axis I disorders, research version, patient edition. (SCID-I/P) Biometrics Research, New York State Psychiatric Institute: New York. [Google Scholar]
- 39.Andreescu C, Mulsant BH, Houck PR, Whyte EM, Mazumdar S, Dombrovski AY, et al. (2008): Empirically derived decision trees for the treatment of late-life depression. Am J Psychiatry 165: 855–862. [DOI] [PMC free article] [PubMed] [Google Scholar]
- 40.Hsu JH, Mulsant BH, Lenze EJ, Karp JF, Lavretsky H, Roose SP, et al. (2016): Impact of prior treatment on remission of late-life depression with venlafaxine and subsequent aripiprazole or placebo augmentation. Am J Geriatr Psychiatry 24: 918–922. [DOI] [PMC free article] [PubMed] [Google Scholar]
- 41.Oslin DW, Datto CJ, Kallan MJ, Katz IR, Edell WS, TenHave T (2002): Association between medical comorbidity and treatment outcomes in late-life depression. J Am Geriatr Soc 50: 823–828. [DOI] [PubMed] [Google Scholar]
- 42.Trivedi MH, Rush AJ, Wisniewski SR, Nierenberg AA, Warden D, Ritz L, et al. (2006): Evaluation of outcomes with citalopram for depression using measurement-based care in STAR*D: Implications for clinical practice. Am J Psychiatry 163: 28–40. [DOI] [PubMed] [Google Scholar]
- 43.Paulus W, Classen J, Cohen LG, Large CH, Di Lazzaro V, Nitsche M, et al. (2008): State of the art: Pharmacologic effects on cortical excitability measures tested by transcranial magnetic stimulation. Brain Stimul 1: 151–163. [DOI] [PubMed] [Google Scholar]
- 44.Groves SJ, Douglas KM, Porter RJ (2018): A systematic review of cognitive predictors of treatment outcome in major depression. Front Psychiatry 9: 382. [DOI] [PMC free article] [PubMed] [Google Scholar]
- 45.Kaneriya SH, Robbins-Welty GA, Smagula SF, et al. (2016): Predictors and moderators of remission with aripiprazole augmentation in treatment-resistant late-life depression: An analysis of the irl-grey randomized clinical trial. JAMA Psychiatry 73: 329–336. [DOI] [PMC free article] [PubMed] [Google Scholar]
- 46.Rossini PM, Barker AT, Berardelli A, Caramia MD, Caruso G, Cracco RQ, et al. (1994): Non-invasive electrical and magnetic stimulation of the brain, spinal cord and roots: Basic principles and procedures for routine clinical application. Report of an IFCN committee. Electroencephalogr Clin Neurophysiol 91: 79–92. [DOI] [PubMed] [Google Scholar]
- 47.Ziemann U, Reis J, Schwenkreis P, Rosanova M, Strafella A, Badawy R, et al. (2015): TMS and drugs revisited 2014. Clin Neurophysiol 126: 1847–1868. [DOI] [PubMed] [Google Scholar]
- 48.Jung NH, Delvendahl I, Kuhnke NG, Hauschke D, Stolle S, Mall V (2010): Navigated transcranial magnetic stimulation does not decrease the variability of motor-evoked potentials. Brain Stimul 3: 87–94. [DOI] [PubMed] [Google Scholar]
- 49.Kiers L, Cros D, Chiappa KH, Fang J (1993): Variability of motor potentials evoked by transcranial magnetic stimulation. Electroencephalogr Clin Neurophysiol 89: 415–423. [DOI] [PubMed] [Google Scholar]
- 50.Rossini PM, Burke D, Chen R, Cohen L, Daskalakis Z, Di Iorio R, et al. (2015): Non-invasive electrical and magnetic stimulation of the brain, spinal cord, roots and peripheral nerves: Basic principles and procedures for routine clinical and research application. An updated report from an IFCN committee. Clin Neurophysiol 126: 1071–1107. [DOI] [PMC free article] [PubMed] [Google Scholar]
- 51.Ellaway PH, Davey NJ, Maskill DW, Rawlinson SR, Lewis HS, Anissimova NP (1998): Variability in the amplitude of skeletal muscle responses to magnetic stimulation of the motor cortex in man. Electroencephalogr Clin Neurophysiol 109: 104–113. [DOI] [PubMed] [Google Scholar]
- 52.Kujirai T, Caramia MD, Rothwell JC, Day BL, Thompson PD, Ferbert A, et al. (1993): Corticocortical inhibition in human motor cortex. J Physiol 471: 501–519. [DOI] [PMC free article] [PubMed] [Google Scholar]
- 53.Stefan K, Kunesch E, Cohen LG, Benecke R, Classen J (2000): Induction of plasticity in the human motor cortex by paired associative stimulation. Brain 123: 572–584. [DOI] [PubMed] [Google Scholar]
- 54.Holland JH Adaptation in natural and artificial systems: An introductory analysis with applications to biology, control, and artificial intelligence. U Michigan Press: Oxford, England. [Google Scholar]
- 55.Fortin F-A, De Rainville F-M, Gardner M-AG, Parizeau M, Gagné C (2012): DEAP: Evolutionary algorithms made easy. J Mach Learn Res 13: 2171–2175. [Google Scholar]
- 56.Li L, Weinberg CR, Darden TA, Pedersen LG (2001): Gene selection for sample classification based on gene expression data: Study of sensitivity to choice of parameters of the GA/KNN method. Bioinformatics 17: 1131–1142. [DOI] [PubMed] [Google Scholar]
- 57.Beheshti I, Demirel H, Matsuda H (2017): Classification of Alzheimer’s disease and prediction of mild cognitive impairment-to-Alzheimer’s conversion from structural magnetic resource imaging using feature ranking and a genetic algorithm. Comput Biol Med 83: 109–119. [DOI] [PubMed] [Google Scholar]
- 58.Li H, Yuan D, Ma X, Cui D, Cao L (2017): Genetic algorithm for the optimization of features and neural networks in ECG signals classification. Sci Rep 7: 41011. [DOI] [PMC free article] [PubMed] [Google Scholar]
- 59.Peng S, Xu Q, Ling XB, Peng X, Du W, Chen L (2003): Molecular classification of cancer types from microarray data using the combination of genetic algorithms and support vector machines. FEBS Lett 555: 358–362. [DOI] [PubMed] [Google Scholar]
- 60.Cortes C, Vapnik V (1995): Support-vector networks. Mach Learn 20: 273–297. [Google Scholar]
- 61.Pedregosa F, Varoquaux G, Gramfort A, Michel V, Thirion B, Grisel O, et al. (2011): Scikit-learn: Machine learning in Python. J Mach Learn Res 12: 2825–2830. [Google Scholar]
- 62.Chang C-C, Lin C-J (2011): LIBSVM: A library for support vector machines. ACM transactions on intelligent systems and technology (TIST) 2: 1–27. [Google Scholar]
- 63.Nadeau C, Bengio Y, editors. Inference for the generalization error. Advances in Neural Information Processing Systems; 2000. [Google Scholar]
- 64.Bouckaert RR, Frank E, editors. Evaluating the replicability of significance tests for comparing learning algorithms. Pacific-Asia Conference on Knowledge Discovery and Data Mining; 2004: Springer. [Google Scholar]
- 65.Harris KD, Shepherd GMG (2015): The neocortical circuit: Themes and variations. Nat Neurosci 18: 170–181. [DOI] [PMC free article] [PubMed] [Google Scholar]
- 66.Dolberg OT, Dannon PN, Schreiber S, Grunhaus L (2002): Magnetic motor threshold and response to TMS in major depressive disorder. Acta Psychiatr Scand 106: 220–223. [DOI] [PubMed] [Google Scholar]
- 67.Laruelle M, Vanisberg M-a, Maloteaux J-m (1988): Regional and subcellular localization in human brain of [3H]paroxetine binding, a marker of serotonin uptake sites. Biol Psychiatry 24: 299–309. [DOI] [PubMed] [Google Scholar]
- 68.Kish SJ, Furukawa Y, Chang L-J, Tong J, Ginovart N, Wilson A, et al. (2005): Regional distribution of serotonin transporter protein in postmortem human brain: Is the cerebellum a SERT-free brain region? Nucl Med Biol 32: 123–128. [DOI] [PubMed] [Google Scholar]
- 69.Smith HR, Beveridge TJR, Porrino LJ (2006): Distribution of norepinephrine transporters in the non-human primate brain. Neuroscience 138: 703–714. [DOI] [PubMed] [Google Scholar]
- 70.Darmani G, Bergmann TO, Zipser C, Baur D, Müller-Dahlhaus F, Ziemann U (2019): Effects of antiepileptic drugs on cortical excitability in humans: A TMS-EMG and TMS-EEG study. Hum Brain Mapp 40: 1276–1289. [DOI] [PMC free article] [PubMed] [Google Scholar]
- 71.Ossemann M, de Fays K, Bihin B, Vandermeeren Y (2016): Effect of a single dose of retigabine in cortical excitability parameters: A cross-over, double-blind placebo-controlled TMS study. Epilepsy Res 126: 78–82. [DOI] [PubMed] [Google Scholar]
- 72.Mueller D, Porter JT, Quirk GJ (2008): Noradrenergic signaling in infralimbic cortex increases cell excitability and strengthens memory for fear extinction. J Neurosci 28: 369–375. [DOI] [PMC free article] [PubMed] [Google Scholar]
- 73.Grzelka K, Kurowski P, Gawlak M, Szulczyk P (2017): Noradrenaline modulates the membrane potential and holding current of medial prefrontal cortex pyramidal neurons via β1-adrenergic receptors and HCN channels. Front Cell Neurosci 11. [DOI] [PMC free article] [PubMed] [Google Scholar]
- 74.Davies MF, Deisz RA, Prince DA, Peroutka SJ (1987): Two distinct effects of 5-hydroxytryptamine on single cortical neurons. Brain Res 423: 347–352. [DOI] [PubMed] [Google Scholar]
- 75.Kellner V, Menkes-Caspi N, Beker S, Stern EA (2014): Amyloid-β alters ongoing neuronal activity and excitability in the frontal cortex. Neurobiol Aging 35: 1982–1991. [DOI] [PubMed] [Google Scholar]
- 76.Buchalter EL, Oughli HA, Lenze EJ, Dixon D, Miller JP, Blumberger DM, et al. (2019): Predicting remission in late-life major depression: A clinical algorithm based upon past treatment history. J Clin Psychiatry 80: 18m12483. [DOI] [PubMed] [Google Scholar]
Associated Data
This section collects any data citations, data availability statements, or supplementary materials included in this article.