Significance
The Pt(111)–electrolyte interface is one of the most important model interfaces in physical electrochemistry. Here, we present detailed capacitance measurements of Pt(111) in contact with nonspecifically adsorbed electrolytes in combination with modeling to show that this interface does not follow classic Gouy–Chapman–Stern behavior. Our combined experimental-theoretical work suggests a picture of the double layer of Pt(111) with an increased ion concentration close to the interface as a consequence of a weak attractive ion–surface interaction and a changing polarizability of the Pt(111)–water interface due to the potential-dependent water adsorption and orientation.
Keywords: double layer, Pt(111), Gouy–Chapman, interfacial water
Abstract
We present detailed measurements of the double-layer capacitance of the Pt(111)–electrolyte interface close to the potential of zero charge (PZC) in the presence of several different electrolytes consisting of anions and cations that are considered to be nonspecifically adsorbed. For low electrolyte concentrations, we show strong deviations from traditional Gouy–Chapman–Stern (GCS) behavior that appear to be independent of the nature of the electrolyte ions. Focusing on the capacitance further away from PZC and the trends for increasing ion concentration, we observe ion-specific capacitance effects that appear to be related to the size or hydration strength of the ions. We formulate a model for the structure of the electric double layer of the Pt(111)–electrolyte interface that goes significantly beyond the GCS theory. By combining two existing models, namely, one capturing the water reorganization on Pt close to the PZC and one accounting for an attractive ion–surface interaction not included in the GCS model, we can reproduce and interpret the main features the experimental capacitance of the Pt(111)–electrolyte interface. The model suggests a picture of the double layer with an increased ion concentration close to the interface as a consequence of a weak attractive ion–surface interaction, and a changing polarizability of the Pt(111)–water interface due to the potential-dependent water adsorption and orientation.
A molecular-level understanding of the electric double layer is important in order to understand many electrochemical processes and interfacial phenomena (1). Being an important catalytic material, platinum is one of the best-studied electrode materials, but detailed studies of its double-layer structure are remarkably scarce. The reason for the absence of detailed studies may lie in the fact that, except for Pt(111), none of the low-index planes of platinum exhibit a double-layer window, in which the metal is bare of adsorbates and can be considered ideally polarizable (2). The absence of a double-layer window, in which neither hydrogen or hydroxyl are adsorbed to the surface, renders the capacitance a combination of capacitive and pseudocapacitive contributions that is difficult to unequivocally separate, impeding detailed quantitative studies. Although the Pt(111) surface exhibits a small double-layer window in the range of 0.4 V to 0.6 V versus the reversible hydrogen electrode (RHE), in which the interface is considered free of adsorbates and ideally polarizable (2), the available capacitance data shows that under these conditions, even Pt(111) does not follow the expected textbook behavior (3).
In the absence of any specific adsorption, the capacitance of the electric double layer of an ideally polarizable interface is expected to follow the Gouy–Chapman–Stern (GCS) model (4, 5). The GCS theory divides the total capacitance of the electric double layer into an “inner layer” or “Stern” capacitance and the diffuse Gouy–Chapman capacitance CGC:
| [1] |
The Gouy–Chapman capacitance is computed by deriving the concentration of ions in the double layer from a Poisson–Boltzmann distribution including only electrostatic interactions. In the case of a symmetric electrolyte, this gives rise to the following expression for :
| [2] |
where is the potential at the Stern layer, is the potential of zero charge (PZC) of the interface, is the charge number of the electrolyte ions, e is the unit of charge, is the dielectric constant of the solvent, is the vacuum permittivity, c is the bulk concentration of the electrolyte, is the Boltzmann constant, and is the temperature. This expression should be accurate in the limit of (very) low electrolyte concentration close to the PZC, and it should be the dominant contribution to the capacitance at low electrolyte concentrations.
Classical work by Grahame on the double layer of a mercury electrode in various electrolytes has confirmed the applicability of the GCS model at low electrolyte concentration (4, 6). However, in recent experiments, we have shown that the Pt(111)–perchloric acid interface, which is traditionally considered to be ideally polarizable, has a much higher differential capacitance than predicted by GCS theory and that the concentration-dependent capacitance does not follow the predictions of the GCS theory (3). In our original publication, we tentatively attributed this behavior to an (attractive) interaction between the ions and the electrode, which is not accounted for in GCS theory. More recently, we also developed a mean-field model (7), in which we showed that relatively weak ion–surface interaction strengths are sufficient to reproduce the observed experimental observations. A similar conclusion was reached in a recent theory paper by Schmickler (8).
To improve our understanding of the nature of this interaction and the associated anomalous behavior of the diffuse double layer of Pt(111), we extend our capacitance measurements here to a range of electrolytes with different monovalent anions and cations, which are all considered to be nonspecifically adsorbed (Li+, Na+, K+, Cs+, ClO4−, F−, and CH3SO3−). Combining these experimental investigations with theoretical modeling allows us to put forward a more refined model for the double-layer structure of Pt(111), in which both an attractive ion–surface interaction and field-dependent water adsorption to the interface play a central role. We believe that the significance of our model likely goes beyond the Pt(111)–electrolyte interface, as the interactions are not specific to that interface. Therefore, our results are an important step toward resolving the true structure of the electric double layer.
Results
Blank Voltammetry of Pt(111) and Importance of pH.
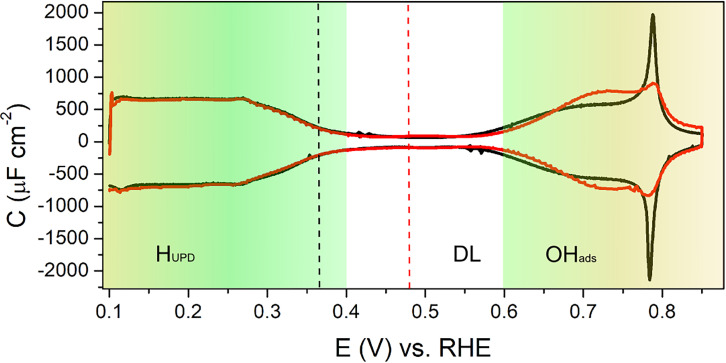
Fig. 1 shows the blank cyclic voltammetry (CV) of Pt(111) in perchloric acid for pH = 1 and pH = 3. The CV exhibits the three well-known regions (9): 1) hydrogen underpotential deposition (HUPD) below 0.4 VRHE, 2) a double-layer window between 0.4 and 0.6 VRHE, and 3) OH adsorption/desorption above 0.6 VRHE. The characteristic smooth HUPD region on Pt(111) at pH = 1 as shown in Fig. 1 suggests that the surface has long terraces with an insignificant numbers of steps (10), indicating a good quality of the Pt(111) surface used in the experiments.
Fig. 1.
Capacitance curves generated from cyclic voltammograms of Pt(111) in 0.1 M HClO4 (pH = 1, scan rate = 50 mV/s, black line) and 1mM HClO4 (pH = 3, scan rate = 10 mV/s, red line) showing HUPD, double layer (DL), and OHads regions; the black and red dashed lines correspond to the expected potential of zero charge at pH 1 and 3, respectively.
In this paper, we study the capacitance of Pt(111) in a potential range in which the surface can be assumed to be ideally polarizable (i.e., in the double-layer window). Furthermore, we are interested in the characteristics of the capacitance close to the PZC. According to our previous work at low electrolyte concentrations, as well as earlier work from the group of Feliu, the PZC of the Pt(111) electrode lies at 0.30 V versus Normal Hydrogen Electrode (NHE) (3, 11–13). Thus, the PZC shifts on the RHE scale as
| [3] |
Consequently, the PZC only lies in the double-layer window for a narrow range of pH values between pH = 2 and pH = 5. Therefore, we limit the investigations to this narrow pH range, specifically pH = 3 and pH = 4.
Double-Layer Capacitance at Low Ionic Strength Close to PZC.
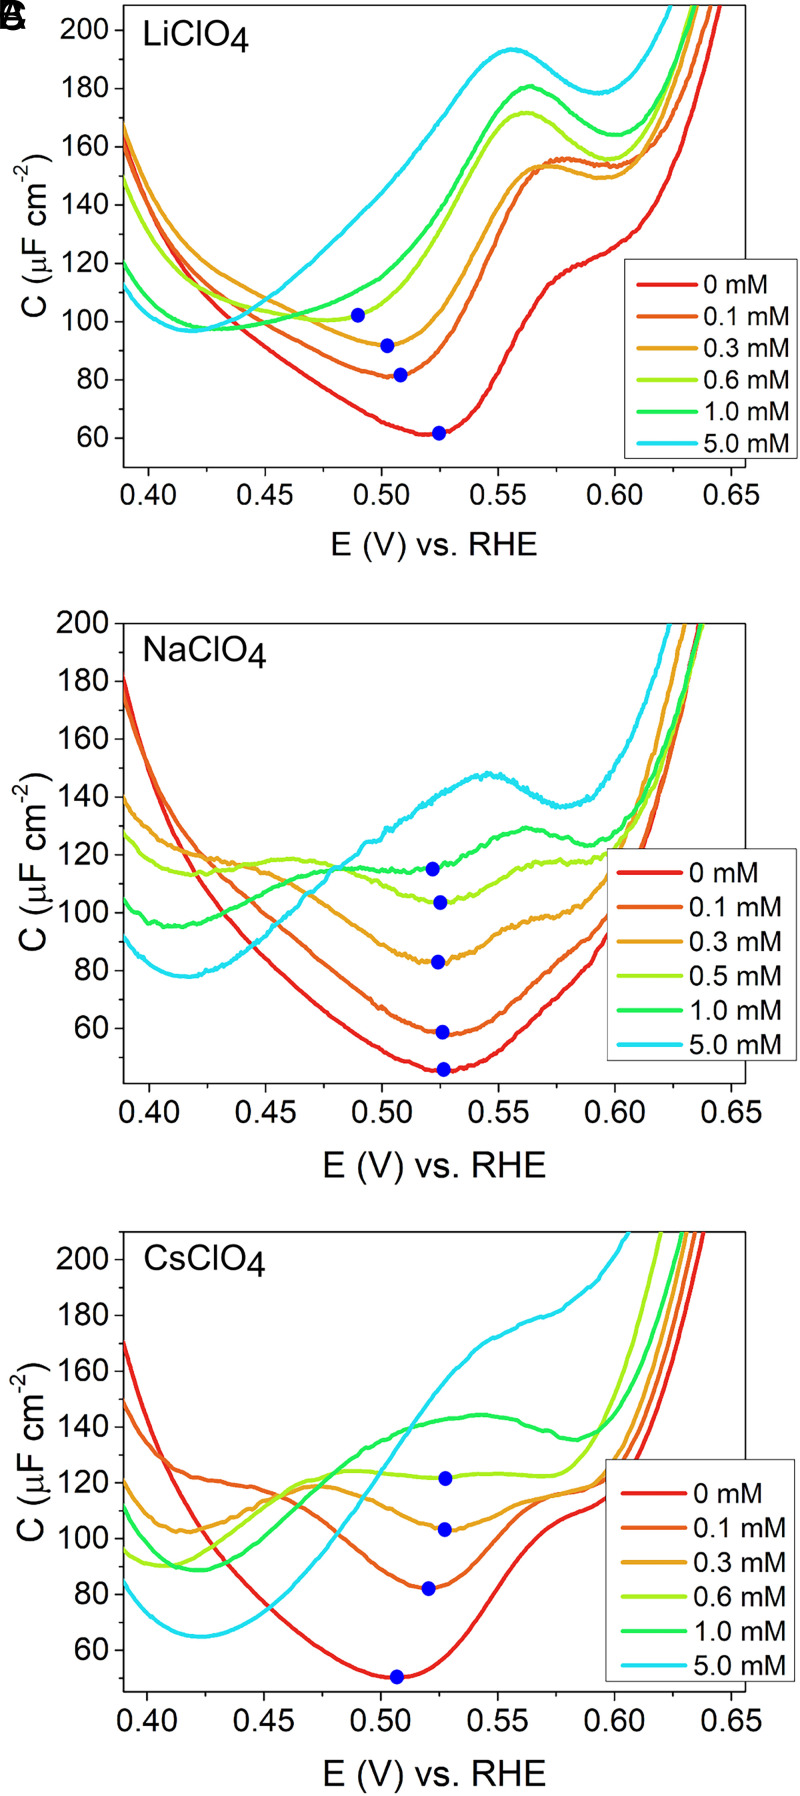
In Fig. 2 A–C, we show the capacitance curves obtained at pH = 4 for different concentrations of perchlorate salts with different cations (Li+, Na+, and Cs+) added to a background electrolyte of 0.1 mM HClO4. We emphasize that, in this figure and in subsequent figures showing the experimental capacitance, we plot the total capacitance (i.e., the sum of the double-layer capacitance and the pseudocapacitance due to HUPD and adsorbed hydroxyl OHads formation) (see Fig. 1). Near the PZC, the pseudocapacitance is negligible, but at potentials further away from the PZC, the pseudocapacitive contribution starts to dominate, always leading to an increase in total capacitance. This pseudocapacitance increase is not part of our discussion and will also not be considered in the model that will be introduced in the double layer model section. Additionally, we would like to note that there is some experimental variation visible in the baseline of the capacitance curves as well as in the peak height of the peak positive to PZC, which changes in 0.1 mM HClO4 electrolytes in Fig. 2 A–C (red curves). We attribute this to experimental limitations in generating exactly the same conditions for each experiment and the limited cleanliness of the HClO4 electrolyte (see Experimental).
Fig. 2.
Double-layer capacitance around PZC of Pt(111) in (A) 0.1 mM HClO4 + x mM LiClO4, (B) 0.1 mM HClO4 + x mM NaClO4 [taken from our previous report (3)], and (C) 0.1 mM HClO4 + x mM CsClO4. All the CVs were scanned at a scan rate of 10 mV/s. Blue dots show the minimum of the capacitance curves.
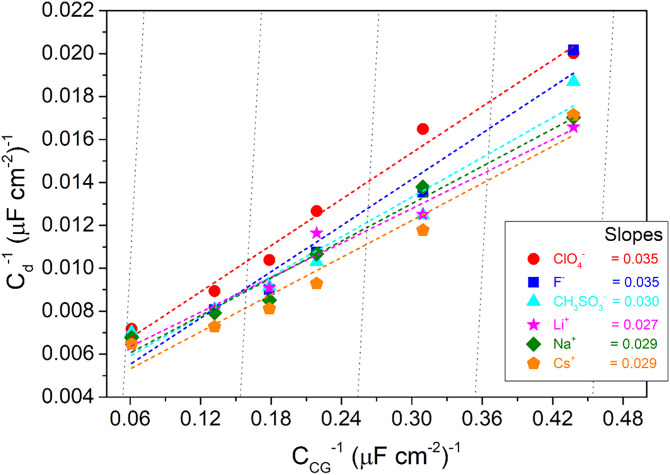
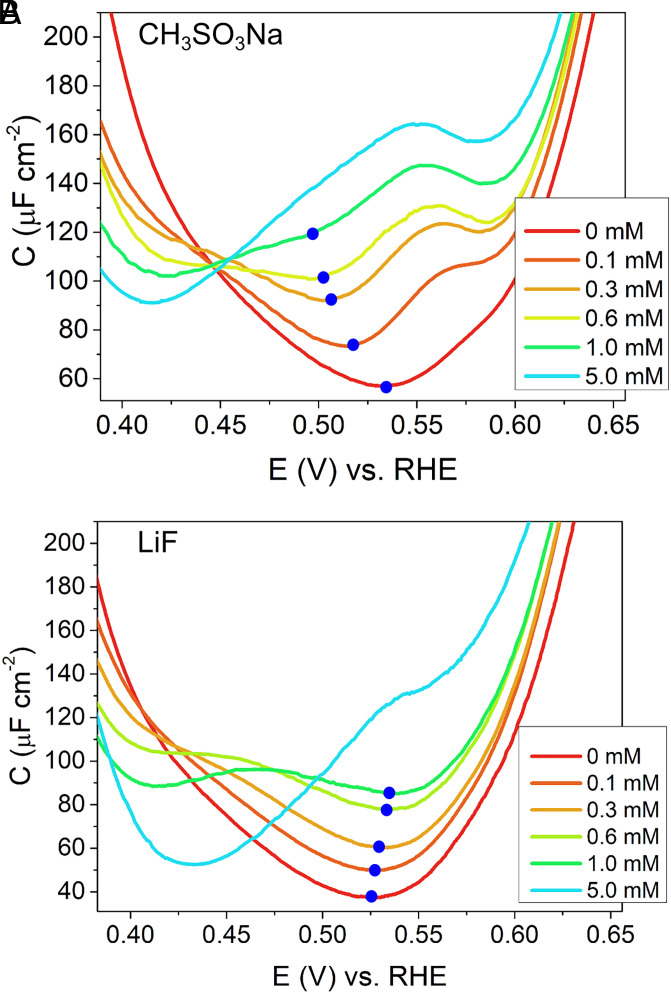
We first focus on the capacitance values obtained at PZC (at 0.53 VRHE at pH = 4, see Eq. 3). As discussed in the introduction, significant deviations from the GCS behavior have been found previously for Pt(111) electrode surfaces in contact with dilute NaClO4 electrolyte solutions (3). If the capacitance follows the predictions by GCS theory, Eqs. 1 and 2 predict that the capacitance should show a minimum at PZC. However, for Pt(111) in contact with NaClO4 electrolyte solutions, no capacitance minimum was found at the PZC for concentrations as low as 5 mM (see Fig. 2B). Moreover, the slope obtained in a so-called Parsons–Zobel plot (in which the inverse of the experimental capacitance measured at PZC is plotted versus the inverse of the Gouy–Chapman capacitance for different electrolyte concentrations c) should be 1 according to GCS theory. In the case of Pt(111) in contact with an NaClO4 electrolyte, however, the slope obtained in the Parsons–Zobel plots is much smaller than 1 (see Fig. 4). The data for LiClO4, CsClO4 (Fig. 2 A and C), NaCH3SO3, and LiF (Fig. 3) reveal that this anomalous behavior is not limited to NaClO4 electrolytes but that this is a general feature of the Pt(111) double layer and that the slope obtained in the Parsons–Zobel plots is insensitive to the nature of the electrolyte (see Fig. 4). A reduced Parsons–Zobel slope can be rationalized as the consequence of a weak, attractive ion–surface interaction, as demonstrated in ref. 7 using extended mean-field models, and the slope depends on the ion–surface interaction strength. As the slope is similar for all electrolytes studied, we conclude that the ion–surface interaction has to be of the same (or similar) strength for all ions (possibly including cations and anions), suggesting that the origin of the attractive interaction is nonchemical in nature.
Fig. 4.
Parsons–Zobel plot for various electrolytes of different anions and cations (e.g., ClO4−, F−, CH3SO3−, Li+, Na+, and Cs+) for the double-layer capacitance evaluated at the PZC of 0.53 VRHE. The capacitance data corresponding to ClO4− and F− were taken from our previous report (3); the data for CH3SO3− are from Fig. 3A. Data for various anions correspond to same counter cation, Na+, and all the cation data correspond to the same ClO4− counter anion. The dotted gray lines indicate a slope of 1 corresponding to ideal Gouy–Chapman behavior.
Fig. 3.
Double-layer capacitance around PZC of Pt(111) in (A) 0.1 mM CH3SO3H + x mM CH3SO3Na and (B) 0.1 mM HF + x mM LiF. All the CVs were scanned at the scan rate of 10 mV/s. Blue dots show the minimum of the capacitance curves.
Despite this similarity observed for different electrolytes, not all characteristics of the capacitance curves on Pt(111) at low concentrations are independent of the ion identity. In particular, the behavior of the potential of the minimum in capacitance (marked by blue dots in the figures) depends on the electrolyte. According to GCS theory, the potential of minimum capacitance should be located at the PZC. This is indeed the case at very low electrolyte concentrations, as shown in Fig. 2 A–C for the various electrolytes used. With increasing ionic strength, however, the potential of minimum capacitance in perchlorate electrolyte shifts depending on the nature of the cation. Negative and positive shifts on the order of several tens of mV (millivolts) for an increase of ion concentration from 0.1 mM to 5.1 mM are observed for LiClO4 (Fig. 2A) and CsClO4 (Fig. 2C), respectively, whereas there is no noticeable shift for increasing concentrations of NaClO4. The shift cannot be due to different interaction strengths of the cations, as the Parsons–Zobel plots in Fig. 4 suggest an equal (or similar) ion–surface attraction for cations and anions, thus not introducing any asymmetry into the double-layer structure. Since the potential of minimum capacitance shifts to more negative potentials in the case of LiClO4, stays constant for NaClO4, and shifts toward more positive potentials in the case of CsClO4, this sequence suggests a relation with cation size or inverse hydration energy. Focusing on the hydration energy of the ions, no (or negligible) shift is observed for NaClO4: in this case, the anion (ClO4−) and the cation (Na+) have a similar hydration energy (14). When ClO4− is combined with a more strongly hydrated cation (Li+), the minimum in capacitance shifts toward more negative potentials, and when it is combined with a more weakly hydrated cation (Cs+), the capacitance minimum shifts toward more positive potentials with increasing ionic strength. Similar trends for the shift in the potential of minimum capacitance as a function of the relative hydration energies of the ions involved are shown for CH3SO3Na and LiF in Fig. 3: CH3SO3Na combines a weakly hydrated anion with a moderately hydrated cation and resembles LiClO4. LiF combines two strongly hydrated ions and shows only a weak shift in the potential of minimum capacitance with increasing concentration. Considering that HF + LiF acts as a buffer solution, the behavior of LiF is similar to that of NaClO4. Increasing the concentration from 0 M LiF to 5 mM LiF changes the pH from 4.1 to 4.9, thus shifting the PZC by ∼47 mV. In Fig. 3B, the small positive shift in the minimum of ∼10 mV on the RHE scale for LiF when going from 0 to 1 mM LiF would thus, in fact, correspond to a (small) negative shift of ∼9 mV on the NHE scale (SI Appendix, Fig. S1). For CH3SO3Na (Fig. 3A), no such buffering effect takes place and the shift remains significantly larger. The potential of minimum capacitance thus depends on the nature of the cation and anion—more precisely, on their relative hydration energy or place in the Hofmeister series (14). In our mean-field model (7), such a behavior can be rationalized as the consequence of an interplay of the hydrated ion size and an attractive ion–surface interaction. The differences in ion size lead to small asymmetries in the double-layer structure and thereby give rise to a shift in potential of minimum capacitance that is consistent with the observations made here, as we will illustrate in the section on the Double-Layer Model.
Further insight on the structure of the Pt(111)–electrolyte interface can be gained by studying the capacitance of Pt(111)–electrolyte interfaces further away from PZC (or the capacitance minimum) and at higher bulk ion concentrations, as discussed in the following section.
Double-Layer Capacitance away from PZC.
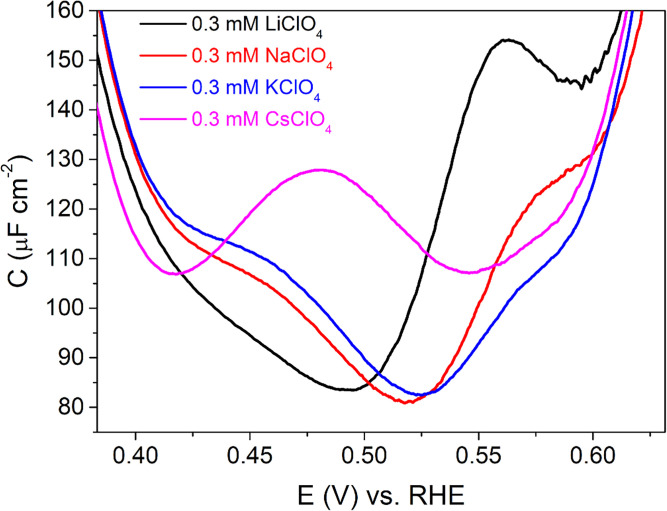
At potentials further away from PZC, capacitance peaks develop positive and/or negative of PZC (see, for example, the results for 0.3 mM solutions in Fig. 2). Considering the discussion in the section on double-layer capacitance at low ionic strength close to pzc, it seems likely that these peaks are related to the attraction of anions and/or cations, respectively. Therefore, we may gain more insight into the nature of the double layer by studying these peaks more closely.
Unfortunately, the height of the peaks depends sensitively on the experimental conditions. This is visible in the data presented, as the intensity of the peak positive of PZC obtained for the baseline of 0.1 mM HClO4 differs in the three experiments shown in Fig. 2 A–C (red line). We therefore focus on the relative height of the peak positive and negative of PZC and the peak position rather than the absolute peak heights. The relative peak height seems to depend on the cation identity (compare, for example, Figs. 2 A–C and 3). A similar observation is true for the peak position of the peak negative of PZC, as shown in more detail in Fig. 5. Specifically, it appears that the height of the peak is related to the size or the hydration energy of the ion, with the larger (less hydrated) ion leading to a more prominent peak. We will discuss these observations in more detail in Double-Layer Model by introducing a model that can explain these observations.
Fig. 5.
Comparison between double-layer capacitance curves at pH 4 in 0.1 mM HClO4 + 0.3 mM MClO4 (M = Li, Na, K, and Cs).
Double-Layer Capacitance at Higher Concentrations.
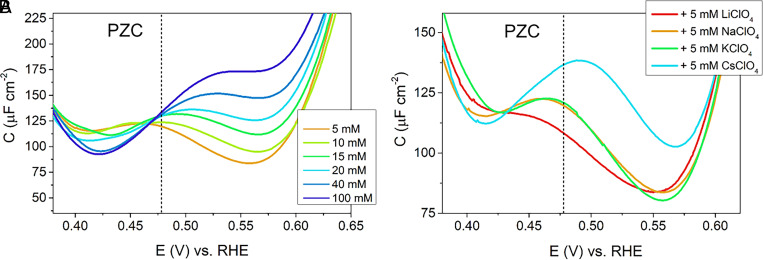
At higher ion concentrations around 5 mM, the behavior of the capacitance curves changes: while at low concentrations, the capacitance curves exhibit two peaks, one positive and one negative of PZC; these two peaks merge into a single peak at higher concentrations (see Fig. 2 A–C). This single peak is reminiscent of the capacitance peak observed by Pajkossy and Kolb at pH = 2 in 100 mM KClO4 electrolyte solutions (2). They attributed the peak to the reorientation of the water at the interface, causing a change in dipole moment (2). Consistent with the data by Pajkossy and Kolb (15), we observe this peak to increase in intensity at higher electrolyte concentrations (measured here for NaClO4 and KClO4 at pH = 3), and the peak position shifts to higher potentials with higher concentration (see Fig. 6A for NaClO4 and SI Appendix, Fig. S2 for KClO4). Additionally, we find the peak position at constant electrolyte concentration to depend on the hydration strength of the cation (see Fig. 6B, showing the peak position shifting to more positive potentials the more weakly hydrated the cation). The increase in peak height, as well as the shift of the peak, cannot be explained satisfactorily by water reorientation alone. Instead, the water reorganization must be influenced by the presence of ions and/or the peak must be influenced indirectly by the ion attraction–induced change in capacitance. In the next section, we will suggest a model in which both effects, the presence of ions and the water structure, play an important role in determining the double-layer capacitance not only at the low concentrations discussed in the previous sections but also at the higher concentrations discussed in this section.
Fig. 6.
Capacitance curves showing the double-layer region of Pt(111) (A) in 1mM HClO4 + x mM NaClO4 (x = 5 to 100 mM) at pH 3 and (B) in presence of different cations (1 mM HClO4 + 5 mM MClO4, M = Li, Na, K, Cs). Dotted lines represent PZC as determined from Eq. 3.
Double-Layer Model.
In the previous section, we argued that many of our observations might be the consequence of a cross-influence of water reorganization and the presence of (hydrated) ions that are attracted to the surface. In order to test this hypothesis, we combine here two models that have previously been put forward to explain individually the Pajkossy–Kolb peak on the one hand and the deviations from the GCS behavior on the other hand. This combined model gives a more refined picture of the double layer and allows us to rationalize many of the experimental features of the Pt(111) double-layer capacitance.
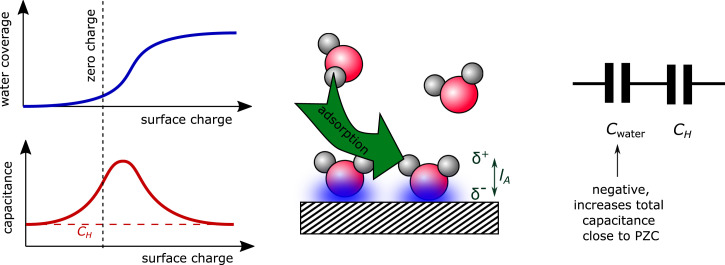
The Pajkossy–Kolb peak has been related previously to a potential- or field-induced reorientation of the interfacial water molecules (2, 15). Such a (sudden) reorientation of water molecules leads to a strong nonlinear dielectric polarizability of the interfacial water layer in a narrow potential window, causing a peak in the double-layer capacitance. This idea is supported experimentally by infrared (IR) measurements (16) and laser-induced temperature-jump measurements (17), both indicating the reorientation of water close to PZC, as well as computationally (18) via density functional theory–based molecular dynamics calculations at constant potential. An alternative explanation for the Pajkossy–Kolb peak has been put forward recently by Le et al. (19). They suggest that the Pajkossy–Kolb peak results from a water adsorption–induced polarization of the metal–electrolyte interface: As the electrode becomes more positively charged, close to the PZC, it becomes more favorable for water molecules to chemisorb to the surface in an O-down configuration. This chemisorption process causes the interface to become polarized in the direction opposing the surface electric field due to 1) the orientation of the chemisorbed water being opposite to that of the physiosorbed water and 2) the fact that electrons are transferred from the water molecule to the surface in the chemisorption process. Taken together, these effects induce a dipole of length , the charge of which grows with increasing water coverage. This dipole opposes the electric field as sketched schematically in Fig. 7. Similar to the models suggested earlier, this leads to a strong additional polarization counteracting the electric field in the narrow potential window in which the water coverage increases strongly. As suggested by Le et al., this effect can be captured effectively by adding a field-dependent negative capacitance in series to the Helmholtz capacitance. In addition to the dipole length , the model by Le et al. has two other important parameters: the strength of the dipole per water molecule and the coverage of adsorbed water at the PZC; for details, see Theoretical Model. As the model by Le et al. allows for quantitative predictions, we use the model by Le et al. (with slightly adjusted parameters—see Theoretical Model) here to account for the Pajkossy–Kolb-like peak and to combine it with our previous model accounting for an attractive ion–surface attraction.
Fig. 7.
Schematic representation of the water adsorption–induced change in capacitance as suggested by Le et al. (19).
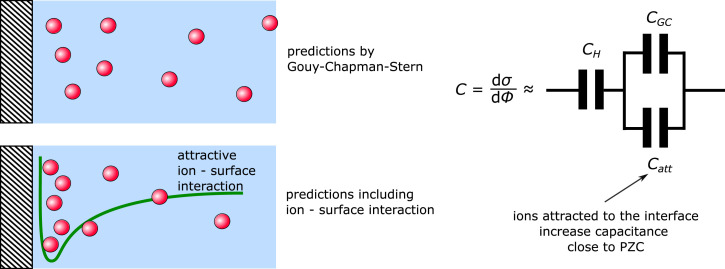
The idea of an attractive ion–surface interaction has been invoked previously in order to rationalize deviations from the GCS model observed on Pt(111) (3, 7) and Au electrodes (20). The reduced Parsons–Zobel slopes obtained experimentally at these interfaces can be captured by a simple analytical model, which adds an additional capacitive element in parallel to the Gouy–Chapman capacitance in the GCS model (7):
| [4] |
The additional capacitive element accounts for the attractive ion–surface interaction within a mean-field description. The trends observed experimentally for the location of minimum capacitance as a function of ion hydration (see previous sections) can be captured in a somewhat more involved numerical free-energy model (7) as sketched in Fig. 8. We use this numerical model here to account for GCS-like contributions and the hypothesized ion–surface interactions, including specific ion effects, and will refer to the resulting capacitance as . For details on this model, we refer to the original publication (7) and the Theoretical Model section.
Fig. 8.
Schematic model of the mean-field model used to describe attractive ion–surface interaction.
We combine the model by Le et al. (19) with the model for ion-surface attraction (7) in a simple, non–self-consistent fashion (i.e., we approximate the combined capacitance resulting from Gouy–Chapman-like contributions, ion attraction, and water reorganization as two capacitors in series via
| [5] |
where all contributions are potential dependent). For details, we refer to the Theoretical Model section.
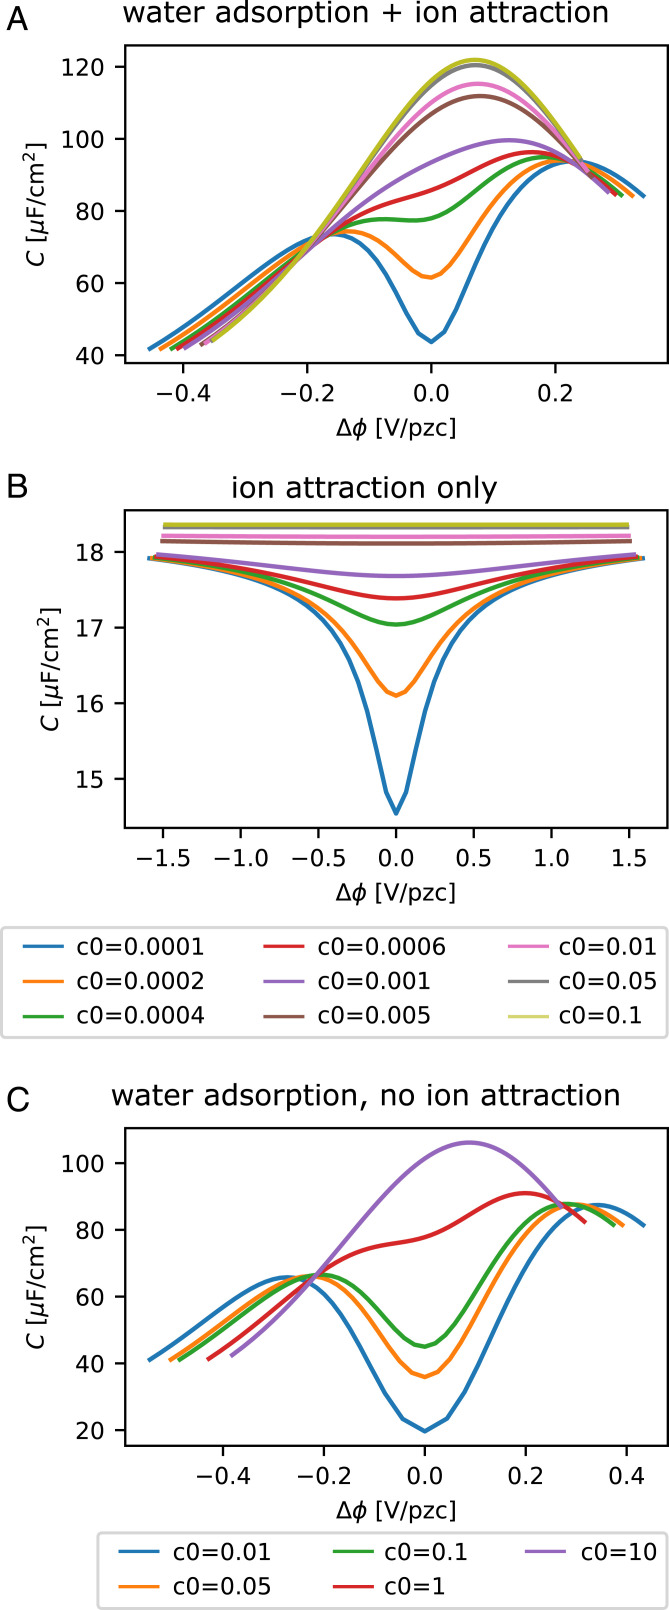
Fig. 9A shows the results obtained from our combined “water adsorption + ion-attraction model” for a range of different ion concentrations. In order to disentangle the different effects, we show results obtained for the two models separately in Fig. 9 B and C. At high concentrations, the model by Le et al. (Fig. 9C) can clearly capture the Pajkossy–Kolb-like peak. At the ion concentrations considered in this paper, however (0.1 to 100 mM), the model by Le et al. predicts a capacitance minimum close to PZC rather than a single capacitance peak. This minimum, which is a consequence of the low Gouy–Chapman capacitance at low ion concentrations, can be avoided at medium low-ion concentrations by allowing for an attractive interaction between the ions and the Pt(111) surface, as modeled in Fig. 9B. However, the ion-attraction model alone cannot describe a Pajkossy–Kolb-like peak at concentrations above 5 mM, nor can it reproduce the two peak–like structure (i.e., peaks above and below PZC) visible in Fig. 2 at concentrations below 5 mM. Capacitance curves reminiscent of those obtained in the measurements at pH = 3 and pH = 4 on Pt(111) can only be obtained if the two models are combined (Fig. 9A). Note that the sharp increase in capacitance observed in the experiment for potentials considerably larger or smaller than the PZC (Figs. 2, 3, 5, and 6) is due to specific adsorption of hydrogen and hydroxyl (HUPD and OHads in Fig. 1) and is hence not captured in the present model. As a result, the capacitance minima in the experimental capacitance plots are not reproduced, as they are due to the increase in the pseudocapacitance. The model’s validity is thus constrained to a narrow (double layer) potential region.
Fig. 9.
Model results: (A) water adsorption + ion attraction [model by Le et al. (19) combined with model from ref. 7]; (B) ion attraction only (model from ref. 7); and (C) water adsorption without ion attraction (model by Le et al. only). All figures are obtained assuming an equal hydrated ion size for the cation and the anion. The parameters for the mean-field model with ion–surface attraction are similar to those in figure 8 in ref. 7 with Å and ramped from 4 to 80 in the interval [1.8,2.3] Å to match the model by Le et al. Hydrogen and the hydroxide adsorption are not considered in this model; the observed increase of (pseudo)capacitance at low and high potentials (see Fig. 1) is thus not captured.
The combined model can capture several effects, as illustrated in Fig. 9A: 1) at “high” concentrations above 5 mM, a Pajkossy–Kolb-like peak is predicted. This peak continues to grow as the ion concentration is increased. This continuous increase is observed because the strong polarization caused by the adsorbing water amplifies small changes in the ion-induced capacitance, thus leading to a continuous peak growth at the concentrations considered. 2) As the electrolyte concentration is decreased, the single peak “splits” into two peaks, one positive of PZC and one negative of PZC. The minimum in between lies close to PZC and is a consequence of a low Gouy–Chapman capacitance and a low ion-attraction capacitance at these concentrations. 3) While the minimum deepens for lower ion concentrations, the width of the water-adsorption peak (which is now intersected by the Gouy–Chapman + ion-attraction minimum) broadens with lower electrolyte concentration, and the two peaks appear to move apart, consistent with the observations made in Fig. 2. The broadening of the water-adsorption peak is a consequence of the lowered electric field at any given potential as a result of the lower capacitance close to PZC. Although a similar peak structure can be achieved by introducing a maximum ion concentration in the mean-field model used to describe the GCS capacitance with ion–surface attraction, the maximum ion concentrations that would be required to achieve such a sharp peak would be unreasonably low, and we consider the explanation in which the peaks are the consequence of a water-induced polarizability close to PZC much more likely.
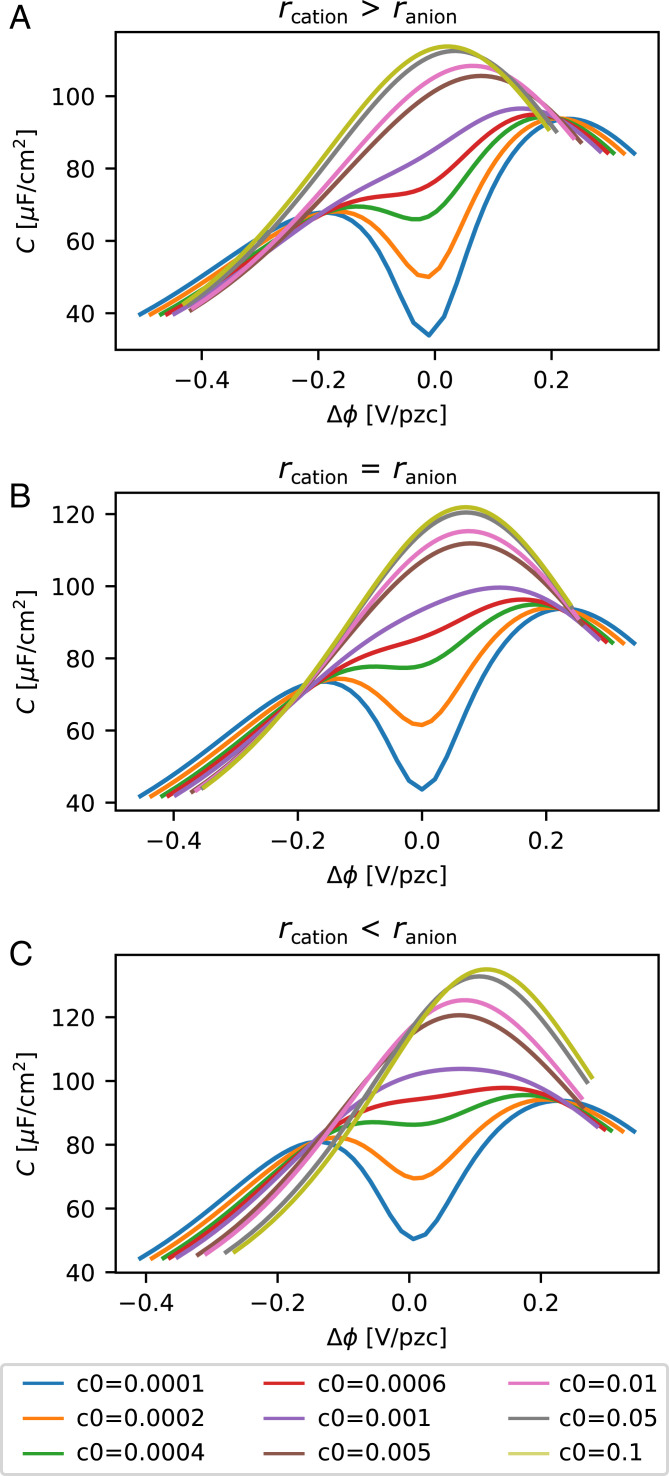
The model illustrated in Fig. 9 can be extended by allowing for different ion hydration radii of anions and cations. The predicted capacitance curves are shown in Fig. 10 A–C. The three different cases shown (rcation > ranion, rcation = ranion, and rcation < ranion) may be considered as models for the three different electrolytes LiClO4, NaClO4, and CsClO4, respectively.
Fig. 10.
Model results: water adsorption + ion attraction. (A) The cation has a larger hydrated ion radius than the anion (model for LiClO4; Å). (B) The cation and anion have the same hydrated ion size (model for NaClO4; Å) and (C) the cation has a smaller hydrated ion radius than the anion (model for CsClO4; Å). All other parameters are identical to Fig. 9A.
Inclusion of different ion sizes in the model allows us 1) to capture the shift in the potential of minimum capacitance observed in Fig. 2 A and C and 2) to capture a shift of the Pajkossy–Kolb-like peak at high concentrations. The latter is likely a consequence of a shift in PZC predicted by the model for increasing ion concentration in the case of unequal ion sizes due to a dipole layer formed by the differently sized ions attracted to the surface. As the Pajkossy–Kolb-like peak is expected to occur at a fixed field strength, the shift of PZC also shifts the Pajkossy–Kolb peak. 3) Finally, inclusion of different ion sizes also allows us to capture a change in relative peak height between the anion and the cation peaks at potentials positive and negative of PZC, respectively, as observed in Fig. 2 A–C, as a consequence of a relative shift between the capacitance minimum and the Pajkossy–Kolb maximum. Taken together, we conclude that the combined model of ion–surface attraction and water adsorption–induced polarization of the metal–electrolyte interface captures the overall features of the experimental double-layer capacitance for Pt(111) at low concentrations.
However, a few specific features cannot be explained by the current model. The shift in the Pajkossy–Kolb-like peak for different cation types, as shown in Fig. 6B, for instance, is not reproduced by the simple model. Such a peak shift could, however, be the consequence of an interplay between the water–ion and the water–surface interaction, and the parameters for and may be altered by the presence of different ions at the interface.
Another potential shortcoming of the model is that it cannot capture the lower capacitance observed for LiF compared to NaClO4 (compare Figs. 2B and 3B), which both combine similarly strongly solvated ions. However, this shortcoming may be remedied by allowing for another cross-influence of the ions and the characteristics of the water-adsorption process at the surface: if, in the presence of strongly solvated ions, such as F−, the distance of charge separation caused by the chemisorption-induced electron transfer from the water to the surface is reduced, then the Pajkossy–Kolb-like peak caused by the water-adsorption process broadens and flattens, thereby lowering the effective capacitance and the visibility of any cation- and anion-related peaks. The fact that we adjusted in Figs. 9 and 10 to larger values than those obtained computationally in the presence of strongly solvated ions (19) supports this hypothesis.
Finally, let us comment on the expected applicability of our model to other metal electrodes. Deviations from ideal GCS behavior have also been observed for gold and silver single-crystal electrodes (3, 20, 21); they show Parsons–Zobel slopes significantly smaller than unity, presumably due to the same (but weaker) attraction of ions to the interface as observed here with Pt(111). The question of why this weak interaction is sensitive to the nature of the metal electrode requires further research; one may speculate that the strong binding of water to Pt might reduce the orientational polarizability of water close to the surface, thereby increasing image charge interactions. Also, the interaction with water is expected to be weaker on Ag and Au, but detailed experimental data will be needed to assess how this part of our model would affect the corresponding double-layer capacitance. Note that metals (or facets of Pt) that bind water more strongly than Pt(111) are also more likely to dissociate water; as a result, they may not exhibit an ideally polarizable double-layer window (9).
Summary and Conclusion
Here, we have presented detailed measurements of the double-layer capacitance of the Pt(111)–electrolyte interface close to the PZC at low bulk ion concentrations in the presence of several different electrolytes. We thereby identified several unexpected results, the most noteworthy of which are 1) the experimental indication for an attractive ion–surface interaction that is largely independent of ion type and ion species and 2) a rich peak structure that seems to depend on the hydration strength of the ions in the electrolyte.
Based on our capacitance measurements, we formulate a model for the structure of the electric double layer of the Pt(111)–electrolyte interface that goes significantly beyond the GCS theory. By combining two known models, namely, one capturing the water reorganization on Pt close to the PZC and one accounting for an attractive ion–surface interaction not included in the GCS model, we are able to reproduce and interpret main features observed in the capacitance of the Pt(111)–electrolyte interface. This model suggests that a picture of the double layer, in which an increased ion concentration close to the interface as a consequence of a weak attractive ion–surface interaction, and the increased polarizability of the Pt(111)–water interface due to adsorbing water, play a major role. This model of the double-layer capacitance suggests that the structure of the double layer on single-crystal platinum surfaces is much richer than previously anticipated. We expect these results to motivate further detailed double-layer studies on other metal electrodes as well as studies on the impact of this double-layer structure on electrochemical kinetics.
Experimental
All the electrochemical cells were placed overnight into a mixture of H2SO4 and potassium permanganate. Before electrochemical experiments, the glassware was rinsed with a mixture of H2O, H2SO4, and H2O2. Subsequently, glassware was boiled and washed several times with ultrapure water. All the electrochemical investigations were done using a Bio-Logic VSP300 potentiostat in a three-electrode configuration at room temperature. A Pt(111) single-crystal bead having an area of 0.08 cm2 was used as a working electrode. The Pt(111) single crystal was grown and polished following the procedure reported by Arulmozhi et al. (22, 23) A Pt wire and homemade RHE were used as counter and reference electrodes, respectively. A standard glass cell was used for electrochemistry in various acid electrolytes except for HF, for which a fluorinated ethylene propylene (Nalgene) electrochemical cell was used. Prior to each measurement, the Pt(111) single-crystal surface was treated by flame annealing and, subsequently, immediately brought into contact with an Ar:H2 (4:1) environment. After cooling down to room temperature, the crystal surface was protected with a drop of water saturated with the same gas mixture and then quickly transferred to the electrochemical cell. The hanging meniscus configuration of the crystal with the electrolyte was made under controlled potential of 0.1 V versus RHE. The quality of the crystal and cleanliness of the cell were checked by recording a blank voltammogram of the Pt(111) in the 0.1 M HClO4 electrolyte purged with Ar (Linde 6.0). An Ar gas blanket above the electrolyte was maintained during the measurement to circumvent any interference of oxygen from air.
Capacitance Curves.
The capacitance curves were obtained by dividing the current density obtained from the voltammetry by the scan rate (10 mV/s). Cyclic voltammogram measurements were done with correction for the high solution resistance of the dilute electrolytes using IR compensation. The capacitance values obtained in this way agree very well with the capacitance value obtained by impedance measurements (SI Appendix, Fig. S3). Kolb et al. have shown similar capacitance values obtained by both impedance and CV techniques (2).
Deviations in the baseline and the exact shape of the capacitance curves in, for example, Fig. 2 are related to experimental uncertainties related to the micropipetting (used for the making the ultralow electrolyte concentrations), meniscus formation, and annealing of the single crystal. Also, we find that measurements in H2SO4 show better reproducibility than those in the HClO4 electrolyte. This is most likely related to the higher cleanliness of the H2SO4 electrolyte.
Materials
Ultrapure water (Milli-Q, 18.2 ΜΩ cm) and high-purity reagents HClO4 (60% Suprapur, Sigma), KClO4 (99.995%, Sigma), NaClO4 (99.99%, Sigma), LiClO4 (99.995%, Sigma), CsClO4 (99.99%, Sigma), LiF (99.995%, Sigma), CH3SO3H (99.0%, Sigma), CH3SO3Na (99.99%, Sigma), NaF (99.99, Sigma), and HF (40%, suprapur, sigma) were used to make electrolytes.
We note that CsClO4 generally has a high content of impurities. We purified CsClO4 by multiple recrystallizations in ultrapure water until we got the CV of Pt(111) in CsClO4 as shown in SI Appendix, Fig. S4.
Theoretical Model
We describe the capacitance of Pt(111) by combining a model including water adsorption, as suggested by Le et al. (19), and a GCS-like capacitance with attractive ion–surface interaction, as suggested in ref. (7), in a non–self-consistent manner. Detailed explanations of the individual models can be found in the respective refs. Here, we briefly summarize the main points and explain how the models are combined.
The model for attractive ion–surface interaction is based on a mean-field, free energy–based description of the interface, similar to the GCS model. The main difference is the inclusion of an attractive ion–surface interaction. The capacitance of this system is obtained my minimizing the free-energy functional given in atomic units here:
| [6] |
where defines the distance from the surface, is the electrostatic potential, is the entropy density, is the charge density on the metal, is the charge density caused by the ions, is the ion concentration (where and 2 denotes anions and cations, respectively) and is the chemical potential, is the temperature, and is the dielectric permittivity of the water. The ion–surface attraction is introduced via the function , which contains an attractive region that is chosen to be identical for anions and cations and a repulsive region close to the surface, mimicking a Stern layer at . The value for can differ for cations and anions. The exact functional forms of and can be found in the original ref. Minimizing the free-energy functional leads to a second-order differential equation that can be solved numerically, giving a relation between the surface charge and the potential drop over the interface that can be used to numerically extract the interfacial capacitance . As this model is mean-field based, it captures a GCS-like capacitance with an additional term stemming from an ion–surface attraction, in which the latter is chosen to affect both anions and cations as suggested in ref. 7. The model cannot, however, treat any possible additional polarization due to the adsorption of water molecules to the interface.
The model by Le allows us to capture an additional polarization of the interface due to adsorbed water. According to the model, the polarization caused by the adsorbing water depends on 1) the dipole caused per adsorbed water molecule, 2) the distance of charge separation , and 3) the water coverage at the potential considered. The coverage is described by an adsorption isotherm similar to a Frumkin isotherm. The potential-dependent term is thereby given by , where is the electric field at the electrode surface created by the charges on the electrode and shielded by the (remaining) dielectric response at the interface. The repulsive element in the Frumkin isotherm is caused by the interaction of the dipole with the mean field that is created by the water molecules that are already adsorbed. The chemisorption energy of water to the surface determines the coverage at zero surface charge. The fit parameters , and were determined by Le et al. based on DFT molecular dynamics calculations (here, is the maximum water coverage and is the dielectric permittivity close to the interface). We use these parameters, except for which mainly modulates the width of the adsorption isotherm, which we set to 2 Å instead of 1.7 Å in order to obtain a better match with the experiment. We argue that such a change is legitimate, as density functional theory typically has problems in correctly describing charge transfer, rendering the value obtained for somewhat uncertain. The coverage at zero charge was extracted from a plot in ref. 19 and was determined to be 0.2. Using the model for water adsorption described in the previous paragraph, the surface charge-dependent water coverage is given by (19)
| [7] |
where is the vacuum permittivity, accounts for the fact that the surface charge should be zero at , and denotes the number of adsorption sites per unit area. The water coverage, in turn, leads to a potential drop via the dipole created by the water molecules
| [8] |
where is set to such that the potential is zero at PZC (i.e., the potential is measured relative to PZC). The original formulation of the model by Le et al. was developed for high ionic strength, thus disregarding the Gouy–Chapman capacitance, and without considering any possible ion–surface interaction. The total capacitance was hence written as
| [9] |
Here, we combine the model for the GCS-like capacitance with ion–surface attraction non–self-consistently with the idea of water adsorption by replacing with . That is, we replace Eq. 9 with Eq. 5 such that, additionally to the Stern capacitance, the Gouy–Chapman-like capacitance and an ion–surface interaction are taken into account.
To compute the total capacitance as a function of potential, we first solve for for a dense mesh of values. Then, we find the water coverage corresponding to each surface charge from Eq. 7 and compute the corresponding potential drop , which we add to in order to obtain the total potential drop , in accordance with the idea of capacitors in series as suggested by Eq. 5. The total (inverse) capacitance can either be obtained by numerically differentiating or by computing from and from and applying Eq. 5.
Supplementary Material
Footnotes
The authors declare no competing interest.
This article is a PNAS Direct Submission.
This article contains supporting information online at https://www.pnas.org/lookup/suppl/doi:10.1073/pnas.2116016119/-/DCSupplemental.
Data Availability
Capacitance data and codes used to generate capacitance curves are available in Zenodo at https://zenodo.org/record/5834860#.YeAtEf7MI2z.
References
- 1.Magnussen O. M., Groß A., Toward an atomic-scale understanding of electrochemical interface structure and dynamics. J. Am. Chem. Soc. 141, 4777–4790 (2019). [DOI] [PubMed] [Google Scholar]
- 2.Pajkossy T., Kolb D. M., Double layer capacitance of Pt(111) single crystal electrodes. Electrochim. Acta 46, 3063–3071 (2001). [Google Scholar]
- 3.Ojha K., Arulmozhi N., Aranzales D., Koper M. T. M., Double layer at the pt(111)-aqueous electrolyte interface: Potential of zero charge and anomalous Gouy-Chapman screening. Angew. Chem. Int. Ed. Engl. 59, 711–715 (2020). [DOI] [PMC free article] [PubMed] [Google Scholar]
- 4.Grahame D. C., The electrical double layer and the theory of electrocapillarity. Chem. Rev. 41, 441–501 (1947). [DOI] [PubMed] [Google Scholar]
- 5.Bard A. J., Faulkner L. R., Electrochemical Methods Fundamentals and Applications (John Wiley & Sons, Inc., 2001). [Google Scholar]
- 6.Grahame D. C., Differential capacity of mercury in aqueous sodium fluoride solutions. I. Effect of concentration at 25°. J. Am. Chem. Soc. 76, 4819–4823 (1954). [Google Scholar]
- 7.Doblhoff-Dier K., Koper M. T. M., Modeling the Gouy–Chapman diffuse capacitance with attractive ion–surface interaction. J. Phys. Chem. C 125, 16664–16673 (2021). [Google Scholar]
- 8.Schmickler W., The effect of weak adsorption on the double layer capacitance. ChemElectroChem 8, 4158. (2021). [Google Scholar]
- 9.Koper M. T. M., Blank voltammetry of hexagonal surfaces of Pt-group metal electrodes: Comparison to density functional theory calculations and ultra-high vacuum experiments on water dissociation. Electrochim. Acta 56, 10645–10651 (2011). [Google Scholar]
- 10.Climent V., Gómez R., Orts J. M., Feliu J. M., Thermodynamic analysis of the temperature dependence of OH adsorption on Pt(111) and Pt(100) electrodes in acidic media in the absence of specific anion adsorption. J. Phys. Chem. B 110, 11344–11351 (2006). [DOI] [PubMed] [Google Scholar]
- 11.Martínez-Hincapié R., Climent V., Feliu J. M., Peroxodisulfate reduction as a probe to interfacial charge. Electrochem. Commun. 88, 43–46 (2018). [Google Scholar]
- 12.Rizo R., Sitta E., Herrero E., Climent V., Feliu J. M., Towards the understanding of the interfacial pH scale at Pt(111) electrodes. Electrochim. Acta 162, 138–145 (2015). [Google Scholar]
- 13.Sebastián P., Martínez-Hincapié R., Climent V., Feliu J. M., Study of the Pt(111) | electrolyte interface in the region close to neutral pH solutions by the laser induced temperature jump technique. Electrochim. Acta 228, 667–676 (2017). [Google Scholar]
- 14.Marcus Y., Effect of ions on the structure of water: Structure making and breaking. Chem. Rev. 109, 1346–1370 (2009). [DOI] [PubMed] [Google Scholar]
- 15.Pajkossy T., Kolb D. M., On the origin of the double layer capacitance maximum of Pt(1 1 1) single crystal electrodes. Electrochem. Commun. 5, 283–285 (2003). [Google Scholar]
- 16.Iwasita T., Xia X., Adsorption of water at Pt(111) electrode in HClO4 solutions. the potential of zero charge. J. Electroanal. Chem. (Lausanne) 411, 95–102 (1996). [Google Scholar]
- 17.Climent V., Coles B. A., Compton R. G., Coulostatic potential transients induced by laser heating of a Pt(111) single-crystal electrode in aqueous acid solutions. Rate of hydrogen adsorption and potential of maximum entropy. J. Phys. Chem. B 106, 5988–5996 (2002). [Google Scholar]
- 18.Bouzid A., Pasquarello A., Atomic-scale simulation of electrochemical processes at electrode/water interfaces under referenced bias potential. J. Phys. Chem. Lett. 9, 1880–1884 (2018). [DOI] [PubMed] [Google Scholar]
- 19.Le J. B., Fan Q. Y., Li J. Q., Cheng J., Molecular origin of negative component of Helmholtz capacitance at electrified Pt(111)/water interface. Sci. Adv. 6, eabb1219 (2020). [DOI] [PMC free article] [PubMed] [Google Scholar]
- 20.Eberhardt D., Santos E., Schmickler W., Impedance studies of reconstructed and non-reconstructed gold single crystal surfaces. J. Electroanal. Chem. (Lausanne) 419, 23–31 (1996). [Google Scholar]
- 21.Hamelin A., Foresti M. L., Guidelli R., Test of the Gouy-Chapman theory at a (111) silver single-crystal electrode. J. Electroanal. Chem. (Lausanne) 346, 251–259 (1993). [Google Scholar]
- 22.Arulmozhi N., Jerkiewicz G., Design and development of instrumentations for the preparation of platinum single crystals for electrochemistry and electrocatalysis research, part 1: Semi-automated crystal growth. Electrocatalysis 7, 507–518 (2016). [Google Scholar]
- 23.Arulmozhi N., Jerkiewicz G., Design and development of instrumentations for the preparation of platinum single crystals for electrochemistry and electrocatalysis research, part 2: Orientation, cutting, and annealing. Electrocatalysis 8, 399–413 (2017). [Google Scholar]
Associated Data
This section collects any data citations, data availability statements, or supplementary materials included in this article.
Supplementary Materials
Data Availability Statement
Capacitance data and codes used to generate capacitance curves are available in Zenodo at https://zenodo.org/record/5834860#.YeAtEf7MI2z.


