Abstract
The year 2020 will certainly be remembered in human history as the year in which humans faced a global pandemic that drastically affected every living soul on planet earth. The COVID-19 pandemic certainly had a massive impact on human’s social and daily lives. The economy and relations of all countries were also radically impacted. Due to such unexpected situations, healthcare systems either collapsed or failed under colossal pressure to cope with the overwhelming numbers of patients arriving at emergency rooms and intensive care units. The COVID -19 tests used for diagnosis were expensive, slow, and gave indecisive results. Unfortunately, such a hindered diagnosis of the infection prevented abrupt isolation of the infected people which, in turn, caused the rapid spread of the virus. In this paper, we proposed the use of cost-effective X-ray images in diagnosing COVID-19 patients. Compared to other imaging modalities, X-ray imaging is available in most healthcare units. Deep learning was used for feature extraction and classification by implementing a multi-stream convolutional neural network model. The model extracts and concatenates features from its three inputs, namely; grayscale, local binary patterns, and histograms of oriented gradients images. Extensive experiments using fivefold cross-validation were carried out on a publicly available X-ray database with 3886 images of three classes. Obtained results outperform the results of other algorithms with an accuracy of 97.76%. The results also show that the proposed model can make a significant contribution to the rapidly increasing workload in health systems with an artificial intelligence-based automatic diagnosis tool.
Keywords: COVID-19, Chest X-ray, Feature fusion, Convolutional neural network, Classification
Introduction
The contagious severe acute respiratory syndrome coronavirus 2 (SARS-CoV-2) emerged in Wuhan, China near the end of the year 2019. It was then declared as a pandemic by World Health Organization (WHO) at the beginning of March 2020. Due to its rapid airborne transmission, the number of infected cases of COVID-19 disease exceeded 82 million and the number of fatalities exceeded 1.7 million by the end of the year 2020. These numbers tragically reached nearly 200 million infections and 4.27 million fatalities by the beginning of August 2021.
Such a rapid increase in the number of cases by the pandemic surpassed the capacity of hospitals in many countries both instrument-wise and staff-wise which put the whole healthcare systems in jeopardy. Therefore, it was crucial to be able to detect and isolate infected people in a fast, cheap, and reliable manner. The real-time polymerase chain reaction (RT-PCR) test is widely used for diagnosis. It has the drawback of giving late results and it is also sometimes inconclusive in negative cases. On the other hand, it was clear that even at the early stages of the infection, the chest imaging was showing clear indications of the infection by COVID-19 which in turn helped to make faster and accurate decisions by doctors/radiologists.
Based on these findings, many studies have been carried out to automatically diagnose tomography and X-ray images using image processing and artificial intelligence techniques. Wehbe et al. [1] developed a system called DeepCOVID-XR where they combined six different deep learning models with a binary classifier. They tested their system on a database of 17,002 X-ray images with two classes (normal, COVID-19). Al-Waisy et al. [2] had a preprocessing stage for their model that they applied on a smaller database with 800 X-ray images. They fused the weighted decisions of the two trained proposed models and managed to obtain very high results. Their result is hard to be generalized due to their small database. Researchers in [3] developed a CNN model that extracted two types of features from the X-ray images. These features were then fed to 4 different classifiers before combining their outputs. The dataset contained 4600 X-ray images collected from different public databases and achieved a very high accuracy rate. Ismael et al. [4] proposed different deep learning-based approaches (deep feature extraction, fine-tuning and end-to-end training) to classify 180 COVID-19 and 200 healthy chest X-ray images. They obtained the highest result (94.7% accuracy score) with deep features extracted from the ResNet50 model and SVM classifier. Alam et al. [5] used HOG and CNN as feature extractors from X-ray images before fusing them. They used the fused features to train a 2-class (normal, COVID-19) VGG classification network. They achieved a 98.36% accuracy score with fivefold cross-validation on a dataset consisting of a total of 5090 X-ray images which included 1979 COVID-19 positive images.
The previously mentioned results worked on databases with normal and COVID-19 classes. Other researchers conducted their studies on databases with three classes, namely; normal, COVID-19 and pneumonia. Togacar et al. [6] for instance, used preprocessing fuzzy color technique. The original images in a small database of 458 X-ray images with 295 COVID-19 positive images were used to construct and stack new images. They combined the features obtained from two different pre-trained networks using social mimic optimization on the stacked dataset using three classes with an SVM classifier. Abbas et al. [7] developed a system called DeTraC where they used AlexNet for feature extraction and transfer learning method with ResNet18 as a pre-trained network. Their database originally had 196 X-ray images that included 105 COVID-19 positive images. They increased the images with augmentation to 1764 images. On the other hand, Ozturk et al. [8] built a model named DarkCovidNet which was inspired by the DarkNet. They tested their system on a database of 1125 X-ray images which included 125 COVID-19 positive images. Moreover, Chowdhury et al. [9] created a public COVID-19 X-ray images database of 3487 X-ray images by combining several public sources. They used transfer learning on different pre-trained networks for COVID-19 diagnosis with two and three classes. While, they achieved the best performance with the CheXNet model on original images and, on augmented images, the DenseNet201 model achieved the best performance. Later on, they enlarged their database to a total of 3886 images.
All the accuracy results of the aforementioned researches were promising and showed high potential for using X-ray images for automatic and prompt diagnosis and detections of the COVID-19 on the infected patients. In this paper, a novel application of a 3-stream fusion-based deep learning model is proposed for the detection of COVID-19 and Viral Pneumonia based on chest X-ray images. We proposed a model that uses deep learning by developing a 3-stream CNN model. The CNN model extracts and concatenates the features obtained from the grayscale, LBP, and HOG images before using it for making a final decision.
The rest of the paper is organized as follows: Sect. 2 describes the database used and algorithms. Section 3 explains the methodology of the proposed system. Results and findings are listed and discussed in Sect. 4. Finally, the paper is concluded in Sect. 5.
Database and algorithms
Chest X-ray database
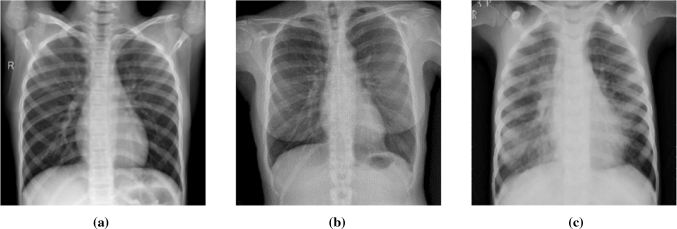
In this study, the COVID-19 radiography database v3 created by Chowdhury et al. [9] was used. The database was created using several sources [10–15]. There are a total of 3886 images in the COVID-19 Radiography dataset, including 1200 Covid-19 positive, 1341 normal, and 1345 viral pneumonia. Sample images from the database are given in Fig. 1.
Fig. 1.
Sample images from database. a Normal b COVID-19 c Pneumonia
Local binary pattern LBP
Local binary pattern (LBP) is a powerful feature extraction method for texture classification developed by Ojala et al. [16]. In the LBP method, we consider a 3 × 3 window with the pixel of interest being at the center. The intensity of the center pixel of the window is considered as the threshold. This threshold is then compared with the other eight neighboring pixels’ intensity values. Each of the neighboring pixels will obtain the value zero if its intensity is below the threshold and the value one if its intensity is higher than or equal to the threshold. The result will be a binary 8-bit code that can be converted to a decimal value. The starting point of the 8-bit code is not important but it is essential to be consistent for all pixels and all images. This decimal value (which is in the range 0–255) will replace the value of the corresponding center pixel. With the application of these steps on every single pixel of the image, the LBP image can be obtained as shown in Fig. 2.
Fig. 2.

Calculation of the LBP image
Histograms of oriented gradients HOG
The histograms of oriented gradients (HOG) is a gradient calculation-based feature descriptor that was first used by Dalal and Triggs in their study on human detection [17]. Accordingly, the gradient magnitude and direction of each central pixel in the determined neighborhood are calculated with the help of sliding windows on the image. First, the feature descriptor is obtained by taking the difference between horizontal and vertical pixels neighboring the central pixel (Fig. 3).
Fig. 3.
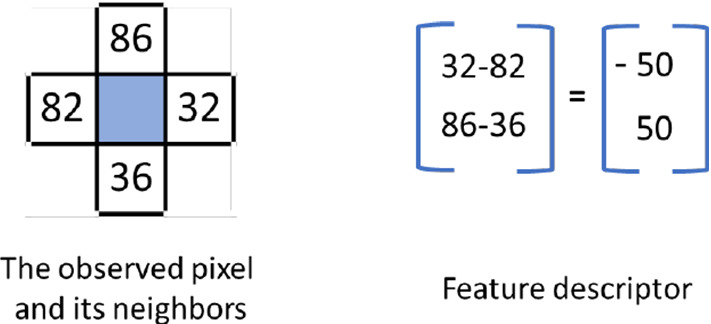
Calculation of feature descriptor, magnitude and direction of the gradient
Using this feature descriptor, the magnitude (Eq. 1) and direction (Eq. 2) values of each pixel of the image are calculated. For the visualization of HOG, bin histograms are created from line segments by using the magnitudes and directions in the specified neighborhood and angle range.
| 1 |
| 2 |
Methodology
Images in the dataset are first resized to 224 × 224 pixels. The local binary pattern (LBP) and histograms of oriented gradients (HOG) features are then calculated. Since the size of the virus-infected areas is relatively small compared to chest images, 3 × 3 window size is preferred. For this reason, eight neighboring pixels in LBP calculation, 3 × 3 neighboring pixels, and nine angle ranges in HOG calculation were assigned as parameter values. Sample images from the dataset and its obtained LBP, HOG images are shown in Fig. 4.
Fig. 4.
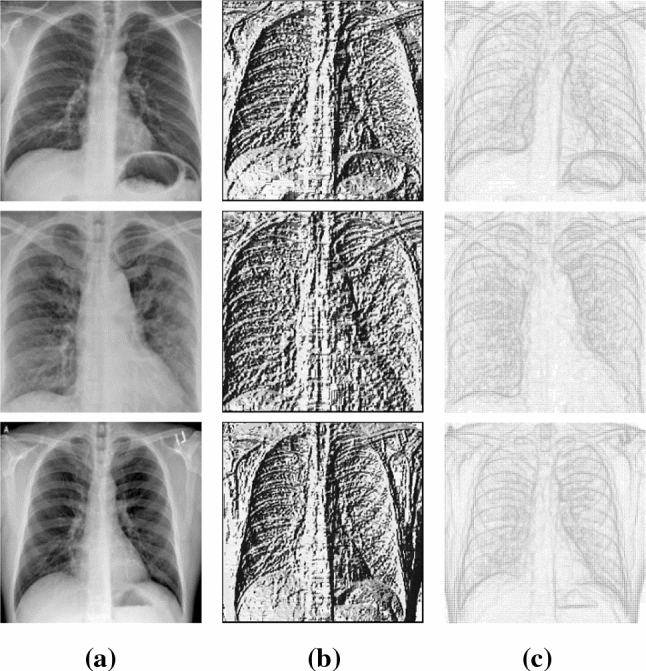
Images samples from dataset: a X-ray images b corresponding LBP images c corresponding HOG images
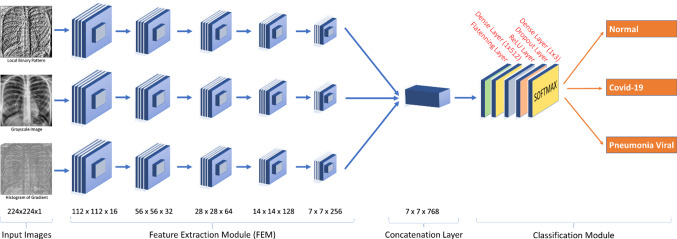
In this study, a multi-stream CNN with three inputs was designed. The three inputs are the grayscale X-ray image, the corresponding LBP, and HOG images. In the proposed network, each of the three input images passes in parallel through a Feature Extraction Module (FEM). The FEM consists of five feature extraction layers (see Fig. 5).
Fig. 5.
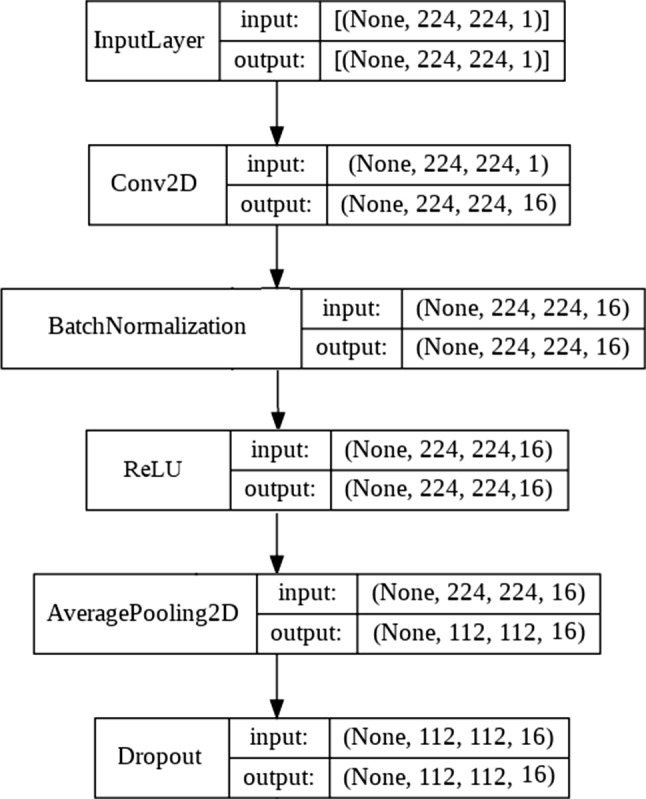
Feature Extraction Layer
Each of the FEM layers consists of a convolution layer with 3 × 3 filter size (has filter outputs of size 16, 32, 64, 128, and 256, respectively, in each of the five layers of FEM), a batch normalization layer (only at the first layer of FEM), a ReLU activation layer, an average pooling layer with 2 × 2 pool size and a dropout layer with 0.15 ratio (0.5 in the last layer of FEM). Features obtained from the three separate outputs (features) of the final FEM layers are combined as a single tensor at the concatenation layer.
The fused feature tensor passes to the classification module, which consists of the Flattening layer, the Dense layer of 512 neurons, the ReLU layer, the Dropout layer, and the Dense layer of 3 neurons. The classification result is obtained at the dense layer with the Softmax activation function. The proposed CNN architecture is shown in Fig. 6.
Fig. 6.
Architecture of the proposed 3-stream fusion-based CNN model
Results and discussion
All codes in this study were written in Python and ran in a Google Colaboratory environment. Tensorflow framework and Keras libraries were used to define the CNN model. In the proposed model, stochastic gradient descent was used as an optimization algorithm and categorical cross-entropy is used as a loss function. fivefold cross-validation was used to test model performance. This method divides the database into five equal subsets and each fold uses different subsets. In this study, three of these subsets were used for training, one for validation, and one for testing. Thus, all samples in the dataset are used for training, validation, and testing of the model (Fig. 7).
Fig. 7.
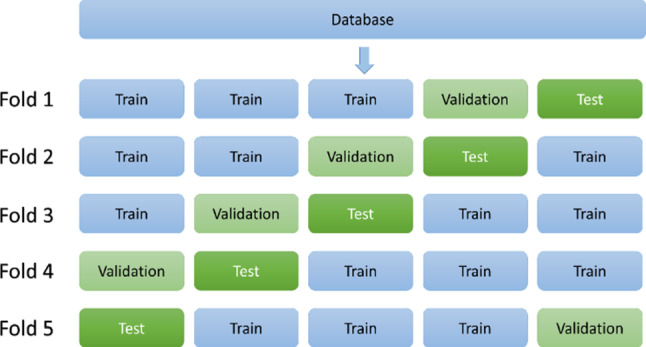
Splitting the database into five subsets with fivefold cross validation
The model was trained using 25 iterations and 16 batch-size. Figure 8 shows the accuracy and loss plot on model training for 5th fold.
Fig. 8.
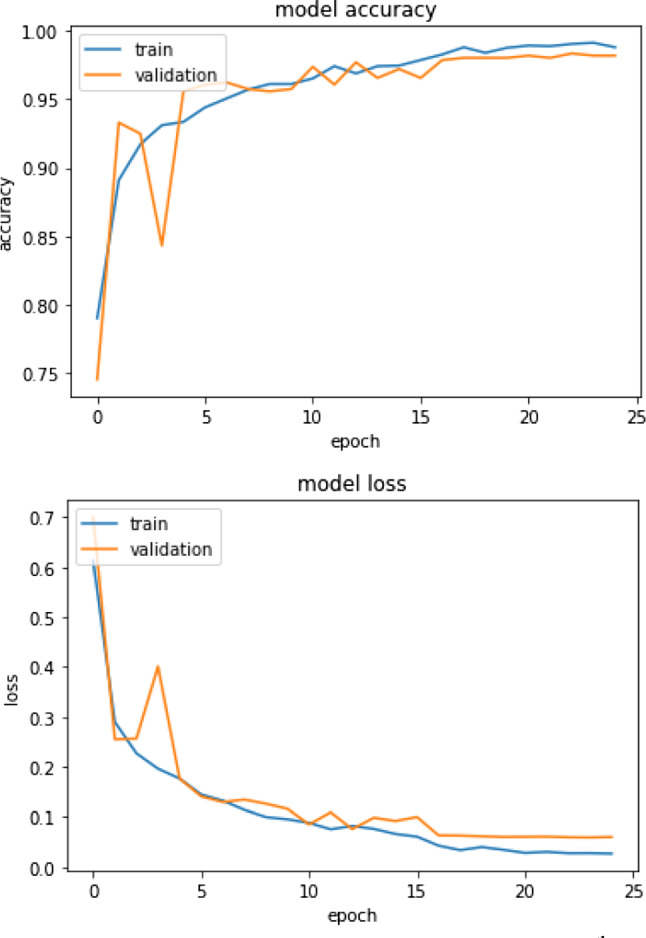
Accuracy and loss plots on model training for 5th fold
In each fold, the model is compiled and trained from scratch. As a result, five different confusion matrices are obtained from model testing results. Figure 9 shows the confusion matrices obtained by evaluating the model on each fold.
Fig. 9.
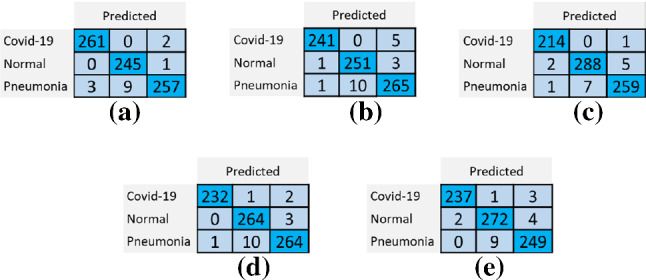
Confusion matrices for each fold: a 1st Fold b 2nd Fold c 3rd Fold d 4th Fold e 5th Fold
Using the results of these matrices, TP—true positives (positive samples correctly predicted to be in their corresponding class by the model), TN—true negatives (negative samples correctly predicted to be in their corresponding class), FP-false positives (negative samples incorrectly predicted to be in other classes), and FN-false negatives (positive samples incorrectly predicted to be in other classes) were calculated for each class. Afterward, the precision (Eq. 3), recall (Eq. 4), specificity (Eq. 5), F1 Score (Eq. 6), and accuracy (Eq. 7) of the proposed model were calculated.
| 3 |
| 4 |
| 5 |
| 6 |
| 7 |
In the fivefold cross-validation, the performance scores for each fold were calculated, and the average score was taken at the end. Model performance scores such as precision, recall, specificity, F1-score, and accuracy for each fold and the corresponding average scores are given in Table 1.
Table 1.
Fivefold cross-validation model performance scores
| Precision (%) | Recall (%) | Specificity (%) | F1-score (%) | Accuracy (%) | |
|---|---|---|---|---|---|
| 1st Fold | 98.10 | 98.07 | 99.06 | 98.07 | 98.07 |
| 2nd Fold | 97.44 | 97.43 | 98.68 | 97.43 | 97.43 |
| 3rd Fold | 97.94 | 97.94 | 98.90 | 97.94 | 97.94 |
| 4th Fold | 97.84 | 97.81 | 98.85 | 97.81 | 97.81 |
| 5th Fold | 97.56 | 97.55 | 98.72 | 97.56 | 97.55 |
| Average | 97.78 | 97.76 | 98.84 | 97.76 | 97.76 |
In Table 2, a comparison of the results obtained using the proposed algorithm against other most recent studies on the diagnosis of COVID-19 is given. All results in this table are conducted on public X-ray image databases with three classes. Wang et al. [18] developed a deep convolutional neural network called COVID-Net and achieved a 93.30% accuracy on a database of 13.975 X-ray images. Chandra et al. [19] extracted 8196 features using three different feature extractors and used a meta-heuristic binary grey wolf optimization approach for selecting the most informative features. They passed the selected features to a majority voting-based classifier ensemble of five benchmark supervised classification algorithms and managed to achieve 93.41% accuracy on three classes. On the other hand, Ibrahim et al. [20] used a pre-trained AlexNet model on publicly available multiclass X-ray images and achieved a 94% accuracy rate for three classes. Results in [21] show that they achieved a success rate of 94.2% with the developed 22-layer CNN model.
Table 2.
Comparison of studies with 3-class public datasets for COVID-19 detection
| Refs | Total/positive samples | Validation | Precision (%) | Recall (%) | Specificity (%) | F-Score (%) | Accuracy (%) |
|---|---|---|---|---|---|---|---|
| [6] | 458/295 | – | 98.89 | 98.33 | 99.69 | 98.57 | 99.27 |
| [7] | 196/105 | – | – | 97.91 | 91.87 | – | 95.12 |
| [8] | 1125/125 | Fivefold | 89.96 | 85.35 | 92.18 | 87.37 | 87.02 |
| [9] | 3487/423 | Fivefold | 96.61 | 96.61 | 98.31 | 96.61 | 97.74 |
| [18] | 13,975/358 | – | 93,56 | 93.33 | – | – | 93.30 |
| [19] | 2346/434 | – | – | – | – | – | 93.41 |
| [20] | 7431/371 | – | – | 91.30 | 84.78 | – | 94.00 |
| [21] | 2100/500 | Fivefold | 94.04 | 92.5 | 94.56 | 91.32 | 94.20 |
| [22] | 6252/412 | – | 96.52 | 94.33 | 97.17 | 95.41 | 94.35 |
| [23] | 1251/284 | Fourfold | 95.00 | 96.90 | 97.50 | 95.60 | 95.00 |
| [24] | 3550/864 | – | – | – | – | – | 96.00 |
| [25] | 3440/754 | – | – | 98.33 | 98.68 | – | 96.91 |
| [26] | 3124/438 | – | 98.55 | 95.45 | 97.76 | 96.90 | 97.59 |
| Proposed | 3886/1200 | Fivefold | 97.78 | 97.76 | 98.84 | 97.76 | 97.76 |
Another CNN model named CFW-Net based on the channel feature weighting was developed by Wang et al. [22] reached a 94.35% accuracy rate. Khan et al. [23] applied the transfer learning method with the Xception model on a small dataset containing 284 COVID-19 positive images. They achieved a 95% accuracy performance rate for three classes which is not a high performance considering the size of their database. Meanwhile, Asif et al. [24] trained the Inception V3-based deep CNN model using a public dataset containing 864 COVID-19 positive images and achieved a 96% success rate. Bayoudh et al. [25] developed a transfer learning-based hybrid 2D/3D CNN architecture and achieved a 96.91% accuracy rate. Pham [26] achieved the highest performance with the AlexNet model reaching 97.59% for three classes with 438 COVID-19 images. The study was performed using a fine-tuning method with three different pre-trained CNNs. It is clear that the proposed feature fusion-based model in this study outperformed the other models considering the size of the used database.
The performance of deep learning models is highly proportional to the size of the database. As the database size increases, the stability of the model is positively affected. In the early days of the pandemic, it was not possible to reach many publicly available images. Later on, with the spread of the pandemic in all countries and the increase in the number of infected people, more images began to be shared. Accordingly, this enabled researchers to train their models using thousands of COVID-19 positive raw images instead of hundreds. Taking this into consideration, some of the high results obtained at the early stages of the pandemic based on small-sized databases such as in [6, 7] cannot be reliable. The performance reported on such databases should be evaluated on larger databases. Otherwise, the findings of these studies cannot be generalized.
A comparison of the proposed 3-stream fusion-based CNN model against 1-stream CNN models is presented in Table 3. 1-stream CNN model uses only one of the 3 images (grayscale, LBP or HOG image) as input to the model. The training of the fusion-based model and average prediction is taking relatively longer time than the 1-stream CNN models. Time consumption for training the model should not be an issue due to the fact that the process is one-time off-line process. One the other hand, the proposed 3-stream fusion-based model recorded better loss rate and accuracy.
Table 3.
Comparison between the proposed 3-stream fusion-based CNN model and the corresponding 1-stream versions
| 3-Stream network | 1-Stream networks | |||
|---|---|---|---|---|
| grayscale | LBP | HOG | ||
| Training time (min) | 3.55 | 1.56 | 1.52 | 1.80 |
| Prediction time (sec/image) | 0.0029 | 0.0011 | 0.0011 | 0.0011 |
| Loss rate | 0.07 | 0.11 | 0.11 | 0.12 |
| Accuracy rate | 97.76 | 95.80 | 95.67 | 95.31 |
Conclusions
In this paper, we proposed a deep learning-based diagnosis of COVID-19 on possibly infected patients using chest X-ray images. Besides the availability of X-ray imaging in most healthcare units, the other test techniques were expensive and gave late, and sometimes inconclusive, results. The proposed approach designed a 3-stream convolutional neural network (CNN) that extracts and concatenates features obtained from grayscale X-ray, LBP, and HOG images. The fivefold cross-validation experiments carried out on a large chest X-ray database with three classes showed that our proposed approach outperformed the recently developed algorithms with accuracy reached 97.76%. High results, from other studies, obtained using small databases were listed in Table 2 but were not taking into consideration. This is because such results using small databases cannot be reliable and cannot be generalized. Our results showed that the proposed model can make a significant contribution to the rapidly increasing workload in health systems with a deep learning-based automatic diagnosis tool. Moreover, having a standard benchmark database that can be used by researchers to evaluate and compare their work against others will be of great value. It will make it easier to evaluate proposed algorithms objectively without any biasing. Also, larger databases will help to obtain reliable and trustworthy results and findings.
Declaration
Conflict of interest
The authors declare that they have no known competing financial interests or personal relationships that could have appeared to influence the work reported in this paper.
Footnotes
Publisher's Note
Springer Nature remains neutral with regard to jurisdictional claims in published maps and institutional affiliations.
Contributor Information
Fatih Bayram, Email: fatihbayram@aku.edu.tr.
Alaa Eleyan, Email: alaa.eleyan@aum.edu.kw.
References
- 1.Wehbe RM, Sheng J, Dutta S, Chai S, Dravid A, Barutcu S, Wu Y, Cantrell DR, Xiao N, Allen BD, MacNealy GA, Savas H, Agrawal R, Parekh N, Katsaggelos AK. DeepCOVID-XR: an artificial intelligence algorithm to detect COVID-19 on chest radiographs trained and tested on a large US clinical dataset. Radiology. 2020 doi: 10.1148/radiol.2020203511. [DOI] [PMC free article] [PubMed] [Google Scholar]
- 2.Al-Waisy AS, Al-Fahdawi S, Abed Mohammed M, Hameed Abdulkareem K, Mostafa SA, Maashi MS, Arif M, Garcia-Zapirain B. (2020) COVID-CheXNet: hybrid deep learning framework for identifying COVID-19 virus in chest X-rays images. Soft Comput. 2020 doi: 10.1007/s00500-020-05424-3. [DOI] [PMC free article] [PubMed] [Google Scholar] [Retracted]
- 3.Saha P, Sadi MS, Islam MM. EMCNet: automated COVID-19 diagnosis from X-ray images using convolutional neural network and ensemble of machine learning classifiers. Informatics Med. Unlocked. 2021;22:100505. doi: 10.1016/j.imu.2020.100505. [DOI] [PMC free article] [PubMed] [Google Scholar]
- 4.Ismael AM, Şengür A. Deep learning approaches for COVID-19 detection based on chest X-ray images. Expert Syst. Appl. 2021;164:114054. doi: 10.1016/j.eswa.2020.114054. [DOI] [PMC free article] [PubMed] [Google Scholar]
- 5.Alam N-A-A, Ahsan M, Based MdA, Haider J, Kowalski M. COVID-19 detection from chest X-ray images using feature fusion and deep learning. Sensors. 2021;21:1480. doi: 10.3390/s21041480. [DOI] [PMC free article] [PubMed] [Google Scholar]
- 6.Toğaçar M, Ergen B, Cömert Z. COVID-19 detection using deep learning models to exploit social mimic optimization and structured chest X-ray images using fuzzy color and stacking approaches. Comput. Biol. Med. 2020;121:103805. doi: 10.1016/j.compbiomed.2020.103805. [DOI] [PMC free article] [PubMed] [Google Scholar]
- 7.Abbas A, Abdelsamea MM, Gaber MM. Classification of COVID-19 in chest X-ray images using DeTraC deep convolutional neural network. Appl Intell. 2021;51:854–864. doi: 10.1007/s10489-020-01829-7. [DOI] [PMC free article] [PubMed] [Google Scholar]
- 8.Ozturk T, Talo M, Yildirim EA, Baloglu UB, Yildirim O, Rajendra Acharya U. Automated detection of COVID-19 cases using deep neural networks with X-ray images. Comput. Biol. Med. 2020;121:103792. doi: 10.1016/j.compbiomed.2020.103792. [DOI] [PMC free article] [PubMed] [Google Scholar]
- 9.Chowdhury MEH, Rahman T, Khandakar A, Mazhar R, Kadir MA, Mahbub ZB, Islam KR, Khan MS, Iqbal A, Emadi NA, Reaz MBI, Islam MT. Can AI help in screening viral and COVID-19 pneumonia? IEEE Access. 2020;8:132665–132676. doi: 10.1109/ACCESS.2020.3010287. [DOI] [Google Scholar]
- 10.Italian Society of Medical and Interventional Radiology (SIRM) COVID-19 Database. https://www.sirm.org/category/senza-categoria/covid-19. Accessed 19 Feb 2021
- 11.Cohen, J.P., Morrison, P., Dao, L., Roth, K., Duong, T.Q., Ghassemi, M.: COVID-19 ımage data collection: prospective predictions are the future. Preprint arXiv: 2006.11988v3 (2020)
- 12.Haghanifar, A., Majdabadi, M.M., Choi, Y., Deivalakshmi, S., Ko, S.: COVID-CXNet: detecting COVID-19 in frontal chest X-ray ımages using deep learning. Preprint arXiv: 2006.13807v2 (2020) [DOI] [PMC free article] [PubMed]
- 13.Winther, H.B., Laser, H., Gerbel, S., Maschke, S.K., Hinrichs, J.B., Vogel-Claussen, J., Wacker, F.K., Höper, M.M., Meyer, B.C. COVID-19 Image Repository. https://figshare.com/articles/dataset/COVID-19_Image_Repository/12275009. Accessed 19 Feb 2021
- 14.European Society of Radiology (ESR), https://eurorad.org. Accessed 19 Feb 2021
- 15.Kermany, D., Goldbaum, M.: Labeled optical coherence tomography (OCT) and chest X-ray images for classification. Mendeley Data 2 (2018), https://data.mendeley.com/datasets/rscbjbr9sj/2. Accessed 19 Feb 2021
- 16.Ojala T, Pietikäinen M, Harwood D. A comparative study of texture measures with classification based on featured distributions. Pattern Recognit. 1996;29:51–59. doi: 10.1016/0031-3203(95)00067-4. [DOI] [Google Scholar]
- 17.Dalal, N., Triggs, B.: Histograms of oriented gradients for human detection. In: 2005 IEEE Computer Society Conference on Computer Vision and Pattern Recognition (CVPR’05). pp. 886–893. IEEE (2005)
- 18.Wang L, Lin ZQ, Wong A. COVID-Net: a tailored deep convolutional neural network design for detection of COVID-19 cases from chest X-ray images. Sci. Rep. 2020;10:19549. doi: 10.1038/s41598-020-76550-z. [DOI] [PMC free article] [PubMed] [Google Scholar]
- 19.Chandra TB, Verma K, Singh BK, Jain D, Netam SS. Coronavirus disease (COVID-19) detection in Chest X-ray images using majority voting based classifier ensemble. Expert Syst. Appl. 2021;165:113909. doi: 10.1016/j.eswa.2020.113909. [DOI] [PMC free article] [PubMed] [Google Scholar]
- 20.Umar Ibrahim A, Ozsoz M, Serte S, Al-Turjman F, Shizawaliyi Yakoi P. Pneumonia classification using deep learning from chest X-ray ımages during COVID-19. Cogn Comput. 2021 doi: 10.1007/s12559-020-09787-5. [DOI] [PMC free article] [PubMed] [Google Scholar]
- 21.Hussain E, Hasan M, Rahman MA, Lee I, Tamanna T, Parvez MZ. CoroDet: a deep learning based classification for COVID-19 detection using chest X-ray images. Chaos Solitons Fractals. 2021;142:110495. doi: 10.1016/j.chaos.2020.110495. [DOI] [PMC free article] [PubMed] [Google Scholar]
- 22.Wang W, Liu H, Li J, Nie H, Wang X. Using CFW-Net deep learning models for X-ray images to detect COVID-19 patients. Int. J. Comput. Intell. Syst. 2020 doi: 10.2991/ijcis.d.201123.001. [DOI] [Google Scholar]
- 23.Khan AI, Shah JL, Bhat MM. CoroNet: a deep neural network for detection and diagnosis of COVID-19 from chest X-ray images. Comput. Methods Prog. Biomed. 2020;196:105581. doi: 10.1016/j.cmpb.2020.105581. [DOI] [PMC free article] [PubMed] [Google Scholar]
- 24.Asif, S., Wenhui, Y., Jin, H., Tao, Y., Jinhai, S.: Classification of COVID-19 from chest X-ray images using deep convolutional neural networks. (2020). 10.1101/2020.05.01.20088211
- 25.Bayoudh K, Hamdaoui F, Mtibaa A. Hybrid-COVID: a novel hybrid 2D/3D CNN based on cross-domain adaptation approach for COVID-19 screening from chest X-ray images. Phys. Eng. Sci. Med. 2020;43:1415–1431. doi: 10.1007/s13246-020-00957-1. [DOI] [PMC free article] [PubMed] [Google Scholar]
- 26.Pham TD. Classification of COVID-19 chest X-rays with deep learning: new models or fine tuning? Heal. Inf. Sci. Syst. 2021;9:2. doi: 10.1007/s13755-020-00135-3. [DOI] [PMC free article] [PubMed] [Google Scholar]


