

Abstract
Objectives:
This study was designed to evaluate the thickness of the central macula, the retinal nerve fiber layer (RNFL), and the ganglion cell complex (GCC) in individuals with congenital red-green color vision deficiency (CVD) using spectral-domain optical coherence tomography (SD-OCT).
Methods:
This study included 22 males with a red-green CVD (Group 1) and 22 males with normal color vision (Group 2). The Ishihara test was used to determine CVD. SD-OCT was used to evaluate the central macula, RNFL, and GCC measurements of all of the study participants. The quantitative data of the 2 groups were compared. The Kruskal-Wallis test was used for the statistical analysis and a p value <0.05 was considered significant.
Results:
The mean central macula thickness observed in Group 1 and 2 was 255.00±25.50 µm and 248.95±24.70 µm, respectively. The mean RNFL thickness of Group 1 and 2 was 110.66±14.70 µm and 109.49±9.90 µm, respectively, and the mean GCC thickness of Group 1 and 2 was 97.70±10.80 µm and 97.56±5.10 µm, respectively. There were no significant differences between the groups in the assessment of the central macula, RNFL, or GCC thickness (p=0.20, p=0.34, p=0.37).
Conclusion:
The results of this study suggested that congenital red-green CVD does not affect the thickness of the central macula, RNFL, or GCC. To the best of our knowledge, this is the first study to evaluate the thickness of the GCC in individuals with congenital red-green CVD.
Keywords: Color, ganglion, nerve, red-green, thickness
Introduction
Color vision deficiency (CVD) is defined as the inability to distinguish color differences (1). A maldevelopment in 1 or more cone cells in the retina causes congenital CVD (2). The human retina has 3 types of photoreceptors: short-, medium-, and long wavelength-sensitive cones, which constitute normal human color vision (3). CVD usually occurs due to the absence of 1 or more retinal cone photopigments, resulting in total or partial loss of sensitive function (4). A partial loss of cone function is described as anomalous trichromacy, and a total loss is classified as dichromacy (5). The most frequent types of CVD are inherited from mutations on the X chromosome, and are associated with the inadequacy to distinguish between the red and green wavelengths (6). In Caucasian societies, approximately 8% of males and 0.4% of females are affected by CVD (7).
Optical coherence tomography (OCT) has been used as an imaging device since 1991. OCT is a noninvasive, noncontact diagnostic device that has the capability to perform high-resolution, cross-sectional imaging of the human eye in vivo (8). OCT provides reproducible quantitative and objective measurements of the thicknesses of retinal layers (9).
There are very few studies in the literature that have evaluated retinal structures in individuals with congenital red-green CVD. Gupta et al. (10) evaluated the anatomic structure of the retina using spectral-domain optical coherence tomography (SD-OCT) in individuals with congenital red-green CVD and they reported normal thickness in various retinal layers in the macula in individuals with congenital red-green CVD compared with normal subjects. Yılmazbas et al. (11) used scanning laser polarimetry and observed a normal thickness of the retinal nerve fiber layer (RNFL) in subjects with congenital red-green CVD. The present research was an evaluation of some of the retinal layers associated with color perception using SD-OCT in patients with congenital red-green CVD. Congenital red-green CVD results from the absence, malfunction, or alteration of either the L-cone photopigment or the M-cone photopigment (10, 12). Cones are known to be concentrated in the foveal area corresponding to the central macula (13). Ganglion cells receive signals conveyed by bipolar cells that have received inputs from cones. The axons of ganglion cells travel in the nerve fiber layer and enter the optic nerve (14). This study was designed to investigate whether red-green CVD has any effect on the thickness of some retinal layers that have a dense concentration of cone cells, ganglion cells, or ganglion cell axons, and analyze the thickness of the central macula, the RNFL, and the ganglion cell complex (GCC) using SD-OCT in individuals with congenital red-green CVD.
Methods
The study participants were 22 healthy males with congenital red-green CVD and 22 healthy males with normal color vision. Group 1 consisted of individuals who had congenital red-green CVD, and Group 2 included individuals who had normal color vision. Before the study, informed consent was obtained from all the participating individuals, and ethics approval was also obtained [no:11 (11)]. The guidelines of the Declaration of Helsinki were observed at each stage of the study. A full ocular examination was performed, including cycloplegic refraction, visual acuity assessment using the Snellen chart, intraocular pressure measurement using applanation tonometry, and axial length measurement using A-scan ultrasonography. Anterior and posterior segment evaluations were performed for each member of the study group.
Individuals with neurologic disorders; any eye disease, such as retinal disease, glaucoma, optic neuritis, uveitis; or any systemic disease such as diabetes or hypertension that could influence the thickness of retinal structures, were excluded from the study. All of the study participants had a spherical or cylindrical refraction error of <1 diopter and an axial length measurement value of 22.5-24.5 mm.
The 24-plate Ishihara test was used to determine individuals with red-green CVD. In practice, the Ishihara pseudoisochromatic plates are the most commonly used means to detect congenital red-green CVD (15–18). The Ishihara test has a long clinical history and high sensitivity and specificity (19,20). Some studies have reported that this test is the most effective method to ascertain red-green CVD (21,22). In this study, the test plates were displayed to the individuals at a distance of 75 cm in an appropriately illuminated room. All of the participants were asked to read the numbers seen on the test plates. Three or more errors served to classify the presence of CVD.
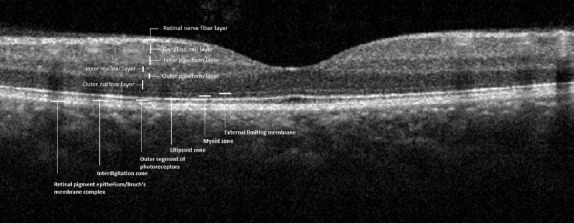
There has been progressive growth in the use of SD-OCT in ophthalmology. The RTVue-100 OCT scanner (Optovue Inc., Fremont, CA, USA) was used to measure the thickness of the central macula, RNFL, and GCC in both study groups. The RTVue-100 can perform 26,000 A scans per second with a depth resolution of 5 µm (23). The central macular and RNFL thickness measurements were performed using the 5-mm macular map and an optic nerve head scan, respectively. The GCC comprises the RNFL, the inner plexiform layer and the retinal ganglion cell layer (24), and a GCC scan was used to measure the thickness of this composite layer. A single clinician performed the evaluation and image capture for the study group after pupillary dilation with tropicamide drops. Scans with a signal strength index of <45 or motion artifacts were excluded. An OCT image obtained from the retina of an individual with red-green CVD is shown in Figure 1, and an OCT image obtained from the retina of a control subject is shown in Figure 2. The thicknesses of the central macula, RNFL, and GCC were calculated and used for statistical analysis. Quantitative data obtained from these measurements were compared between Group 1 and Group 2.
Figure 1.

Grey-scale optical coherence tomography image revealing the retinal layers of an individual with red-green color vision deficiency.
Figure 2.
Grey-scale optical coherence tomography image revealing the retinal layers of a control subject.
Statistical Analysis
The statistical analysis was performed with IBM SPSS Statistics for Windows, Version 22.0 software (IBM Corp., Armonk, NY, USA). The measurable data were presented as mean±SD and the non-parametric Kruskal-Wallis test was used to compare the data of the 2 groups. A p value of <0.05 was considered statistically significant.
Results
The mean age of Group 1 was 30.14±8.90 years, and the mean age of Group 2 was 25.55±6.00 years. The mean central macular thickness in Groups 1 and 2 was 255.00±25.50 µm and 248.95±24.70 µm, respectively. The mean RNFL thickness was 110.66±14.70 µm and 109.49±9.90 µm, respectively, in Groups 1 and 2. The mean GCC thickness in Group 1 and Group 2 was 97.70±10.80 µm and 97.56±5.10 µm, respectively (Table 1).
Table 1.
Mean thickness of the central macula, RNFL, and GCC in the study groups
| Group 1 (n=22) (Mean±SD) | Group 2 (n=22) (Mean±SD) | p | |
|---|---|---|---|
| Central macular thickness (µm) | 255.00±25.50 | 248.95±24.70 | 0.20 |
| RNFL thickness (µm) | 110.66±14.70 | 109.49±9.90 | 0.34 |
| GCC thickness (µm) | 97.70±10.80 | 97.56±5.10 | 0.37 |
Group 1: Individuals with congenital red-green color vision deficiency, Group 2: Individuals with normal color vision; GCC: Ganglion cell complex; RNFL: Retinal nerve fiber layer.
There were no significant differences in the mean age, central macular thickness, RNFL thickness, or GCC thickness measurements between the groups (p=0.10, p=0.20, p=0.34, p=0.37, respectively).
Discussion
In this study, SD-OCT was used to evaluate the thickness of the central macula, RNFL, and GCC in individuals with congenital red-green CVD. A comparison was performed with normal color vision subjects, and we found no significant difference between the study group and the control group. A literature review revealed no previous study evaluating the thickness of the GCC layer in individuals with red-green CVD using SD-OCT.
Gupta et al. (10) used SD-OCT to measure the thickness of several layers of the retina: the foveal neurosensory retina, the outer nuclear layer, the photoreceptor layer, and the outer and inner segments of the photoreceptors in 14 eyes of 7 individuals with congenital red-green CVD and compared the outcomes with normal subjects. They reported a normal thickness in the various retinal layers in the macula in persons with congenital red-green CVD. Although they examined different retinal layers, their results are consistent with our findings. Their study is also similar to ours in terms of the instrument used.
Yılmazbas et al. (11) studied RNFL thickness using scanning laser polarimetry in 20 individuals who had congenital red-green CVD. They compared the results with those of 20 control subjects who had normal color vision, and they found no significant difference between the 2 groups. Their outcome on the thickness of RNFL layer corroborated our result in the same layer though they used a different instrument.
Barthelmes et al. (25) analyzed the OCT characteristics of the central retina in patients with 2 diseases associated with a lack of cone functions, achromatopsia and blue-cone monochromatism, and compared the findings with normal subject data. They detected a decreased foveal thickness in patients with blue-cone monochromatism compared with those with achromatopsia and normal subjects. The clinical characteristics of blue-cone monochromatism differ from congenital red-green CVD, though both conditions have a similar genetic basis. Additional studies are needed to explain the reduced foveal thickness.
Varsayni et al. (26) evaluated the anatomic structure of the retina in patients with achromatopsia using OCT and reported a reduction in both the thickness of the central retina and total macular volume in patients with achromatopsia compared with control subjects. Although patients with achromatopsia had a lack of color vision, this inherited condition differs from congenital red-green CVD both in terms of the clinical characteristics and molecular genetic basis. The difference in the thickness of central retina may be due to the study design.
Our study has some limitations. First, our study group was small. Second, the study had no data from female patients with red-green CVD. Third, the study lacked the ability to demonstrate the probable changes in macular morphology over time. A prospective study with a longer follow-up would be useful to observe morphological changes. Finally, we did not evaluate the ellipsoid zone, which contains photoreceptor mitochondria needed for high metabolism.
In conclusion, the results of this study suggest that there is no morphological change in the macular anatomy in red-green CVD detectable with SD-OCT. However, histopathological and prospective studies with a larger study group are necessary.
This manuscript was presented at the 51st National Congress of the Turkish Ophthalmological Association held in Antalya, Turkey, October 24-29, 2017.
Footnotes
Disclosures
Ethics Committee Approval: Firat University, 11(11), 27/06/2019.
Peer-review: Externally peer-reviewed.
Conflict of Interest: None declared.
Authorship Contributions: Involved in design and conduct of the study (EO, FC, NC); preparation and review of the study (EO, NC); data collection (EO, FC, NC, EY); and statistical analysis (EO, NC, DC).
References
- 1.Chippa SA, Hashmi FK, Ali S, Kamal M, Ahmad K. Frequency of color blindness in pre-employment screening in a tertiary health care center in Pakistan. Pak J Med Sci. 2017;33:430–2. doi: 10.12669/pjms.332.11710. [DOI] [PMC free article] [PubMed] [Google Scholar]
- 2.Shah A, Hussain R, Fareed M, Afzal M. Prevalence of Red-Green Colour Vision Defects among Muslim Males and Females of Manipur, India. Iran J Public Health. 2013;42:16–24. [PMC free article] [PubMed] [Google Scholar]
- 3.Melillo P, Riccio D, Di Perna L, Sanniti Di Baja G, De Nino M, Rossi S, et al. Wearable Improved Vision System for Color Vision Deficiency Correction. IEEE J Transl Eng Health Med. 2017;5:3800107. doi: 10.1109/JTEHM.2017.2679746. [DOI] [PMC free article] [PubMed] [Google Scholar]
- 4.Neitz J, Neitz M. The genetics of normal and defective color vision. Vision Res. 2011;51:633–51. doi: 10.1016/j.visres.2010.12.002. [DOI] [PMC free article] [PubMed] [Google Scholar]
- 5.Merbs SL, Nathans J. Absorption spectra of the hybrid pigments responsible for anomalous color vision. Science. 1992;258:464–6. doi: 10.1126/science.1411542. [DOI] [PubMed] [Google Scholar]
- 6.Ramachandran N, Wilson GA, Wilson N. Is screening for congenital colour vision deficiency in school students worthwhile?A review. Clin Exp Optom. 2014;97:499–506. doi: 10.1111/cxo.12187. [DOI] [PubMed] [Google Scholar]
- 7.Spalding JA. Colour vision deficiency in the medical profession. Br J Gen Pract. 1999;49:469–75. [PMC free article] [PubMed] [Google Scholar]
- 8.Huang D, Swanson EA, Lin CP, et al. Optical coherence tomography. Science. 1991;254:1178–81. doi: 10.1126/science.1957169. [DOI] [PMC free article] [PubMed] [Google Scholar]
- 9.Zhou M, Lu B, Zhao J, Wang Q, Zhang P, Sun X. Interocular Symmetry of Macular Ganglion Cell Complex Thickness in Young Chinese Subjects. PLoS One. 2016;11:e0159583. doi: 10.1371/journal.pone.0159583. [DOI] [PMC free article] [PubMed] [Google Scholar]
- 10.Gupta A, Laxmi G, Nittala MG, Raman R. Structural and functional correlates in color vision deficiency. Eye (Lond) 2011;25:909–17. doi: 10.1038/eye.2011.87. [DOI] [PMC free article] [PubMed] [Google Scholar]
- 11.Yılmazbas TP, Onaran Z, Ornek K, Gullu R. Retinal nerve fiber layer thickness in congenital color vision deficiency. Eur J Ophthalmol. 2008;18:845–7. doi: 10.1177/112067210801800534. [DOI] [PubMed] [Google Scholar]
- 12.Melamud A, Hagstrom S, Traboulsi E. Color Vision Testing. Ophthalmic Genet. 2004;25:159–87. doi: 10.1080/13816810490498341. [DOI] [PubMed] [Google Scholar]
- 13.Kolb H. Anatomical Pathways for Color Vision in the Human Retina. Vis Neurosci. 1991;7:6–74. doi: 10.1017/s0952523800010944. [DOI] [PubMed] [Google Scholar]
- 14.Prasad S, Galetta SL. Anatomy and Physiology of the Afferent Visual System. Handb Clin Neurol. 2011;102:3–19. doi: 10.1016/B978-0-444-52903-9.00007-8. [DOI] [PubMed] [Google Scholar]
- 15.Cole BL. Assessment of inherited colour vision defects in clinical practice. Clin Exp Optom. 2007;90:157–75. doi: 10.1111/j.1444-0938.2007.00135.x. [DOI] [PubMed] [Google Scholar]
- 16.Strawhacker MT, Gustafson JK, Kinne MJ, Little D. Vision screening practices in central Iowa:a follow-up evaluation. J Sch Nurs. 2003;19:111–8. doi: 10.1177/10598405030190020801. [DOI] [PubMed] [Google Scholar]
- 17.Cumberland P, Rahi JS, Peckham CS. Impact of congenital colour vision defects on occupation. Arch Dis Child. 2005;90:906–8. doi: 10.1136/adc.2004.062067. [DOI] [PMC free article] [PubMed] [Google Scholar]
- 18.Dain SJ. Clinical colour vision tests. Clin Exp Optom. 2004;87:276–93. doi: 10.1111/j.1444-0938.2004.tb05057.x. [DOI] [PubMed] [Google Scholar]
- 19.Birch J. Efficiency of the Ishihara test for identifying red-green colour deficiency. Ophthalmic Physiol Opt. 1997;17:403–8. [PubMed] [Google Scholar]
- 20.Mercer ME, Drodge SC, Courage ML, Adams RJ. A pseudoisochromatic test of color vision for human infants. Vision Res. 2014;100:72–7. doi: 10.1016/j.visres.2014.04.006. [DOI] [PubMed] [Google Scholar]
- 21.Gündogan NU, Durmazlar N, Gümüş K, Ozdemir PG, Altintaş AG, Durur I, et al. Projected color slides as a method for mass screening test for color vision deficiency (a preliminary study) Int J Neurosci. 2005;115:1105–17. doi: 10.1080/00207450590914365. [DOI] [PubMed] [Google Scholar]
- 22.Birch J. Identification of red-green colour deficiency:sensitivity of the Ishihara and American Optical Company (Hard, Rand and Rittler) pseudo-isochromatic plates to identify slight anomalous trichromatism. Ophthalmic Physiol Opt. 2010;30:667–71. doi: 10.1111/j.1475-1313.2010.00770.x. [DOI] [PubMed] [Google Scholar]
- 23.Sull AC, Vuong LN, Price LL, Srinivasan VJ, Gorczynska I, Fujimoto JG, et al. Comparison of spectral/Fourier domain optical coherence tomography instruments for assessment of normal macular thickness. Retina. 2010;30:235–45. doi: 10.1097/IAE.0b013e3181bd2c3b. [DOI] [PMC free article] [PubMed] [Google Scholar]
- 24.Rolle T, Dallorto L, Briamonte C, Penna RR. Retinal nerve fibre layer and macular thickness analysis with Fourier domain optical coherence tomography in subjects with a positive family history for primary open angle glaucoma. Br J Ophthalmol. 2014;98:1240–4. doi: 10.1136/bjophthalmol-2013-304519. [DOI] [PubMed] [Google Scholar]
- 25.Barthelmes D, Sutter FK, Kurz-Levin MM, Bosch MM, Helbig H, Niemeyer G, et al. Quantitative analysis of OCT characteristics in patients with achromatopsia and blue-cone monochromatism. Invest Ophthalmol Vis Sci. 2006;47:1161–6. doi: 10.1167/iovs.05-0783. [DOI] [PubMed] [Google Scholar]
- 26.Varsanyi B, Somfai GM, Lesch B, Vamos R, Farkas A. Optical coherence tomography of the macula in congenital achromatopsia. Invest Ophthalmol Vis Sci. 2007;48:2249–53. doi: 10.1167/iovs.06-1173. [DOI] [PubMed] [Google Scholar]