

Abstract
Antigen-antibody epitope mapping is essential for understanding binding mechanisms and developing new protein therapeutics. In this study, we investigate diethylpyrocarbonate (DEPC) covalent labeling (CL) mass spectrometry (MS) as a means of analyzing antigen-antibody interactions, using the well-characterized model system of TNFα in complex with three different antibodies. Results show that residues buried in the epitope undergo substantial decreases in labeling, as expected. Interestingly, serine, threonine, and tyrosine residues at the edges of the epitope undergo unexpected increases in labeling. The increased labeling of these weakly nucleophilic residues is caused by the formation of hydrophobic pockets upon antibody binding that presumably increase local DEPC concentrations. Residues that are distant from the epitope generally do not undergo changes in labeling extent; however, some that do change experience variations in their local microenvironment due to side chain reorganization or stabilization of the TNFα trimer that occurs upon binding. Overall, DEPC labeling of antigen-antibody complexes is found to depend on both changes in solvent exposure and changes to residue microenvironment.
Keywords: Antibody therapeutics, epitope mapping, covalent labeling, diethylpyrocarbonate, mass spectrometry, tumor necrosis factor α
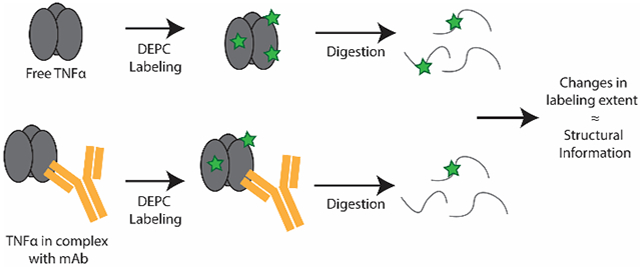
Graphical Abstract
Introduction
Monoclonal antibody (mAb) based therapeutics are successful because of the high specificity and affinity between an antibody and its antigen. Epitope mapping, which involves identifying the antigen residues that are recognized by the mAb, is vital for understanding binding mechanisms and helping design future therapeutics.1 Identifying the bound residues in the antigen and the features of the antigen’s higher order structure (HOS) that are necessary for specific binding are essential not only for understanding the mechanism of binding but also can be useful for intellectual property protection.
Mass spectrometry (MS) has emerged as a promising tool for epitope mapping because of limitations in traditional tools, especially when studying intact antibody-antigen complexes. X-ray crystallography, nuclear magnetic resonance (NMR), and cryogenic electron microscopy (cryoEM) have been used to study protein-protein interactions due to their atomic-level resolution. However, X-ray crystallography is limited to proteins that can crystallize, requires lots of sample, and can be time-consuming. NMR on high molecular weight protein complexes can be challenging, limiting its applicability for the routine analysis of mAb-antigen complexes. CryoEM is an emerging technique that has great promise but requires high levels of user expertise and sample amounts and does not always provide sufficient resolution to definitively identify binding sites. MS, on the other hand, requires low sample amounts, does not seem to be limited by molecular weight, and offers higher throughput analysis than either NMR or X-ray crystallography.
Various MS tools have been developed for antigen-antibody interactions, such as epitope excision and epitope extraction, hydrogen deuterium exchange (HDX) MS, and covalent labeling (CL) MS.2-7 Epitope excision and extraction methods have been the most frequently used methods for MS-based epitope exploration. In these methods, proteolytic digestion of the antigen is carried out either before (epitope extraction) or after (epitope excision) complexation with an antibody. In epitope extraction methods, specific recognition peptide(s) are created by proteolytic digestion and are then isolated by immunoaffinity methods and detected by MS.4,8 Epitope excision relies on digestion in the presence of the bound antibody, which prevents proteolysis on the parts of the antigen that are buried in the binding pocket, thereby allowing conformational epitopes to be identified when combined with MS.4 However, epitope excision and extraction techniques are limited in their resolution, usually providing only peptide-level information.
More recently, HDX/MS has been used to study antibody-antigen interactions, as it can provide more precise mapping of the contact sites.3,9-11 In HDX, proteins are incubated in D2O, which results in exchange of hydrogens on heteroatoms for deuterium in solution. Proteolytic digestion at low pH, followed by LC/MS allows the exchange of backbone amide hydrogens to be detected. The different rates at which deuterium labels the backbone can be used to analyze solvent accessibility and HOS. Epitope regions can often be identified by the comparing exchange patterns on the antigen alone vs. the antigen in complex with its antibody.5,12 However, HDX/MS does have some limitations. Protein digestion and peptide separation can lead to label loss due to back exchange, lowering the sensitivity of the method. In addition, changes in protein dynamics at sites distant from the epitope can also result in reduced HDX, and this decreased exchange can be difficult to distinguish from reduced exchange at the epitope. While HDX/MS is higher throughput than NMR, CryoEM, and X-ray crystallography, data analysis is time intensive and specialized robotic equipment is often needed to facilitate the experiments.
CL/MS has emerged as a promising complementary technique because of some advantages over other MS-based approaches. CL/MS can provide residue level resolution and is relatively high throughput. CL/MS methods typically do not suffer from label loss like HDX-MS, and depending on the reagent, sample preparation is simple with no specialized equipment needed. A number of CL/MS techniques, such as fast photochemical oxidation of proteins (FPOP),13 carboxyl group footprinting,14 lysine acetylation,15,16 and diethylpyrocarbonate (DEPC) labeling17-20 have been used to study antibodies. For example, FPOP has been used alone or with HDX/MS to characterize epitopes and even paratopes in protein therapeutics.9,13,21 Carboxyl group footprinting with glycine ethyl ester (GEE) has been used to determine the residues involved in the interface between vascular endothelial growth factor and its binding mAbs.22 One of the earliest examples of CL/MS for studying epitopes was with lysine acetylation in studies of the epitope of lysozyme.15
DEPC is a promising CL reagent because it can label numerous nucleophilic residues, including lysine, histidine, serine, threonine, tyrosine, and the N-terminus, allowing about 30% of the residues in the average protein to be probed.23 The labeling extents of histidine and lysine residues are correlated with their solvent accessible surface area (SASA), while the labeling of serine, threonine and tyrosine are sensitive to their microenvironment, particularly the presence of nearby hydrophobic residues.19 Other effects of protein microenvironment on DEPC labeling have also been reported.24 DEPC-CL/MS has been used previously to study protein-ligand binding sites,25-27 protein-protein interactions,28,29 and HOS perturbations of mAbs caused by heat stress.17,18,30,31 Results also suggest that DEPC labeling is largely unaffected by protein dynamics that occur on the millisecond timescale.17,25 Despite a growing number of successful DEPC-CL/MS studies, there are no reports, to our knowledge, that demonstrate its use for investigating antibody:antigen interactions.
To evaluate DEPC-CL/MS for studying antibody-antigen interactions, we chose to use tumor necrosis factor-α (TNFα) as a model system. Neutralizing TNFα is an effective treatment against a number of diseases such as rheumatoid arthritis, Crohn’s disease, and psoriasis. Numerous TNFα neutralizing protein therapeutics have been developed. Each of these therapeutic proteins has a slightly different epitope,32 making this protein and its associated antibodies a valuable system for exploring the effectiveness of DEPC-CL/MS for epitope mapping. In this work, three model mAbs were investigated – adalimumab, infliximab, and golimumab – each of which has a different epitope and stabilizes the TNFα trimer to different extents.32-34 Of particular interest in this study was elucidating the DEPC labeling behavior of residues both near and distant from the epitope. Our results show that histidine and lysine residues in the epitope undergo dramatic decreases in labeling, while serine, threonine, and tyrosine residues at the edges of the epitope can undergo unexpected increases in labeling due to the creation of nearby hydrophobic pockets. In addition, we find that most residues that are distant from the epitope do not undergo labeling changes, but a few residues do change because of side chain reorganizations that occur upon antibody-TNFα binding. Taken as a whole, our results suggest that DEPC has potential for epitope mapping when the unique reaction behavior of serine, threonine, and tyrosine residues at the edges of the epitope are properly considered.
Materials and Methods
Materials
The antibodies, proteins, and other chemicals that were used in this study are listed in the Supporting Information.
DEPC labeling and proteolytic digestion
DEPC stock solutions were prepared in acetonitrile, and final acetonitrile concentrations in reacted protein samples were less than 1% v/v. The DEPC labeling reactions were conducted in a 500 μL MOPS buffer (50 mM), with antibody:antigen concentrations of 1 μM mAb:1.2 μM TNFα monomer. TNFα is a trimer, and a molar excess of the mAb was used to ensure ~100% complexation of the trimer. Labeling was conducted at a DEPC:protein molar ratio of 1000:1 at 37 °C for 5 min. The DEPC concentration was chosen based on predictions of proper reagent concentration to avoid over labeling.35 After 5 min, imidazole at a 1:50 DEPC:imidazole molar ratio was added to quench the reaction. At least three replicate DEPC analyses were performed for each mAb-TNFα complex.
After the DEPC reaction, 50 μL of acetonitrile were added, and samples were heated at 50 °C for 45 min to denature the proteins. Prior to denaturation, the disulfide bonds were reduced with TCEP at 25 mM for 5 min and then alkylated with iodoacetamide at 25 mM for 20 min in the dark. Finally, proteolytic digestion was performed using 50 μL of immobilized trypsin for a ~1:100 (w/w) substrate to enzyme ratio, and the protein was digested overnight at 37 °C. To remove trypsin and collect the resulting peptides after digestion, the samples were centrifuged at 14,000 rpm, and the supernatant was collected. The supernatant was then concentrated 5-fold using a speed vacuum and immediately analyzed. Protein digestion and sample preparation conditions were identical for all protein samples so that any minor DEPC label loss that could occur due to hydrolysis is kept the same for all samples.
LC/MS/MS of CL samples
For online LC/MS/MS analyses, 5 μL was injected into a Dionex UltiMate 3000 RSLC capillary LC system (Thermo Scientific). The flow rate was 400 nL/min. Peptides were separated with an Acclaim Pepmap RSLC column (300 μm x 15 cm, C18, 2 μM, Thermo Scientific) with LC/MS grade water and 0.1% formic acid as solvent A and acetonitrile as solvent B. A linear gradient from 5% B to 50% B over 55 minutes with a final wash of 95% B for 15 minutes was used. Electrospray ionization was used in positive mode with a needle voltage of 2100 V. Mass spectra were acquired on a Thermo Scientific Orbitrap Fusion Tribrid mass spectrometer.
Tandem mass spectrometry (MS/MS) was conducted using collision-induced dissociation in the linear quadrupole ion trap. An inclusion list of possible labeled and unlabeled TNFα tryptic peptides was used to ensure these ions would be fragmented while an exclusion list of antibody peptides was used. The inclusion list was used to guarantee detection and fragmentation of TNFα peptides for determining their covalent labeling sites and extents.
CL/MS data analysis
A custom software pipeline designed specifically for DEPC-CL/MS experiments was used as described previously.30 Briefly, tandem mass spectra were searched against a database consisting of TNFα and the common repository of adventitious proteins ((http://www.thegpm.org/crap/index.html) for identifying peptides and their labeled sites. The search parameters used were a precursor mass tolerance of 10 ppm, a product ion tolerance of 0.5 Da, carbamidomethylation of Cys and DEPC modification of His, Lys, Ser, Thr, Tyr, and N-terminus (mass addition of 72.0211 Da) as variable modifications. For determining modification extents, peak areas of labeled and unlabeled ions obtained from reconstructed ion chromatograms of each species were used to calculate percent labeling at each labeled site. All peptides containing a modified residue, including ones with missed cleavages, are considered in the analysis.
Size-exclusion chromatography (SEC)
SEC was used to separate TNFα and mAbs, and the instrumentation and methods are described in the Supporting Information.
Results and Discussion
DEPC-CL/MS considerations for antibody-antigen complexes
TNFα is a 157-residue protein with 35 DEPC-modifiable residues. Labeling of TNFα alone reveals that 34 of these residues can be modified, thereby providing adequate structural coverage (Table S1). DEPC-CL/MS experiments typically compare labeling of the free protein to the complexed protein to identify binding sites. However, for antibody-antigen systems, it can be challenging to directly compare free TNFα to the TNFα/mAb complex because of the excess protein load contributed by the antibody. To correct for this increased number of labelable residues, control experiments were conducted on TNFα in solution with the non-binding mAb rituximab. Rituximab has an equivalent number of labelable residues to the mAbs that bind TNFα, providing a means of correcting for any labeling changes causes by the presence of an antibody. Labeling experiments in the presence of rituximab reveal that there are fewer (< 34) residues labeled in TNFα when rituximab is present, suggesting that the labeling levels for some residues drop below the detection limit when extra protein is present.
A comparison of the labeling of TNFα with rituximab (i.e. control) vs. TNFα with a binding mAb reveals three different outcomes for the labeled residues (Figure S1). First, there are residues that undergo no significant change in labeling extent, indicating no change in their microenvironment or DEPC accessibility. Second, there are residues that increase in labeling because of an increase in solvent accessibility, especially for histidine and lysine residues, and/or changes in microenvironment, especially for serine, threonine, and tyrosine residues. Recently, we found that a more hydrophobic microenvironment around accessible serine, threonine, and tyrosine residues causes these weakly nucleophilic residues to react more extensively due to increased local concentrations of DEPC.17-19 Third, there are residues that decrease in labeling due to the loss of solvent exposure or a less hydrophobic microenvironment.
DEPC-CL/MS of TNFα in complex with adalimumab
Adalimumab has the largest epitope of the studied mAbs. The epitope is made up of two protomers of the TNFα homotrimer (Figure 1A and B) and is comprised of residues in the A-A’, E-F, D-E, and G-H loops, as well as residues in the A and D β strands (Figure S2).32,36 The epitope contains 11 modifiable residues, eight of which are labeled in the control (i.e. rituximab-containing sample) and/or in the presence of adalimumab (Table S2). The remaining three, His78, His73, and Lys65, are not labeled in either the rituximab or adalimumab conditions as they are buried in the TNFα trimer.
Figure 1:

Structure and DEPC labeling results for TNFα in complex with adalimumab. (A) Cartoon representation of adalimumab in complex with the TNFα trimer. Adalimumab binds in the trimer groove to two protomers of the TNFα trimer. (B) Surface structure representation of the Fab of adalimumab in complex with the TNFα trimer (PDB ID: 3WD5). (C) DEPC labeling extents for the epitope residues in TNFα with and without adalimumab. (D) DEPC labeling extents for the non-epitope residues in TNFα with and without adalimumab. (E) Epitope residues that decrease in labeling (blue) upon adalimumab binding, mapped on the TNFα trimer. Adalimumab is shown in yellow and TNFα trimer is shown in gray. (F) Epitope residues that increase in labeling (red) upon adalimumab binding, mapped on the TNFα trimer.
The other eight epitope residues undergo changes in labeling extent upon comparing the rituximab control and mAb samples (Figure 1C and Table S2). Five of the eight residues decrease in labeling, including Tyr141, Lys112, Lys90, Thr72, and Ser71, because of burial upon adalimumab binding (Figure 1E). Labeling of most of these residues is completely prevented. Interestingly, three of the epitope residues (Thr77, Ser81, and Ser147) become labeled upon adalimumab binding, even though they were not labeled in the presence of non-binding rituximab (Figure 1F). The increased labeling of Thr77 may result from an increased hydrophobic microenvironment from proximity to Trp53 on the heavy chain of adalimumab (Figure S4A). While Ser81 does not make contact with adalimumab, it is considered part of the epitope because of its proximity to Lys90 and Glu135, which bind to the mAb (Figure S4B). Ser147 also becomes labeled, likely due to a more hydrophobic environment upon binding (Figure S4C). Overall, DEPC labeling changes occur for all modifiable residues in the TNFα epitope, but Thr and Ser residues at the edges of the epitope actually undergo increased labeling. These counterintuitive changes reflect the unique sensitivity that DEPC labeling has to hydrophobic microenvironments for these weakly nucleophilic residues.17-19
Outside of the epitope, 21 residues are labeled, and most of these (11/21) do not change in labeling extent, indicating that they do not experience significant changes in SASA or microenvironment. One residue, Ser86, decreases in labeling extent. Ser86 resides in the D-E loop and is repositioned upon adalimumab binding. It is likely that the hydrophobic pocket around Ser86 changes upon adalimumab binding, causing a decrease in labeling (Figure 1D). Interestingly, the labeling of adjacent Tyr87 also changes (Figure 1D), although the large error bars associated with the measurement of this residue cause this change to be insignificant according to a t-test. Nine residues outside of the epitope increase in labeling extent. Most (7/9) of these residues are serines, threonines, or tyrosines, whose DEPC reactivity are very sensitive to microenvironment changes.17-19 Two residues, Thr89 and Thr105, are not labeled in the rituximab control (Figure 1D), but upon adalimumab binding, their microenvironment becomes more hydrophobic, likely as a result of their close proximity to the epitope, explaining their increased labeling extent (Figure S4E). The labeling increases for Ser9, Tyr56, Tyr119, and Tyr151 are more difficult to explain. A common feature of these residues is that they face the trimer interface in TNFα (Figure S4F). It is possible that the stabilization of the trimer that occurs upon adalimumab binding changes the microenvironment of these residues in a way that increases their labeling extent. Two of these residues (i.e. Tyr56, and Tyr151) are completely unlabeled in the rituximab control and become labeled in the complex, making their behavior similar to the Ser and Thr residues at the edges of the epitope.
The two other non-epitope residues that increase in labeling extent are His15 and Lys128. Previous work with DEPC labeling indicates that changes in the labeling of histidine and lysine residues occurs with changes in SASA;23,25-29 however, the crystal structure of the Fab of adalimumab with the TNFα trimer does not indicate any significant change in the SASA of His15 or Lys128. One possible explanation is that there are more complex changes to the adalimumab/TNFα complex that are not reflected in the crystal structure because the complete antibody is not present, as is the case in our CL/MS experiments. Indeed, SEC experiments (Figure S3A and B) indicate that complexes larger than 3:1 complexes (Figure 1A) are formed under the concentrations used in our experiments. Large protein complexes consisting of multiple TNFα trimers and more than three adalimumab molecules are measured, which are consistent with previous reports that postulated polymeric-like complexes at high concentrations, such as those found in formulations37 and used in our studies. It is possible that these higher-order complexes influence the SASA of His15 and Lys128.
DEPC-CL/MS of TNFα in complex with infliximab
The infliximab epitope is smaller than the adalimumab epitope and consists primarily of residues on the C-D and E-F loops and a few residues in the C and D β-strands. While infliximab only binds to one protomer of the TNFα homotrimer, it stabilizes the trimer like adalimumab.32,36 The epitope has five modifiable residues, but only four are labeled in the rituximab control or infliximab-bound state. As with the adalimumab experiments, His73 is not labeled. Of the other four labeled epitope residues, three of them (Tyr141, Thr72, and Ser71) decrease in labeling (Figure 2A). These decreases are consistent with burial of these residues upon infliximab binding (Figure 2C). In contrast, Thr105 increases in labeling (Figure 2A) even though it is considered part of the epitope. Thr105 is on a solvent exposed loop in free TNFα, but upon infliximab binding, it becomes partially buried, thereby creating a more hydrophobic environment (Figure 2D). Thr105 labeling also increased upon adalimumab binding because of a more hydrophobic environment, but infliximab binding creates an even bigger hydrophobic pocket near Thr105, causing its DEPC reactivity to increase even more. As with adalimumab, most of the epitope residues undergo decreases in labeling, but Thr residues at the edge of the epitope undergo an increase in labeling due to the hydrophobic microenvironment that is created upon binding.
Figure 2:

Structure and DEPC labeling results for TNFα in complex with infliximab. (A) DEPC labeling extents for the epitope residues in TNFα with and without infliximab. (B) DEPC labeling extents for the non-epitope residues in TNFα with and without infliximab. (C) Epitope residues that decrease in labeling (blue) upon infliximab binding, mapped on the TNFα trimer. Infliximab is shown in orange and TNFα trimer is shown in gray (PDB 4G3Y). (D) Epitope residues that increase in labeling (red) upon infliximab binding, mapped on the TNFα trimer.
There are also 22 non-epitope residues that are labeled. Most of these residues (12/22) do not change in labeling extent; however, six residues decrease in labeling and three increase (Figure 2B). One of these residues, Lys112, decreases due to its proximity to the epitope, which causes it to be partially buried upon binding (Figure S5A). Lys98, Tyr119, and Ser95 also decrease in labeling. Each of these residues faces toward the TNFα trimer interface (Figure S5B), and their decreased labeling is likely due to structural changes that occur upon stabilization of the trimer, as was observed with adalimumab. Interestingly, upon adalimumab binding, Tyr119 labeling was found to increase, while Lys98 and Ser95 did not change, suggesting that the structural changes associated with trimer stabilization are different for these two mAbs. These structural differences in stabilization are perhaps not surprising as adalimumab binds two promoters of TNFα while infliximab only binds one. Lastly, Ser147 and Tyr87 also decrease in labeling, but they are not near the trimer interface or the epitope. It is possible that the higher order complexes that are detected by SEC are responsible for the decreases observed for these residues (Figure S3D).
Three non-epitope residues increase in DEPC labeling upon infliximab binding: Ser99, Thr89, and Lys128. Ser99 is near the epitope, and therefore in a more hydrophobic environment (Figure S4C). Ser99 is positioned close to Phe28 in the heavy chain of infliximab and Tyr115 in the adjacent TNFα monomer, creating a hydrophobic pocket without completely burying this residue. Such a microenvironment is not created upon adalimumab binding, so Ser99 is not found to be labeled upon binding that mAb. The increase in labeling of Lys128 and Thr89 is difficult to explain, but as with adalimumab binding, the formation of higher-order complexes (Figure S3C and D) may explain their labeling behavior.
DEPC-CL/MS of TNFα in complex with golimumab
Golimumab has the smallest epitope.38 It only binds one protomer of the trimer and stabilizes the trimer the least.32,36 The golimumab epitope is made up of residues in the A-A’, C-D, G-H, and E-F loops. Tyr141, Thr72, and Ser71 are involved in the golimumab epitope, as they were for infliximab and adalimumab. Thr105 is also part of the epitope for golimumab. The epitope has five modifiable residues, of which four are labeled. The one epitope residue that is not labeled in either the rituximab control or upon golimumab binding is Lys65. The other four epitope residues, Tyr141, Thr105, Thr72, and Ser71, are the same four epitope residues in infliximab and have the same labeling behavior as was seen upon infliximab binding. Tyr141, Thr72, and Ser71 all decrease in labeling (Figure 3A) due to burial (Figure 3C), while Thr105 experiences an increase in labeling due to its increased hydrophobic environment caused by the proximity of Ile102 in the heavy chain of golimumab (Figure 3D).
Figure 3:

Structure and DEPC labeling results for TNFα in complex with golimumab. (A) DEPC labeling extents for the epitope residues in TNFα with and without golimumab. (B) DEPC labeling extents for the non-epitope residues in TNFα with and without golimumab. (C) Epitope residues that decrease in labeling (blue) upon golimumab binding, mapped on the TNFα trimer. Golimumab is shown in green and TNFα trimer is shown in gray (PDB 5YOY). (D) Epitope residues that increase in labeling (red) upon golimumab binding, mapped on the TNFα trimer.
There are 19 residues labeled by DEPC that are not considered part of the epitope (Figure 3B). Eight do not change in labeling extent, eight decrease, and four increase. Of the eight decreases, Lys98, His15, Tyr119, and Ser95 are all part of the trimer interface, and thus their decreased labeling is perhaps due to trimer stabilization (Figure S6A),39 as was observed for infliximab and adalimumab. Interestingly, both golimumab and infliximab bind one protomer and have similar patterns of changes to residues in the trimer interface, while adalimumab binds two promoters and different trimer interface residues undergo changes in labeling. These data suggest that the structural changes associated with trimer stabilization are similar for golimumab and infliximab. The other four residues that are distant from the epitope and decrease in labeling, Tyr87, Ser86, Thr7, and Ser147, are also distant from the trimer interface (Figure S6B). Ser86 and Tyr87 are in the D-E loop, and the crystal structure of the TNFα/golimumab complex indicates structural changes in the D-E loop upon binding (Figure S6D), which cause a change in the microenvironment around these residues. Labeling changes to Thr7 and Ser147 are more difficult to explain, but the complicated mixture of higher order complexes that are observed by SEC (Figure S3E and F) upon golimumab binding could be the cause of these labeling changes. The labeling increases that are observed for Lys128, Thr89, Thr77, and Ser9 might also be caused by the same complicated mix of complexes. All four of these residues are distant from the epitope and are not involved in the trimer interface (Figure S6C), although it should be noted that Ser9 is not resolved in the crystal structure of the complex.
Conclusions
Using three therapeutic mAbs that bind TNFα, we demonstrate that DEPC-CL/MS can reveal accurate information about epitopes and subtle structural changes away from epitopes. To get reliable results, control experiments involving a non-binding mAb are required to account for labeling changes that are caused by the presence of a large number of modifiable residues in the mAb. Results show that residues in the epitope that become completely buried upon binding decrease in labeling extent. Interestingly, weakly nucleophilic serine, threonine, and tyrosine residues that are in or near the epitope, but are only partially buried, undergo an increase in labeling extent due to an increased hydrophobic microenvironment. This effect is consistent with our previous work17-19 and is likely explained by increased local concentrations of DEPC, which is a somewhat hydrophobic molecule. An excellent example of this effect is the increased labeling of Thr105 upon binding to all three mAbs. In free TNFα, Thr105 is on an unstructured loop and is fully solvent exposed; however, upon mAb binding, residues from the antibodies create a hydrophobic microenvironment around this residue without fully burying it, causing an increase in labeling. A more significant hydrophobic microenvironment is created upon infliximab and golimumab binding, and Thr105 labeling is found to increase to the greatest extent when these antibodies are bound to TNFα. This unique reactivity of serine, threonine, and tyrosine residues is observed for all three of the antibody-antigen complexes studied here. Future work will be necessary to understand how robust this observation is for other antibody-antigen complexes, if DEPC is to be used fully reliably for epitope mapping.
Most residues that are distant from the epitope do not undergo any significant changes in labeling extent. The residues that do change primarily fall into three categories. The first category includes residues that are not part of the epitope but are in close proximity to the epitope and thus experience a change in labeling extent due to partial burial. Second, there are residues at the TNFα trimer interface that undergo changes in labeling that reflect structural changes caused by trimer stabilization upon antibody binding. The third category includes primarily serine, threonine, and tyrosine residues that experience changes in microenvironment due to HOS changes that occur upon antibody binding. These changes can be either increases or decreases in labeling and reflect more or less hydrophobic environments being created around these residues that are the result of (i) structural changes or (ii) the formation of complexes with large mAb/TNFα stoichiometries. These large complexes are present in solution when the full antibody is present, but they are not present in the crystal structures that only contain the antigen-binding fragment of the mAb. Overall, DEPC labeling can provide information about antibody-antigen epitopes, although the resulting labeling changes depend on the extent to which a residue is buried and how the microenvironment around the residue changes upon binding. In the latter case, we again see that the reactivity of serine, threonine, and tyrosine residues are sensitive to the hydrophobic microenvironment of these residues, making them sensitive probes of binding and structural changes throughout the protein. Overall, it seems that DEPC has good potential for epitope mapping and could also be useful for rapid screening of potential therapeutic antibodies or for bioequivalence studies.
Supplementary Material
Acknowledgements
The authors wish to thank the UMass Amherst Institute of Applied Life Sciences mass spectrometry center and Prof. Stephen J. Eyles for his help with the operation of the Thermo Scientific Orbitrap Fusion mass spectrometer. The authors also thank Eric Graban and Dr. John Hale from QuarryBio for access to their custom software pipeline for analyzing the DEPC-CL/MS data.
Funding
This work was partially supported by the National Institutes of Health (NIH) for Small Business Innovation Research (SBIR) under grant R43 GM116211 and partially supported by NIH grant R01 GM075092. Acquisition of the Thermo Scientific Orbitrap Fusion was made possible by NIH grant S10OD010645. The content is solely the responsibility of the authors and does not necessarily represent the official views of NIH. This work was also supported in part by a Graduate School Research Grant to C.Y.T. from the University of Massachusetts Amherst.
Footnotes
Disclosure statement
The authors report no conflict of interest.
Supporting Information
Additional experimental details, and materials and methods, including SEC methods and data, tables of labeling extents, and further figures of TNFα crystal structure are included in the supporting information.
Data availability
The raw mass spectrometric data can be accessed in Massive (MassIVE MSV000088376).
References
- (1).Pettersson I Methods of Epitope Mapping. Mol. Biol. Rep 1992, 16, 149–153. [DOI] [PubMed] [Google Scholar]
- (2).Abbott WM; Damschroder MM; Lowe DC Current Approaches to Fine Mapping of Antigen-Antibody Interactions. Immunology 2014, 142 (4), 526–535. 10.1111/imm.12284. [DOI] [PMC free article] [PubMed] [Google Scholar]
- (3).Huang RYC; Iacob RE; Sankaranarayanan S; Yang L; Ahlijanian M; Tao L; Tymiak AA; Chen G Probing Conformational Dynamics of Tau Protein by Hydrogen/Deuterium Exchange Mass Spectrometry. J. Am. Soc. Mass Spectrom 2018, 29 (1), 174–182. 10.1007/s13361-017-1815-8. [DOI] [PubMed] [Google Scholar]
- (4).Hager-Braun C; Tomer KB Determination of Protein-Derived Epitopes by Mass Spectrometry. Expert Rev. Proteomics 2005, 2 (5), 745–756. 10.1586/14789450.2.5.745. [DOI] [PubMed] [Google Scholar]
- (5).Sun H; Ma L; Wang L; Xiao P; Li H; Zhou M; Song D Research Advances in Hydrogen–Deuterium Exchange Mass Spectrometry for Protein Epitope Mapping. Anal. Bioanal. Chem 2021, 413 (9), 2345–2359. 10.1007/s00216-020-03091-9. [DOI] [PubMed] [Google Scholar]
- (6).Li KS; Chen G; Mo J; Huang RY; Deyanova EG; Beno BR; O’Neil SR; Tymiak AA; Gross ML Orthogonal Mass Spectrometry-Based Footprinting for Epitope Mapping and Structural Characterization: The IL-6 Receptor upon Binding of Protein Therapeutics. Anal. Chem 2017, 89, 7742–7749. 10.1021/acs.analchem.7b01748. [DOI] [PMC free article] [PubMed] [Google Scholar]
- (7).Opuni KFM; Al-Majdoub M; Yefremova Y; El-Kased RF; Koy C; Glocker MO Mass Spectrometric Epitope Mapping. Mass Spectrom. Rev 2018, 37 (2), 229–241. 10.1002/mas.21516. [DOI] [PubMed] [Google Scholar]
- (8).Suckau D; Köhl J; Karwath G; Schneider K; Casaretto M; Bitter-Suermann D; Przybylski M Molecular Epitope Identification by Limited Proteolysis of an Immobilized Antigen-Antibody Complex and Mass Spectrometric Peptide Mapping. Proc. Natl. Acad. Sci. U. S. A 1990, 87 (24), 9848–9852. 10.1073/pnas.87.24.9848. [DOI] [PMC free article] [PubMed] [Google Scholar]
- (9).Zhang MM; Huang RYC; Beno BR; Deyanova EG; Li J; Chen G; Gross ML Epitope and Paratope Mapping of PD-1/Nivolumab by Mass Spectrometry-Based Hydrogen-Deuterium Exchange, Cross-Linking, and Molecular Docking. Anal. Chem 2020, 92 (13), 9086–9094. 10.1021/acs.analchem.0c01291. [DOI] [PMC free article] [PubMed] [Google Scholar]
- (10).Gramlich M; Hays HCW; Crichton S; Kaiser PD; Heine A; Schneiderhan-Marra N; Rothbauer U; Stoll D; Maier S; Zeck A Hdx-Ms for Epitope Characterization of a Therapeutic Antibody Candidate on the Calcium-Binding Protein Annexin-A1. Antibodies 2021, 10 (11), 1–12. 10.3390/antib10010011. [DOI] [PMC free article] [PubMed] [Google Scholar]
- (11).Zhang Q; Yang J; Bautista J; Badithe A; Olson W; Liu Y Epitope Mapping by HDX-MS Elucidates the Surface Coverage of Antigens Associated with High Blocking Efficiency of Antibodies to Birch Pollen Allergen. Anal. Chem 2018, 90 (19), 11315–11323. 10.1021/acs.analchem.8b01864. [DOI] [PubMed] [Google Scholar]
- (12).Baerga-Ortiz A; Hughes CA; Mandell JG; Komives EA Epitope Mapping of a Monoclonal Antibody against Human Thrombin by H/D-Exchange Mass Spectrometry Reveals Selection of a Diverse Sequence in a Highly Conserved Protein. Protein Sci. 2002, 11 (6), 1300–1308. 10.1110/ps.4670102. [DOI] [PMC free article] [PubMed] [Google Scholar]
- (13).Jones LM; Sperry J; Carroll J; Gross ML Fast Photochemical Oxidation of Proteins (FPOP) for Epitope Mapping. Anal. Chem 2011, 83 (20), 7657–7661. 10.1021/ac2007366.Fast. [DOI] [PMC free article] [PubMed] [Google Scholar]
- (14).Pan LY; Salas-Solano O; Valliere-Douglass JF Localized Conformational Interrogation of Antibody and Antibody-Drug Conjugates by Site- Specific Carboxyl Group Footprinting. MAbs 2017, 9 (2), 307–318. 10.1080/19420862.2016.1268306. [DOI] [PMC free article] [PubMed] [Google Scholar]
- (15).Fiedler W; Borchers C; Macht M; Deininger SO; Przybylski M Molecular Characterization of a Conformational Epitope of Hen Egg White Lysozyme by Differential Chemical Modification of Immune Complexes and Mass Spectrometric Peptide Mapping. Bioconjug. Chem 1998, 9 (2), 236–241. 10.1021/bc970148g. [DOI] [PubMed] [Google Scholar]
- (16).Glocker MO; Nock S; Sprinzl M; Przybylski M Characterization of Surface Topology and Binding Area in Complexes of the Elongation Factor Proteins EF-Ts and EF-Tu·GDP from Thermus Thermophilus: A Study by Protein Chemical Modification and Mass Spectrometry. Chem. - A Eur. J 1998, 4 (4), 707–715. [Google Scholar]
- (17).Tremblay CY; Limpikirati P; Vachet RW Complementary Structural Information for Stressed Antibodies from Hydrogen – Deuterium Exchange and Covalent Labeling Mass Spectrometry. 2021, 32 (5), 1237–1248. 10.1021/jasms.1c00072. [DOI] [PMC free article] [PubMed] [Google Scholar]
- (18).Limpikirati P; Hale JE; Hazelbaker M; Huang Y; Jia Z; Yazdania M; Grabanb EM; Vaughan RC; Vachet RW Covalent Labeling and Mass Spectrometry Reveal Subtle Higher Order Structural Changes for Antibody Therapeutics. MAbs 2019, 11 (3), 463–476. 10.1080/19420862.2019.1565748. [DOI] [PMC free article] [PubMed] [Google Scholar]
- (19).Limpikirati P; Pan X; Vachet RW Covalent Labeling with Diethylpyrocarbonate: Sensitive to the Residue Microenvironment, Providing Improved Analysis of Protein Higher Order Structure by Mass Spectrometry. Anal. Chem 2019, 91 (13), 8516–8523. 10.1021/acs.analchem.9b01732. [DOI] [PMC free article] [PubMed] [Google Scholar]
- (20).Limpikirati PK; Zhao B; Pan X; Eyles SJ; Vachet RW Covalent Labeling/Mass Spectrometry of Monoclonal Antibodies with Diethylpyrocarbonate: Reaction Kinetics for Ensuring Protein Structural Integrity. J. Am. Soc. Mass Spectrom 2020, 31 (6), 1223–1232. 10.1021/jasms.0c00067. [DOI] [PMC free article] [PubMed] [Google Scholar]
- (21).Li J; Wei H; Krystek SR; Bond D; Brender TM; Cohen D; Feiner J; Hamacher N; Harshman J; Huang RY; Julien SH; Lin Z; Moore K; Mueller L; Noriega C; Sejwal P; Sheppard P; Stevens B; Chen G; Tymiak AA; Gross ML; Schneeweis LA Mapping the Energetic Epitope of an Antibody/Interleukin-23 Interaction with Hydrogen/Deuterium Exchange, Fast Photochemical Oxidation of Proteins Mass Spectrometry, and Alanine Shave Mutagenesis. Anal. Chem 2017, 89, 2250–2258. 10.1021/acs.analchem.6b03058. [DOI] [PMC free article] [PubMed] [Google Scholar]
- (22).Wecksler AT; Kalo MS; Deperalta G Mapping of Fab-1:VEGF Interface Using Carboxyl Group Footprinting Mass Spectrometry. J. Am. Soc. Mass Spectrom 2015, 26 (12), 2077–2080. 10.1007/s13361-015-1273-0. [DOI] [PubMed] [Google Scholar]
- (23).Mendoza VL; Vachet RW Protein Surface Mapping Using Diethylpyrocarbonate with Mass Spectrometric Detection. Anal. Chem 2008, 80 (8), 2895–2904. 10.1021/ac701999b. [DOI] [PMC free article] [PubMed] [Google Scholar]
- (24).Kalkum M; Przybylski M; Glocker MO Structure Characterization of Functional Histidine Residues and Carbethoxylated Derivatives in Peptides and Proteins by Mass Spectrometry. Bioconjug. Chem 1998, 9 (2), 226–235. 10.1021/bc970162t. [DOI] [PubMed] [Google Scholar]
- (25).Liu T; Limpikirati P; Vachet RW Synergistic Structural Information from Covalent Labeling and Hydrogen – Deuterium Exchange Mass Spectrometry for Protein – Ligand Interactions. Anal. Chem 2019, 91, 15248–15254. 10.1021/acs.analchem.9b04257. [DOI] [PMC free article] [PubMed] [Google Scholar]
- (26).Glocker MO; Kalkum M; Yamamoto R; Schreurs J Selective Biochemical Modification of Functional Residues in Recombinant Human Macrophage Colony-Stimulating Factor β (RhM-CSF β): Identification by Mass Spectrometry. Biochemistry 1996, 35 (46), 14625–14633. 10.1021/bi961199o. [DOI] [PubMed] [Google Scholar]
- (27).Hondal RJ; Ma S; Caprioli RM; Hill KE; Burk RF Heparin-Binding Histidine and Lysine Residues of Rat Selenoprotein P. J. Biol. Chem 2001, 276 (19), 15823–15831. 10.1074/jbc.M010405200. [DOI] [PubMed] [Google Scholar]
- (28).Mendoza VL; Antwi K; Baron-Rodriguez MA; Blanco C; Vachet RW Structure of the Preamyloid Dimer of β-2-Microglobulin from Covalent Labeling and Mass Spectrometry. Biochemistry 2010, 49, 1522–1532. 10.1021/bi901748h. [DOI] [PMC free article] [PubMed] [Google Scholar]
- (29).Mendoza VL; Baro MA; Blanco C; Vachet RW Structural Insights into the Pre-Amyloid Tetramer of β −2- Microglobulin from Covalent Labeling and Mass Spectrometry. Biochemistry 2011, 50, 6711–6722. [DOI] [PMC free article] [PubMed] [Google Scholar]
- (30).Borotto NB; Zhou Y; Hollingsworth SR; Hale JE; Graban EM; Vaughan RC; Vachet RW Investigating Therapeutic Protein Structure with Diethylpyrocarbonate Labeling and Mass Spectrometry. Anal. Chem 2015, 87, 10627–10634. 10.1021/acs.analchem.5b03180. [DOI] [PMC free article] [PubMed] [Google Scholar]
- (31).Liu T; Marcinko TM; Kiefer PA; Vachet RW Using Covalent Labeling and Mass Spectrometry To Study Protein Binding Sites of Amyloid Inhibiting Molecules. Anal. Chem 2017, 89, 11583–11591. 10.1021/acs.analchem.7b02915. [DOI] [PMC free article] [PubMed] [Google Scholar]
- (32).Hu S; Liang S; Guo H; Zhang D; Li H; Wang X; Yang W; Qian W; Hou S; Wang H; Guo Y; Lou Z Comparison of the Inhibition Mechanisms of Adalimumab and Infliximab in Treating Tumor Necrosis Factor α-Associated Diseases from a Molecular View. J. Biol. Chem 2013, 288 (38), 27059–27067. 10.1074/jbc.M113.491530. [DOI] [PMC free article] [PubMed] [Google Scholar]
- (33).Daub H; Traxler L; Ismajli F; Groitl B; Itzen A; Rant U The Trimer to Monomer Transition of Tumor Necrosis Factor-Alpha Is a Dynamic Process That Is Significantly Altered by Therapeutic Antibodies. Sci. Rep 2020, 10 (9265), 1–10. 10.1038/s41598-020-66123-5. [DOI] [PMC free article] [PubMed] [Google Scholar]
- (34).Mitoma H; Horiuchi T; Tsukamoto H; Ueda N Molecular Mechanisms of Action of Anti-TNF-α Agents – Comparison among Therapeutic TNF-α Antagonists. Cytokine 2018, 101, 56–63. 10.1016/j.cyto.2016.08.014. [DOI] [PubMed] [Google Scholar]
- (35).Pan X; Limpikirati P; Chen H; Liu T; Vachet RW Higher-Order Structure Influences the Kinetics of Diethylpyrocarbonate Covalent Labeling of Proteins. J. Am. Soc. Mass Spectrom 2020, 31 (3), 658–665. 10.1021/jasms.9b00132. [DOI] [PMC free article] [PubMed] [Google Scholar]
- (36).Van Schie KA; Ooijevaar-De Heer P; Dijk L; Kruithof S; Wolbink G; Rispens T Therapeutic TNF Inhibitors Can Differentially Stabilize Trimeric TNF by Inhibiting Monomer Exchange. Sci. Rep 2016, 6, 32747. 10.1038/srep32747. [DOI] [PMC free article] [PubMed] [Google Scholar]
- (37).Contreras MA; Macaya L; Neira P; Camacho F; González A; Acosta J; Montesino R; Toledo JR; Sánchez O New Insights on the Interaction Mechanism of RhTNFα with Its Antagonists Adalimumab and Etanercept. bioRxiv Prepr. 2020. 10.1101/2020.06.21.163824. [DOI] [PubMed] [Google Scholar]
- (38).Kim MS; Lee SH; Song MY; Yoo TH; Lee BK; Kim YS Comparative Analyses of Complex Formation and Binding Sites between Human Tumor Necrosis Factor-Alpha and Its Three Antagonists Elucidate Their Different Neutralizing Mechanisms. J. Mol. Biol 2007, 374 (5), 1374–1388. 10.1016/j.jmb.2007.10.034. [DOI] [PubMed] [Google Scholar]
- (39).Krissinel E; Henrick K Inference of Macromolecular Assemblies from Crystalline State. J. Mol. Biol 2007, 372 (3), 774–797. 10.1016/j.jmb.2007.05.022. [DOI] [PubMed] [Google Scholar]
Associated Data
This section collects any data citations, data availability statements, or supplementary materials included in this article.
Supplementary Materials
Data Availability Statement
The raw mass spectrometric data can be accessed in Massive (MassIVE MSV000088376).