

Abstract
Purpose:
An average of 611 deaths and over 47,000 bicyclists are injured in traffic-related crashes in the United States each year. Efforts to increase bicycle safety are needed to reduce and prevent injuries and fatalities, especially as trends indicate that ridership is increasing rapidly. The objective of this study was to evaluate the effect of bicycle-specific roadway facilities (e.g., signage and bicycle lanes) in reducing bicycle crashes.
Methods:
We conducted a case site-control site study of 147 bicycle crash-sites identified from the Iowa Department of Transportation crash database from 2007-2010 and 147 matched non-crash sites. Control sites were randomly selected from intersections matched to case sites on neighborhood (census block group) and road classification (arterial, feeder, collector, etc.). We examined crash risk by any on-road bicycle facility present and by facility type (pavement markings--bicycle lanes and shared lane arrows, bicycle-specific signage, and the combination of markings and signage), controlling for bicycle volume, motor vehicle volume, street width, sidewalks, and traffic controls.
Results:
A total of 11.6% of case sites and 15.0% of controls had an on-road bicycle facility. Case intersections had higher bicycle volume (3.52 vs. 3.34 per 30min) and motor vehicle volume (248.77 vs. 205.76 per 30min) than controls. Our results are suggestive that the presence of an on-road bicycle facility decreases crash risk by as much as 60% with a bicycle lane or shared lane arrow (OR 0.40, 95% CI 0.09-1.82) and 38% with bicycle-specific signage (OR 0.62, 95% CI 0.15-2.58).
Conclusions:
Investments in bicycle-specific pavement markings and signage have been shown to be beneficial to traffic flow, and our results suggest that they may also reduce the number of bicycle-motor vehicle crashes and subsequent injuries and fatalities. As a relatively low-cost traffic feature, community considerations for further implementation of these facilities are justified.
Keywords: bicycles, pedal cycles, injury prevention, environment, crash, bicycle facility
1. Introduction
In the past two decades bicycle ridership has increased in the United States, while the number of crashes each year has remained fairly steady. However, with 51,000 traffic-related bicycling injuries and 630 deaths in the United States in 2009, prevention strategies are needed (National Highway Traffic Safety Administration, 2009, Insurance Institute for Highway Safety, 2012). The current body of literature indicates that in comparison to European countries, the United States has deficiencies in the physical traffic environment to accommodate bicyclists (Pucher and Dijkstra, 2000). Non-motorized transportation has been neglected in terms of planning, zoning, and land use in the United States (Pucher and Dijkstra, 2000).
One reason for this lack of infrastructure could be the inadequate evidence to support different approaches to reducing bicycle crashes. Existing data do not provide adequate evidence on the actual causes and contributing factors leading to these crashes and resulting injuries, challenging those interested in designing and optimally implementing prevention strategies. Transportation and urban planners face a critical gap in knowledge about which approaches work best to reduce crashes between cars and bicycles.
With the increases in ridership, many cities are adopting the ‘complete streets’ design concept, which accommodates all types of transportation modes, including bicycle facilities (National Complete Streets Coalition, 2010). Bicycle facilities can include bicycle lanes, shared lane arrows, and ‘Share the Road’ signage, as well as combinations of these strategies. These new facilities introduce changes in traffic flow for both motorists and bicyclists. Some research has been conducted regarding these approaches, but more is needed to fully understand the complexity of roadways and the risk factors that lead to crashes. For example, some roadway facilities (Pucher and Dijkstra, 2000, Walker, 2007) have been studied separately, but very few studies have looked at more than one facility or controlled for confounding factors to allow for comparisons of the impact on crash risk.
Existing literature has generally associated bicycle facilities with increased ridership and reduced crash occurrence (e.g., Moritz, 1997, Alta Planning, Federal Highway Administration, 2006, Reynolds et al., 2009, Parker et al., 2011). Yet, overall, little is known about the comparative effectiveness of bicycle-specific facilities on crashes. This knowledge deficit is especially large in rural areas in the United States, as the limited existing literature has focused on densely populated urban areas and has often lacked adjustment for bicycle and/or motor vehicle volume, which are different in rural and urban settings. Large urban areas in the United States are set up for better connectivity for implementation of bicycle-specific infrastructure than rural areas because of the density of both population and roadways, and many are taking advantage of this by integrating such infrastructure. Bicycle planning has also historically focused on design from an urban perspective, rather than incorporating larger regional areas that would include surrounding rural communities (Aytur et al., 2011, Evenson et al., 2011). Rural areas are not as easily adapted as urban, but should not be neglected.
The purpose of this study was to expand beyond findings from studies in large urban areas, which may not be generalizable to conditions in small towns and small urban areas. We also studied locations with multiple bicycle facilities and comparisons of individual types of facilities-- evidence needed to help planners choose which facility approach to use. We hypothesized that on-road bicycle facilities reduce crash risk and that this protective effect would vary by facility type.
2. Methods
We conducted a matched case site-control site study of intersections to investigate the impact of on-road bicycle facilities on bicycle-motor vehicle (BMV) crashes in the mostly rural state of Iowa. This design was based on a pedestrian-motor vehicle crash risk study in California and Washington (Koepsell et al., 2002) and was selected to optimize feasibility and efficiency in studying relatively rare outcomes compared to other study designs (e.g., cohort study), ability to integrate traffic volumes to control for confounding, and the ability to focus on environmental variables. The objective of this study was to determine the impact of different types of bicycle facilities on BMV crash risk.
2.1. Setting
Data collection was conducted from July to October of 2012 in the four counties in eastern Iowa with the highest number of BMV crashes (Black Hawk, Johnson, Linn, and Scott). We made the assumption that high frequencies of crashes could serve as a proxy for places with the largest number of bicyclists. We used frequencies rather than rates because we did not have an adequate denominator, due to lack of readily available bicycle volume data. We selected four counties to optimize the sample size with available study resources. The months of June through October were chosen because they have the highest frequency of bicycle crashes.
2.2. Selection of cases and controls
Case sites were intersections where BMV crashes occurred, drawn from the Iowa Department of Transportation (DOT) crash database, June to October of 2007 to 2010 in Black Hawk (N=76, 25.9%), Johnson (N=64, 21.8%), Linn (N=78, 26.5%), and Scott (N=76, 25.9%) counties. This database includes crashes recorded by police or driver report, which includes all crashes resulting in death, personal injury, or property damage of $1500 or more (Iowa Department of Transportation, 2012). Intersection crashes were the focus of this study because they occur more frequently and have inherently different traffic flow and environmental characteristics than non-intersection crashes, which would require separate protocols for selecting controls and collecting data.
Control sites were intersections matched to case sites by neighborhood (census block group) and roadway classification. Matching on both neighborhood and road type was conducted to control for unmeasurable confounders and for study efficiency. Matching on these variables has been used in other similar studies, such as a bicycle-motor vehicle study by Schepers et al. (2011) and a pedestrian-motor vehicle study by Koepsell et al. (2002).
A list of eligible control sites was generated for each case site. To do this, we mapped all of the crashes in ArcGIS (ESRI, 2011) using X and Y coordinates available from the Iowa DOT database. We then labeled the roadway classifications within the road network and marked boundaries of block groups. From this map, we identified eligible controls for each case site with the same block group and combination of roadway classifications of the radiating streets as the case sites. One control site was matched to each case site by randomly choosing from the eligible pool using a random number generator. If a block group had fewer than two eligible control sites we identified more controls within the surrounding block groups, working in concentric rings until two controls were identified. The distribution of roadway classifications among the cases and controls were as follows: Index street- 11% non-interstate principal arterial, 24% minor arterial, 20% major collector, and 44% local; Non-index street- 17% non-interstate principal arterial, 31% minor arterial, 14% major collector, and 37% local.
Intersections were excluded if they had changed significantly between the time the crash occurred and the time the data were collected, for both case and control sites (e.g., lane added, major construction, etc.) These changes included consideration of bicycle facilities, therefore, instances in which bicycle facilities were implemented after the crash were also excluded. We determined these significant changes through consultation with city traffic engineers. Sites where changes occurred were excluded based on the presumption that the bicycle and motor vehicle volumes would have changed in the time between the index crash and the on-site data collection and that current volume data would not serve as a good proxy for volume at the time of the crash for those sites.
2.3. Sampling
Based on a sample size calculation using Cochrane-Mantel-Haenszel as the test statistic and pilot data from Johnson County crash data from 2008, we needed a sample of 294 intersections (147 cases and 147 controls) to ensure 80% power to detect an odds ratio of 0.5. Based on these sample size calculations, 147 case sites were randomly selected from 217 eligible intersections.
Since intersections can change in terms of environmental conditions and traffic volumes with time of day, day of week, and time of year, intersections qualified to be included in the study more than once if they were at different dates and times and they were also retained in the eligible pool of controls. For example, two crashes that occurred at the same intersection during the study period were both included because environmental factors (e.g., traffic flow) were studied separately to correspond with the unique characteristics of each crash. The unit of analysis is crash site, which encompasses the intersection where a crash occurred and its corresponding characteristics at that time (e.g., time of day, day of week, season, etc.).
2.4. Data collection
Environmental variables (traffic volume, traffic controls, number of lanes, presence of sidewalks, and presence of bicycle facilities) were collected on-site. Data collection was conducted simultaneously, with two trained observers, one at the case site and one at the control site.
Traffic volume was collected during a 30-minute time interval that was 15 minutes before and 15 minutes after the time the index crash occurred, on the same day of the week, and as close to the original crash date as feasible (typically within two weeks). This was done to best approximate volume, light conditions, and traffic control timings at the time of the index crashes. All data were recorded manually and the 30-minute traffic counts were video recorded. Ten percent of the videos were reviewed for count accuracy which revealed a 0% error rate for bicycle counts and 3% error for motor vehicles. Still photographs of views from each intersection leg and of any bicycle facilities were taken.
Index street width was measured using ArcGIS (ESRI, 2011). Index street was defined as the street the motor vehicle was traveling on when the crash occurred and was identified from the existing DOT dataset.
2.5. Main exposures: Bicycle facility presence & bicycle facility type
Bicycle facilities included in this study were bicycle-specific signage, bicycle lanes, and shared lane arrows (Figure 1). Intersections without any of these features were classified as “none” for this variable. Bicycle lanes and shared lane arrows were combined into a category called pavement markings due to sample size restrictions within the shared lane arrows category.
Fig 1.
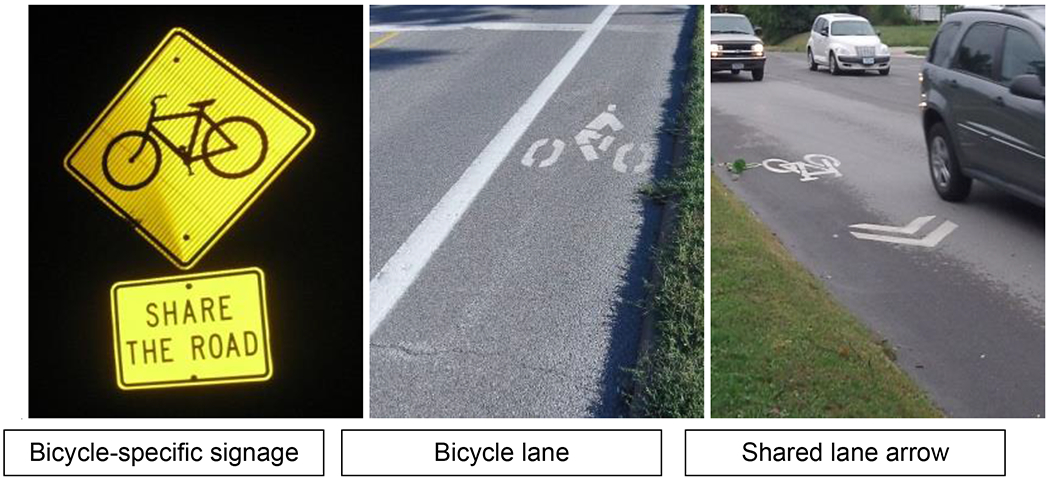
On-road bicycle facilities photographed during study data collection, Iowa, June-October 2012.
2.6. Covariates
Speed limit, curb-to-curb width, traffic controls, bicycle volume & motor vehicle volume, and presence of sidewalks were examined in unadjusted analyses. All of these variables were included in multivariable analyses, except speed limit, which was not significant.
Sidewalk presence was categorized as full, partial, or none in acknowledgement of the impact these different conditions can have on bicyclist behavior. For example, a bicyclist might move from riding on the road to riding on the sidewalk when the road in question has a sidewalk on one side of the intersection and not the other. This change in bicyclist behavior can have an impact on exposure of the bicycle to motor vehicles and on motorist awareness of the bicyclist’s presence.
Additionally, matching accounted for confounding by neighborhood and road type, both of which are associated with the presence of bicycle facilities and the risk of crash occurrence. We could not assume that these variables accounted for variance in bicycle or motor vehicle volume, and thus we collected bicycle volume manually. Bicycle volume is specific to each site, while block group and road classification encompass a site and immediately surrounding areas. Roadways were classified into seven categories: 1) Interstate, 2) Other principal arterial, 3) Minor arterial, 4) Major collector, 6) Minor collector- rural only, and 7) Local. These are standard classifications used by the DOT and are based on capacity, traffic volume, and speed limit.
2.7. Data Analysis
Descriptive statistics, unadjusted, and multivariable conditional regression models for examining bike facility presence (yes/no) and bike facility type (pavement marking, signage, combination of both) as predictors of crash sites were used. Covariates included in multivariable analyses were chosen based on a combination of evidence from existing literature and significant variables (p < 0.05) in unadjusted analyses. Conditional multivariable logistic regression models were used because they were appropriate for matched data and the dichotomous outcome of case site versus control site. We examined separate independent variables: bicycle facility present and bicycle facility type. The main exposure in the first model was any type of bicycle facility present versus no bicycle facility (reference group). In the second model, the facility type categories included pavement markings (bicycle lanes and shared lane arrows), bicycle-specific signage, a combination of those two, and no facility (reference group). All analyses were performed using SAS 9.2 software (SAS Institute Inc., 2002-2008).
3. Results
3.1. Distribution of characteristics by case and control status (Table 1)
Table 1.
Characteristics of case and control intersections, Iowa, 2007-2010
| Intersection | ||||||
|---|---|---|---|---|---|---|
|
| ||||||
| Variable | Total (N=294) | Case (N=147) | Control (N=147) | |||
| On-road bike facilities present at intersection | N | % | N | % | N | % |
| None | 255 | 86.7 | 130 | 88.4 | 125 | 85.0 |
| At least one | 39 | 13.3 | 17 | 11.6 | 22 | 15.0 |
| Bicycle Lane | 18 | 6.1 | 7 | 4.8 | 11 | 7.5 |
| Bicycle-specific signage | 11 | 3.7 | 6 | 4.1 | 5 | 3.4 |
| Multiple Facilities (e.g., bike lane & signage) | 7 | 2.4 | 2 | 1.4 | 5 | 3.4 |
| Shared Lane Arrows | 3 | 1.0 | 2 | 1.4 | 1 | 0.7 |
| Sidewalks, index street a | ||||||
| Full | 206 | 70.1 | 108 | 73.5 | 98 | 66.7 |
| No | 47 | 16.0 | 19 | 12.9 | 28 | 19.1 |
| Partial | 41 | 14.0 | 20 | 13.6 | 21 | 14.3 |
| Sidewalks, non-index street b | ||||||
| Full | 215 | 73.1 | 111 | 75.5 | 104 | 70.8 |
| No | 49 | 16.7 | 23 | 15.7 | 26 | 17.7 |
| Partial | 30 | 10.2 | 13 | 8.8 | 17 | 11.6 |
| Traffic controls present, index street a | ||||||
| Yes (light, stop sign, yield sign, or combination) | 226 | 76.9 | 115 | 78.2 | 111 | 75.5 |
| No | 68 | 23.1 | 32 | 21.8 | 36 | 24.5 |
| Traffic controls present, non-index street b | ||||||
| Yes (light, stop sign, yield sign, or combination) | 188 | 64.0 | 101 | 68.7 | 87 | 59.2 |
| No | 106 | 36.1 | 46 | 31.3 | 60 | 40.8 |
| N | SD | N | SD | N | SD | |
| Bicycle volume (Avg # in 30 min obs period) | 3.4 | 4.9 | 3.5 | 4.9 | 3.3 | 5.0 |
| Motor vehicle volume (Avg # in 30 min obs period) | 228 | 285 | 249 | 300 | 206 | 270 |
| Curb to curb width, index streeta (Avg Feet) | 45.7 | 19.3 | 48.0 | 20.7 | 43.4 | 17.5 |
| One lane width, index streeta (Avg Feet) | 14.7 | 4.4 | 14.8 | 4.9 | 14.5 | 3.9 |
| Speed Limit, index streeta (Avg) | 28.0 | 5.3 | 28.0 | 5.0 | 28.1 | 5.5 |
| Speed limit, non-index streetb (Avg) | 28.8 | 5.4 | 28.7 | 5.2 | 28.8 | 5.5 |
| Number of lanes, index streeta (Avg) | 1.4 | 0.6 | 1.4 | 0.7 | 1.4 | 0.6 |
| Number of lanes, non-index streetb (Avg) | 1.3 | 0.6 | 1.2 | 0.6 | 1.3 | 0.6 |
Avg=average; obs=observation
Index street = street motor vehicle was traveling on when crash occurred
Non-index street = street motor vehicle was not traveling on when crash occurred
Bicycle lanes were the most common facility (6%), followed by bicycle-specific signage (4%), multiple facilities (2%), and then shared lane arrows (1%). Control sites had more on-road facilities (N=22, 15%), overall, than cases (N=17, 12%). Control sites had more bicycle lanes (7%) and more multiple facilities (pavement markings and signage; 3%) compared to case sites (5% and 1%, respectively). Three of 17 total intersections with bike lanes had both bike lanes and bicycle-specific signage (e.g., Share the Road sign). Case intersections had higher motor vehicle volume (248.77 vs. 205.76 per 30min) than controls.
3.2. Unadjusted predictors of crash sites (Table 2)
Table 2.
Unadjusted conditional logistic regression models predicting bicycle crashes at intersections, Iowa, 2007-2010, N=294.
| Predictor of bicycle crash | Unadjusted OR | 95% CI |
|---|---|---|
| On-road bicycle facility present (ref=none) | 0.58 | 0.23-1.48 |
| On-road bicycle facility type (ref=none) | ||
| Pavement markings (bicycle lane or shared lane arrows) | 0.42 | 0.10-1.80 |
| Bicycle-specific signage | 1.14 | 0.30-4.33 |
| Pavement markings & signage | 0.20 | 0.02-1.93 |
| Sidewalks, index streeta,b (ref=none) | ||
| Full | 2.53 | 1.01-6.35 |
| Partial | 1.78 | 0.71-4.44 |
| Sidewalks, non-index streetc,d (ref=none) | ||
| Full | 1.57 | 0.62-3.95 |
| Partial | 1.03 | 0.38-2.79 |
| Traffic controls present, index streeta (ref=no) | 1.36 | 0.63-2.97 |
| Traffic controls present, non-index streetb (ref=no) | 2.75 | 1.22-6.18 |
| Bicycle volume (per 5) | 1.09 | 0.76-1.56 |
| Motor vehicle volume (per 5) | 1.04 | 1.01-1.07 |
| Curb to curb width (per 10ft) | 1.48 | 1.15-1.91 |
| Speed limit, index streeta (per 5mph) | 0.94 | 0.60-1.48 |
| Speed limit, non-index streetb (per 5mph) | 0.89 | 0.49-1.63 |
Ref=reference
Index street= street motor vehicle was traveling on when crash occurred
Cochran-Armitage trend test p=0.13
Non-index street = street motor vehicle was not traveling on when crash occurred
Cochran-Armitage trend test p=0.48
Intersections with a bicycle facility present were 42% less likely to be a crash site than a control site (95% CI =0.23-1.48). Compared to no bicycle facility, pavement markings were 58% less likely (95% CI = 0.10-1.80) and the combination of pavement markings and signage were 80% less likely (95% CI = 0.02-1.93) to be a crash site. However, these results were not statistically significant.
Sidewalks present on both sides of the index street significantly increased crash risk 2.53 times (95% CI 1.01-6.35) compared to streets with no sidewalks. Streets with partial sidewalks also suggested increased risk compared to no sidewalks, but this was not statistically significant (OR 1.78, 95% CI=0.71-4.44). These effects were in the same direction for non-index street sidewalks, but not significant. There were not significant trends for index and non-index sidewalks (Cochrane-Armitage trend tests, p=0.13 and p=0.48, respectively). Presence of traffic controls on the non-index street increased odds of being a crash site 2.75 times (95%CI=1.22-6.18) compared to uncontrolled streets. Speed limit, traffic controls on the index street, and bicycle volume were not significant in unadjusted analyses.
Higher motor vehicle volumes and curb-to-curb width of the index street were associated with higher crash risk. For each 10 feet increase in curb-to-curb width, the odds of being a crash site increased 1.48 times (95% CI = 1.15-1.91). For every five motor vehicles during a 30-minute period, the odds of being a crash site increased 1.04 times (95% CI=1.01-1.07).
3.3. Multivariable predictors of crash-sites (Table 3)
Table 3.
Predictors of bicycle crashes, multivariable conditional logistic regression, Iowa, 2007-2010, N=294.
| Model 1a | Model 2b | |||
|---|---|---|---|---|
|
| ||||
| Characteristic | Any Facility | Facility Type | ||
|
| ||||
| Adjusted OR | 95% CI | Adjusted OR | 95% CI | |
| On-road bicycle facility present (ref=none) | 0.48 | 0.18-1.36 | ||
| On-road bicycle facility type (ref=none) | ||||
| Pavement markings (bicycle lane or shared lane arrows) | 0.40 | 0.09-1.82 | ||
| Bicycle-specific signage | 0.62 | 0.15-2.58 | ||
| Pavement markings & signage | 0.36 | 0.03-4.32 | ||
| Sidewalks, index street (ref=none) c | ||||
| Full | 2.60 | 0.95-7.10 | 2.65 | 0.96-7.29 |
| Partial | 1.66 | 0.61-4.49 | 1.66 | 0.61-4.54 |
| Traffic controls present, non-index street (ref=no) d | 1.97 | 0.80-4.84 | 1.91 | 0.77-4.73 |
| Bicycle volume (per 5 bicycles) | 1.10 | 0.73-1.66 | 1.10 | 0.73-1.67 |
| Motor vehicle volume (per 10 vehicles) | 1.02 | 0.99-1.05 | 1.02 | 0.99-1.05 |
| Curb-to-curb width, index street (per 10 feet) c | 1.38 | 1.06-1.79 | 1.37 | 1.05-1.79 |
Ref=reference
Model 1 includes: on-road bicycle facility present, sidewalks, traffic controls, bicycle volume, motor vehicle volume, and curb-to-curb width. Likelihood ratio test: Model 1 vs. Univariate model (χ2=23.42, df=6, p<0.001)
Model 2 includes: on-road bicycle facility type, sidewalks, traffic controls, bicycle volume, motor vehicle volume, and curb-to-curb width. Likelihood ratio test: Model 2 vs. Univariate model (χ2=21.46, df=6, p=0.002)
Index street = street motor vehicle was traveling on when crash occurred
Non-index street = street motor vehicle was not traveling on when crash occurred
We built two multivariable models: Model 1 predicted the impact of any type of on-road bicycle facility on crash risk. Model 2 predicted the impact of the different types of on-road bicycle facilities (pavement markings, signage, or a combination of both) on crash risk.
Model 1 suggested the presence of any type of on-road bicycle facility can decrease odds of a crash by as much as 52% (95% CI=0.18-1.36). Curb-to-curb width was the only covariate that remained significant, showing a 38% increased risk (95%CI=1.06-1.79) of a crash with every 10 feet increase in width.
Model 2 suggested all three categories of bicycle facilities were protective, including bicycle-specific signage, which was not significant in unadjusted analyses. The combination of pavement markings and signage was the most protective (OR=0.36, 95%CI=0.03-4.32), followed by pavement markings (OR=0.40, 95% CI=0.09-1.82), and then bicycle-signage (OR=0.62, 95% CI=0.15-2.58). As in Model 1, the only covariate that remained significant in this model was curb-to-curb width, which showed a 37% increased risk (95% CI: 1.05-1.79) of a crash with every 10 feet increase in index street width.
4. Discussion
We used a novel study method, incorporating retrospective crash data with current traffic counts, to examine the impact of on-road bicycle facilities in Iowa. Our findings suggest that bicycle facilities are protective against crashes, especially pavement markings (bicycle lanes or shared lane arrows). Although our main findings were not statistically significant, all effects were in our hypothesized direction.
Our findings are also consistent with much of the bicycle safety literature, which has shown protective effects of bicycle lanes, although many of the studies have relied on self-reported survey data. For example, a survey of 2,978 cyclists found that the odds of a crash decreased by 40% if riding in a bike path or lane compared to a regular roadway (Rodgers, 1997). Another study in Davis, California found that bike lanes can reduce crashes by 53%, although this study was conducted over 35 years ago (Lott and Lott, 1976). Our study results provide updated evidence regarding bicycle lanes and allowed for comparison between pavement markings, signage, and combinations of those, which was lacking in the literature.
Studies on shared lane arrows are very recent because this intervention was not recommended in the Manual on Uniform Traffic Control Devices (MUTCD) until 2009, prior to which they were considered experimental and very rare; they have been increasingly incorporated since 2009 (Federal Highway Administration, 2009) . A report from the Federal Highway Administration investigated the impact of shared lane arrows in Massachusetts, North Carolina, and Washington and found that the presence of shared lane arrows increased the amount of space motorists gave to the bicyclist, helped to position the bicyclists in the safest part of the road, and reduced sidewalk riding (Hunter et al., 2010). Similar results regarding shared lane arrows were found in Austin, Texas (Brady et al., 2011) and San Francisco, California (Alta Planning, 2004). All of these factors are likely to contribute to reduced crashes, but to the best of our knowledge this was the first study to examine effects on crash risk.
Another recent study evaluated a three-foot passing law in Baltimore, Maryland, and found that cars did not violate the three-foot zone when the bicyclist was riding in a bicycle lane, but violations occurred in 17% of the observations with standard lanes and 23% with shared lane arrows (Love et al., 2012). We were not able to separately evaluate bicycle lanes and shared lane arrows due to very small numbers of shared lane arrows in our sample, so we cannot address further their shared lane arrow finding. However, the consistency between the findings on bicycle lanes and pavement markings suggests that bicycle lanes have protective properties in reducing collisions between motor vehicles and bicyclists (Love et al., 2012).
Beyond bicycle-specific facilities, we also found that the greater the curb-to curb-width of the index street (roadway motor vehicle was traveling on) the greater the crash risk. We believe this could be explained by circumstances where a bicycle and motor vehicle collided as the bicycle was crossing the index street. The wider the road, in that circumstance, the longer the bicyclist would have been exposed to opposing cars.
Our study design was based on a pedestrian-motor vehicle crash study by Koepsell et al. (2002) in Washington and California. One of the main strengths of this design is the combination of existing crash data with current traffic counts to examine crash risk. Bicycle research is difficult to conduct because traffic volume counts are generally not readily available and, historically, many bicycle studies have failed to control for volume. Additionally, the case site-control site design is useful for studying bicycle crashes because these crashes are rare relative to the number of motor vehicle crashes. This design also has major cost and time savings compared to other approaches, such as prospective cohort studies.
Schepers et al. (2011) used a similar study design in the Netherlands to study BMV crashes at unsignalized intersections, by using existing police crash reports combined with current traffic volume counts. However, their traffic counts were based on 20-minute counts, off-peak hours and non-school vacation periods, which were then extrapolated to make estimates of counts. Both our study and Koepsell et al. (2002) used 30-minute observation periods for traffic counts, which corresponded to the same day of week and time of day as the index crash. Our study also differs significantly from the Schepers et al. (2011) for several reasons: their setting was European (the Netherlands) where there are different facility types (e.g., raised cycle tracks separated from the motorist road), they focused on specific features of the bicycle facilities (e.g., red color and visibility), and they stratified by two crash types (bicyclist right of way and motorist right of way). Their facility variables were too different to compare to our findings because they were either different facility types or they were examining specific features of facilities. We were able to compare traffic volumes and found our results were consistent with their findings of an increase in crash risk, for both crash types, as the number of both cyclists (OR range 1.6-1.8) and motorists (OR range 1.6-2.0) increased. However, several studies in the literature have suggested a “safety in numbers” protective effect when a critical mass of bicycles is reached that is not found with motor vehicles (Elvik, 2009).
Our study had a limited sample size based on the small budget, and thus had limited power that resulted in wider confidence intervals. When the power was originally calculated, we anticipated a higher prevalence of bicycle facilities. We were also unable to compare bicycle lanes and shared lane arrows because of the low prevalence of shared lane arrows, in particular. Bicycle crashes were identified from police crash report data, which may underestimate the actual number of roadway BMV crashes because not all such crashes are reported. Crashes that led to injury or significant property damage are more likely to be reported, and thus these findings may generalize better to bicycle crashes that led to injury (61% of these crashes indicated an injury and 35% indicated possible injury). Finally, our traffic counts are proxies for the traffic volume at the time the index crash occurred. Although we collected these data on the same day of week and same time of day as the index crash, we cannot determine how accurate these are in comparison to the actual traffic volumes at times of crashes.
5. Conclusions
Our results suggest that on-road bicycle facilities, especially in the form of bicycle lanes and shared lane arrows, are protective against BMV crashes. More research is needed to further compare facility types, examine specific features of facility types, and determine which configurations work best in given areas (e.g., rural versus urban). Although results from this study cannot stand alone in support of bicycle facilities, evidence from this study combined with the body of existing evidence indicate that bicycle facilities appear to reduce crash risk with no apparent harm is introduced. There may be sufficient evidence to move forward in implementing these practices now, while continuing to work toward developing recommendations for optimal configuration and features of bicycle facilities.
Supplementary Material
Acknowledgments
The authors would like to thank Diane Hamann, Brian Abbott, Ron Bedford, Jake Krzystowczyk, Andrea King, Jen Braun, and Travis Kleinschmidt for data collection assistance. We would also like to thank Drs. Charles Lynch, James Torner, Paul Hanley, and Marizen Ramirez for their valuable feedback and guidance throughout this project.
This research was funded by the University of Iowa Injury Prevention Research Center, the Iowa Department of Transportation, and pilot project research and occupational injury prevention fellowship training grants from the Heartland Center for Occupational Health and Safety at the University of Iowa.
Contributor Information
Cara Hamann, Injury Prevention Research Center, University of Iowa, 2186 WL, Iowa City, IA 52242.
Corinne Peek-Asa, University of Iowa, College of Public Health, Department of Occupational and Environmental Health, S160 CPHB, 105 River St, Iowa City, IA 52242.
References
- Alta Planning, 2004. San Francisco’s Shared Lane Pavement Markings: Improving Bicycle Safety. (Accessed 8/15/2012) http://www.sfmta.com/cms/uploadedfiles/dpt/bike/Bike_Plan/Shared%20Lane%20Marking%20Full%20Report-052404.pdf
- Aytur SA, Satinsky SB, Evenson KR, Rodriguez DA, 2011. Pedestrian and Bicycle Planning in Rural Communities Tools for Active Living. Fam Community Health 34 (2), 173–181. [DOI] [PubMed] [Google Scholar]
- Brady J, Loskorn J, Mills A, Duthie J, Machemehl RB, 2011. Effects of Shared Lane Markings on Bicyclist and Motorist Behavior. Ite Journal-Institute of Transportation Engineers 81 (8), 33–38. [Google Scholar]
- Elvik R, 2009. The non-linearity of risk and the promotion of environmentally sustainable transport. Accident Analysis and Prevention 41 (4), 849–855. [DOI] [PubMed] [Google Scholar]
- ESRI, 2011. ArcGIS Desktop Release 10. Environmental Systems Research Institute, Redlands, CA. [Google Scholar]
- Evenson KR, Aytur SA, Satinsky SB, Kerr ZY, Rodriguez DA, 2011. Planning for Pedestrians and Bicyclists: Results From a Statewide Municipal Survey. Journal of Physical Activity & Health 8, S275–S284. [DOI] [PubMed] [Google Scholar]
- Federal Highway Administration, 2006. Federal Highway Administration University Course on Bicycle and Pedestrian Transportation. Publication No. FHWA-HRT-05-133. (Accessed 12/13/2009) http://www.tfhrc.gov/safety/pedbike/pubs/05085/pdf/combinedlo.pdf
- Federal Highway Administration, 2009. Manual on Uniform Traffic Control Devices. (Accessed 9/6/12) http://mutcd.fhwa.dot.gov/index.htm
- Hunter WW, Thomas L, Srinivasan R, Martell CA, 2010. Evaluation of Shared Lane Markings. Washington, DC. [Google Scholar]
- Insurance Institute for Highway Safety, 2012. Fatality Facts 2010: Bicycles. (Accessed 8/15/2012) http://www.iihs.org/research/fatality.aspx?topicName=Bicycles&year=2010
- Iowa Department of Transportation, 2012. Driver services: Accident reports. (Accessed 11/2/2012) http://www.iowadot.gov/mvd/ods/accidents.htm
- Koepsell T, McCloskey L, Wolf M, Moudon AV, Buchner D, Kraus J, Patterson M, 2002. Crosswalk markings and the risk of pedestrian-motor vehicle collisions in older pedestrians. Jama 288 (17), 2136–43. [DOI] [PubMed] [Google Scholar]
- Lott DF, Lott DY, 1976. Effect of Bike Lanes on Ten Classes of Bicycle-Automobile Accidents in Davis, California. Journal of Safety Research 8, 171–179. [Google Scholar]
- Love DC, Breaud A, Burns S, Margulies J, Romano M, Lawrence R, 2012. Is the three-foot bicycle passing law working in Baltimore, Maryland? Accid Anal Prev 48, 451–6. [DOI] [PubMed] [Google Scholar]
- Moritz WE, 1997. Survey of North American bicycle commuters: Design and aggregate results. Transportation Research Record (1578). [Google Scholar]
- National Complete Streets Coalition, 2010. Fundamentals. (Accessed April 11, 2011) http://www.completestreets.org/complete-streets-fundamentals/
- National Highway Traffic Safety Administration, 2009. The Crash Outcome Data Evaluation System (CODES) and Applications to Improve Traffic Safety Decision-Making [Google Scholar]
- Parker KM, Gustat J, Rice JC, 2011. Installation of bicycle lanes and increased ridership in an urban, mixed-income setting in New Orleans, Louisiana. J Phys Act Health 8 Suppl 1, S98–S102. [DOI] [PubMed] [Google Scholar]
- Pucher J, Dijkstra L, 2000. Making walking and cycling safer: Lessons from Europe. Transportation Quarterly 54 (3), 25–50. [Google Scholar]
- Reynolds CC, Harris MA, Teschke K, Cripton PA, Winters M, 2009. The impact of transportation infrastructure on bicycling injuries and crashes: a review of the literature. Environ Health 8 (1), 47. [DOI] [PMC free article] [PubMed] [Google Scholar]
- Rodgers GB, 1997. Factors associated with the crash risk of adult bicyclists. J Safety Res 28 (4), 233–241. [Google Scholar]
- SAS Institute Inc., 2002-2008. Version 9.2. SAS Institute Inc., Cary, NC. [Google Scholar]
- Schepers JP, Kroeze PA, Sweers W, Wust JC, 2011. Road factors and bicycle-motor vehicle crashes at unsignalized priority intersections. Accident Analysis and Prevention 43 (3), 853–861. [DOI] [PubMed] [Google Scholar]
- Walker I, 2007. Drivers overtaking bicyclists: objective data on the effects of riding position, helmet use, vehicle type and apparent gender. Accid Anal Prev 39 (2), 417–25. [DOI] [PubMed] [Google Scholar]
Associated Data
This section collects any data citations, data availability statements, or supplementary materials included in this article.