Abstract
In most animals, the majority of the nervous system is generated and assembled into neuronal circuits during embryonic development 1. However, during juvenile stages, nervous systems still undergo extensive anatomical and functional changes to eventually form a fully mature nervous system by the adult stage 2,3. The molecular changes in post-mitotic neurons across post-embryonic development and the genetic programs that control these temporal transitions are not well understood 4,5. Using the model system C. elegans, we comprehensively characterized the distinct functional states (locomotor behavior) and corresponding distinct molecular states (transcriptome) of the post-mitotic nervous system across temporal transitions during postembryonic development. We observed pervasive, neuron type-specific changes in gene expression, many of which are controlled by the developmental upregulation of the conserved heterochronic miRNA lin-4 and the subsequent promotion of a mature neuronal transcriptional program through the repression of its target, the transcription factor lin-14. The functional relevance of these molecular transitions are exemplified by a temporally regulated target gene of the lin-14 transcription factor, nlp-45, a neuropeptide-encoding gene, which we find to be required for several distinct temporal transitions in exploratory activity during postembryonic development. Our study provides new insights into regulatory strategies that control neuron-type specific gene batteries to modulate distinct behavioral states across temporal, sexual and environmental dimensions of post-embryonic development.
In most non-metamorphosing invertebrates and vertebrates, including mammals, the majority of neurons of the adult nervous system are born and differentiate during embryogenesis, forming a functional, yet immature nervous system by the time of birth/hatch 1. During postembryonic stages of life, juvenile nervous systems undergo substantial maturation events that have mostly been characterized on the anatomical and electrophysiological level 2,3. However, there have been few systematic efforts to characterize the molecular changes within post-mitotic neurons during postembryonic development 4,5. It also remains unclear whether post-embryonic, post-mitotic maturation of neurons is mostly a reflection of neuronal activity changes 6,7 or whether there are activity-independent genetic programs that mediate these temporal transitions. Earlier acting genetic programs that control the specification of the temporal identity of dividing neuroblasts have been characterized in both vertebrates and Drosophila 8–11. However, genetic programs that may specify temporal transitions in post-mitotic neurons during post-embryonic development have remained more elusive.
At hatching, the juvenile nervous system of the nematode C. elegans contains the vast majority of its adult set of neurons (97 out of 118 hermaphrodite neuron classes), most of which are fully differentiated and wired into a functional nervous system 12. To systematically characterize potential changes in nervous system function during post-embryonic neuronal development, we profiled locomotor behavior across all four larval and the adult stage of the hermaphrodite using an automated, high resolution worm tracking system 13. We observed pervasive changes across throughout all four larval stages into adulthood (Fig. 1a, Supplementary Table 1). For example, animals at the second larval (L2) stage exhibited increased pausing and dwelling behavior compared to animals at the first larval (L1) stage while adult animals exhibited increased forward motion and decreased backward motion compared to animals at the last larval stage (L4).
Figure 1: Temporal transitions in locomotor behavior and neuronal transcriptome.
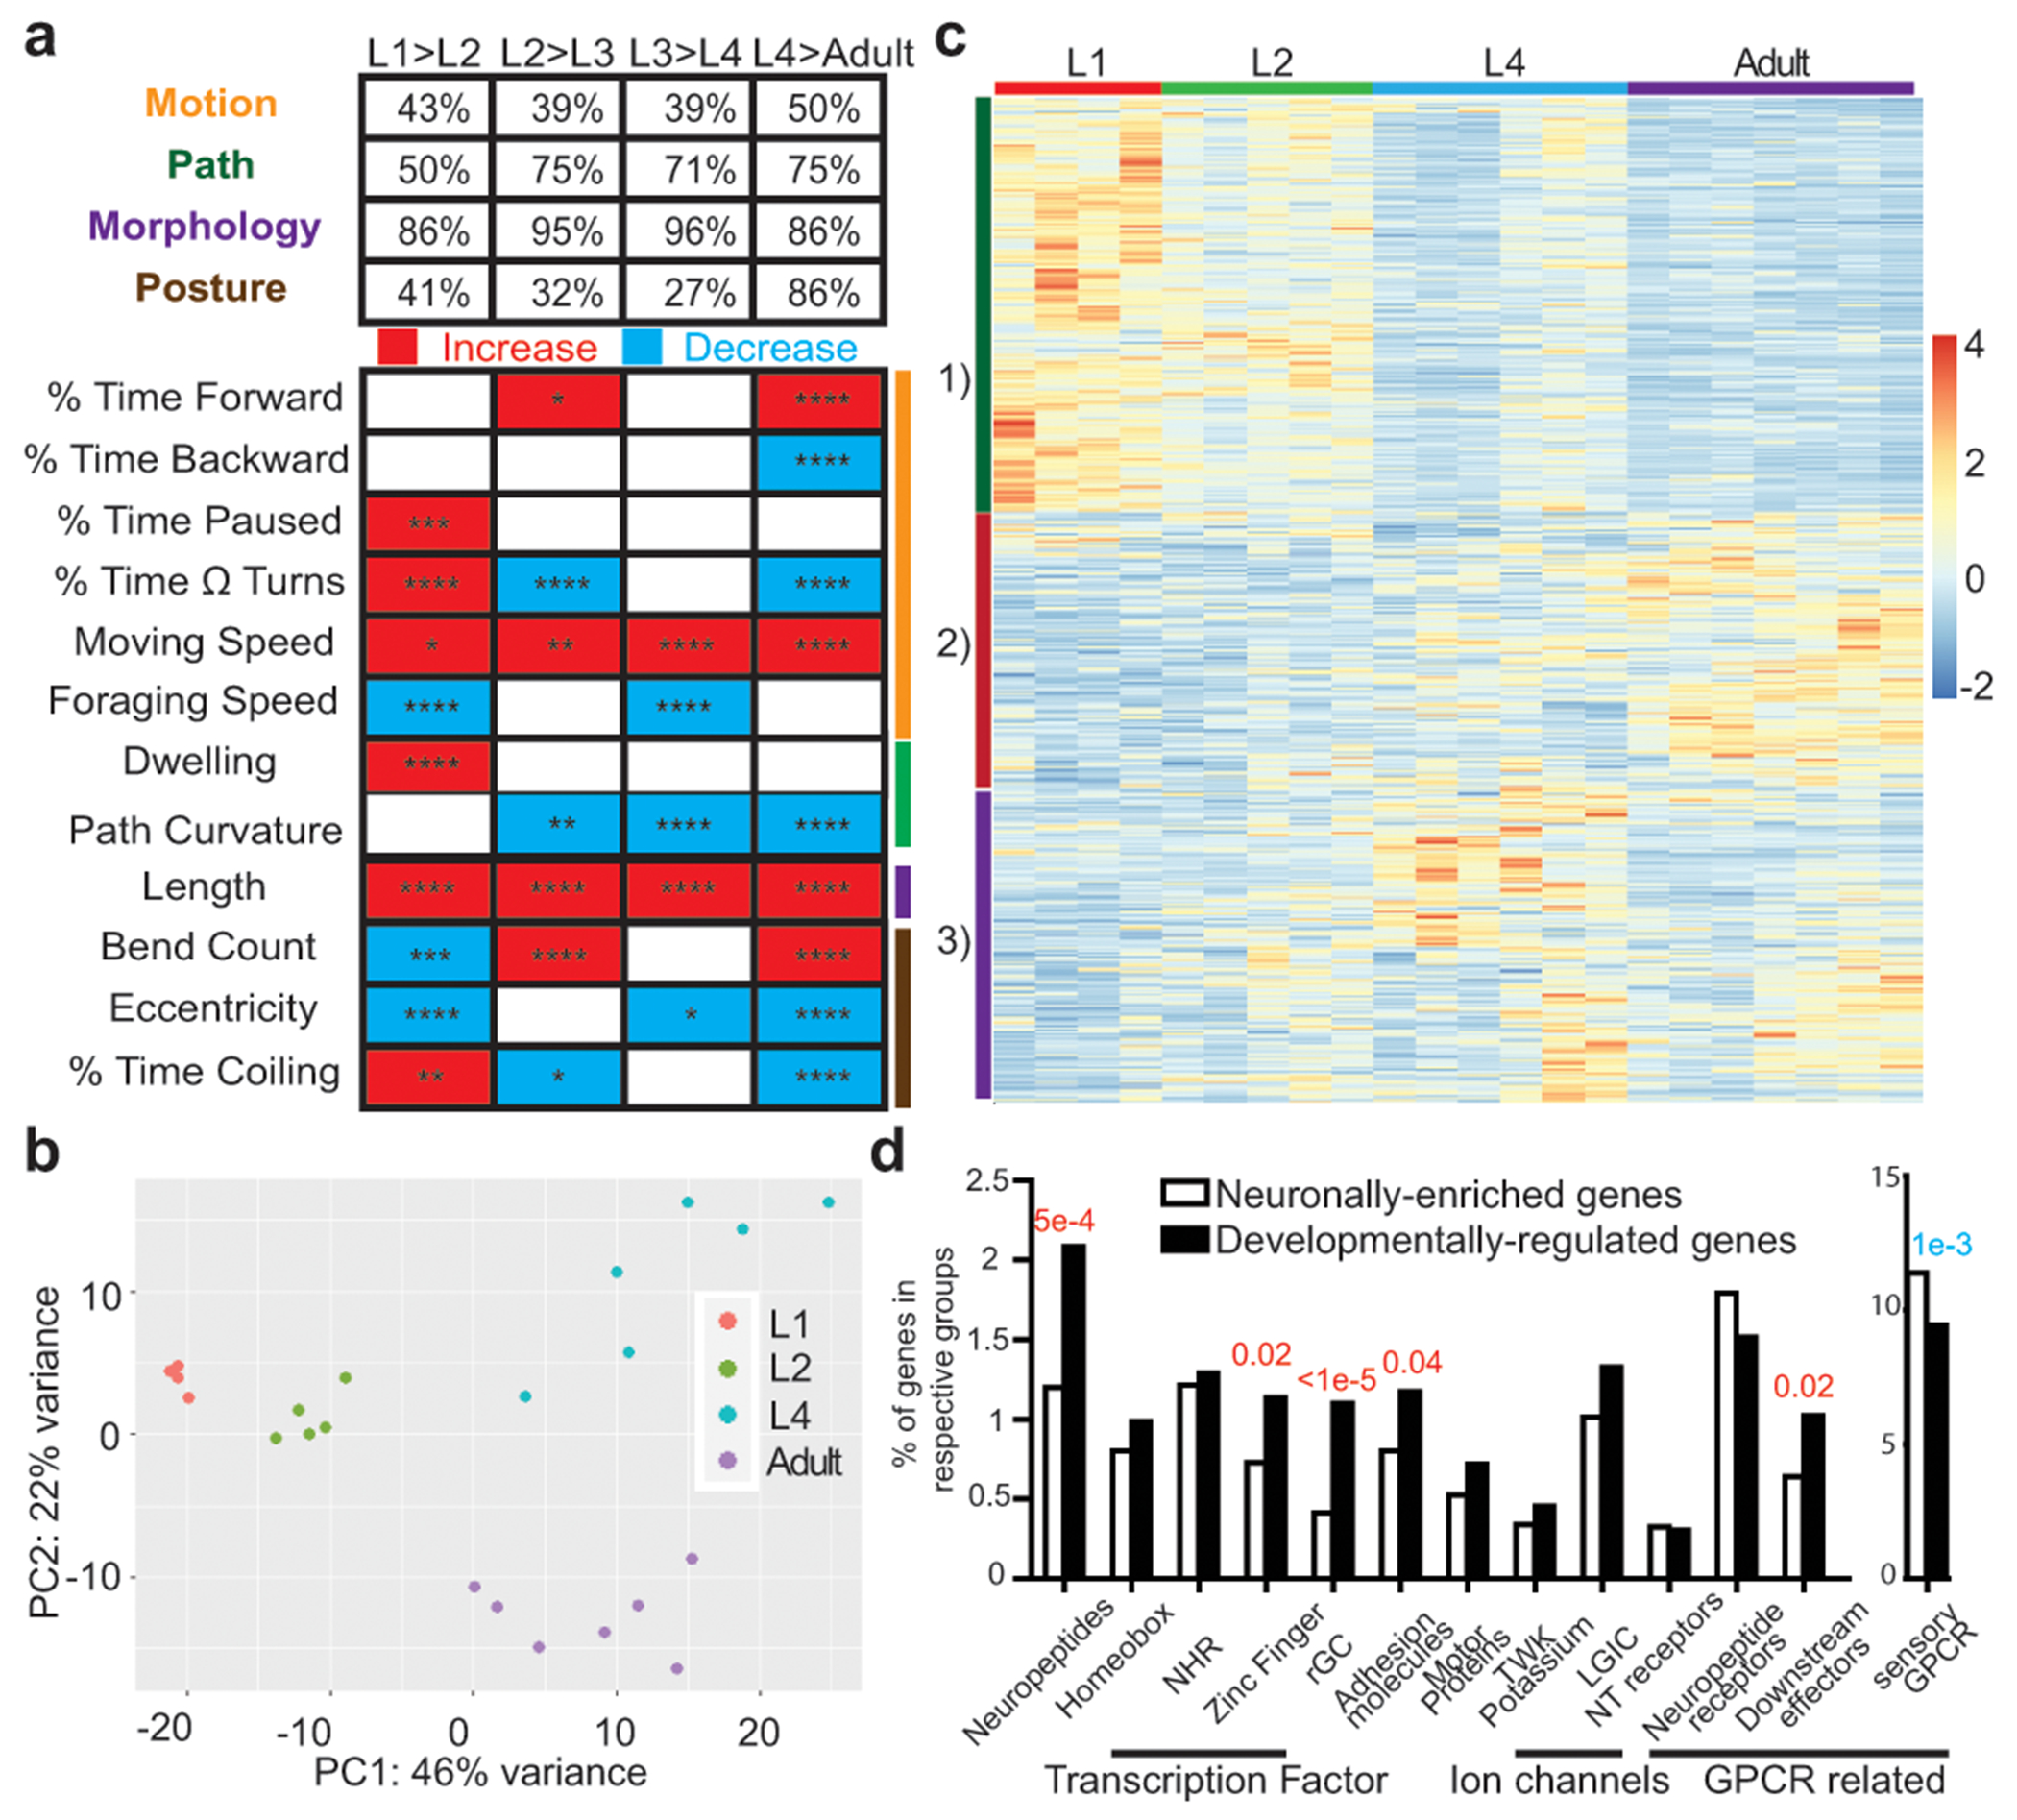
a, Developmental transition in locomotor behavior across post-embryonic life stages, as measured by automated single worm tracking 13. Upper panel: percentage of parameters in each of the 4 broad categories that are different across each transition (q<0.05). Bottom panel: representative parameters from each category, as indicated by color-coded lines on the right, across development. Red and blue rectangles: increases and decreases in each parameter, respectively. Sample size: L1,47; L2,48; L3,41; L4,129; Adult,107. Wilcoxon rank-sum tests and false-discovery rate q values for each comparison are presented in each rectangle: *q<0.05; **q<0.01, ***q<0.001, ****q<0.0001. Additional details available in Supplementary Table 1. b, Principal component analysis (DESeq2) of neuronal transcriptome across post-embryonic development. Each dot represents a RNA-seq analysis replicate. c, Heatmap of the 2639 developmentally regulated genes (padj<0.01) across post-embryonic life stages. Values were z-score normalized and plotted using pheatmap in R studio. Each row, clustered according to pattern, represents a single gene, and each column represents a single RNA-seq replicate. d, Enrichment/depletion of gene families in the 2639 developmentally regulated genes compared to all 7974 neuronal enriched genes (one-sided z-score test for two population proportions), with red and blue p-values indicating over-representation and under-representation, respectively.
Distinct behavioral states across post-embryonic life stages, as well as the recently described synaptic wiring changes across post-embryonic development 12, suggest the existence temporal transitions in molecular states. We profiled the transcriptome of the entire nervous system using INTACT technology 14 during all post-embryonic stages and identified 7974 neuronally-enriched genes with temporal changes (Extended Data Fig.1a, Supplementary Table 2,3). Principal-component analysis revealed that the neuronal transcriptome of each developmental stage clustered together and was distinct from the other stages (Fig. 1b,c, Extended Data Fig.1b–d, Supplementary Discussion). Gene ontology analysis of the developmentally regulated genes revealed an expected enrichment in nervous system-associated genes (Extended Data Fig.1e–j, Supplementary Table 4,5). Specific gene families were overrepresented amongst the developmentally regulated genes, including neuropeptides, receptor-type guanylyl cyclases (rGC), zinc-finger transcription factors and cell adhesion molecules which may drive the recently reported changes in synaptic wiring occurring during postembryonic development 12 (Fig. 1d).
Due to the panneuronal nature of our profiling, increases or decreases in gene expression could entail binary on/off switches in individual neuron types and/or relative changes in levels of expression in the same set of neurons. Using gene expression reporters that detect changes with single neuron resolution (many of them endogenous reporter alleles engineered with CRISPR/Cas9 technology), we found ample evidence for both scenarios and near perfect validation of our RNA-seq dataset (Extended Data Fig.2–4, Supplementary Table 6). For example, expression of the glutamate receptor gbb-2 decreased in all expressing cells throughout larval development (Extended Data Fig.2a), while expression of the innexin inx-19 was progressively lost from specific neuron types throughout larval stages (Extended Data Fig.2b). Moreover, we detected uniform changes of broadly expressed genes (i.e. mab-10, Extended Data Fig.2c) and, on the opposite end of the spectrum, changes of very restrictively expressed genes with up- or down-regulation in small subset of neurons or even a single neuron class (e.g. ins-6, Extended Data Fig.3c). Additional validations of neuron type-specific changes that recapitulate all major patterns of developmental regulation are documented in Extended Data Fig.2–4 and Supplementary Table 6. Changes were observed in neurons of all major types.
To investigate the regulation of these temporal transitions, we considered the heterochronic pathway, a cascade of microRNAs, RNA-binding proteins, and transcription factors initially discovered for their regulation of temporal developmental progression in mitotic ectodermal lineages and reproductive system 15–18. Upregulation of the conserved microRNA lin-4 at the L1 to L2 transition, promotes later stage cellular identities and suppresses early (L1/juvenile) identities, via 3’UTR-mediated downregulation of its direct target, the transcription factor LIN-14 17,18 (Fig. 2a). Using fosmid based reporter gene and/or CRISPR/Cas9-engineered reporter alleles we validated the expression dynamics of lin-4 and lin-14 in the context of the nervous system (Extended Data Fig.5).
Figure 2: lin-4/lin-14 control temporal transitions in exploratory behavior and neuronal transcriptome.
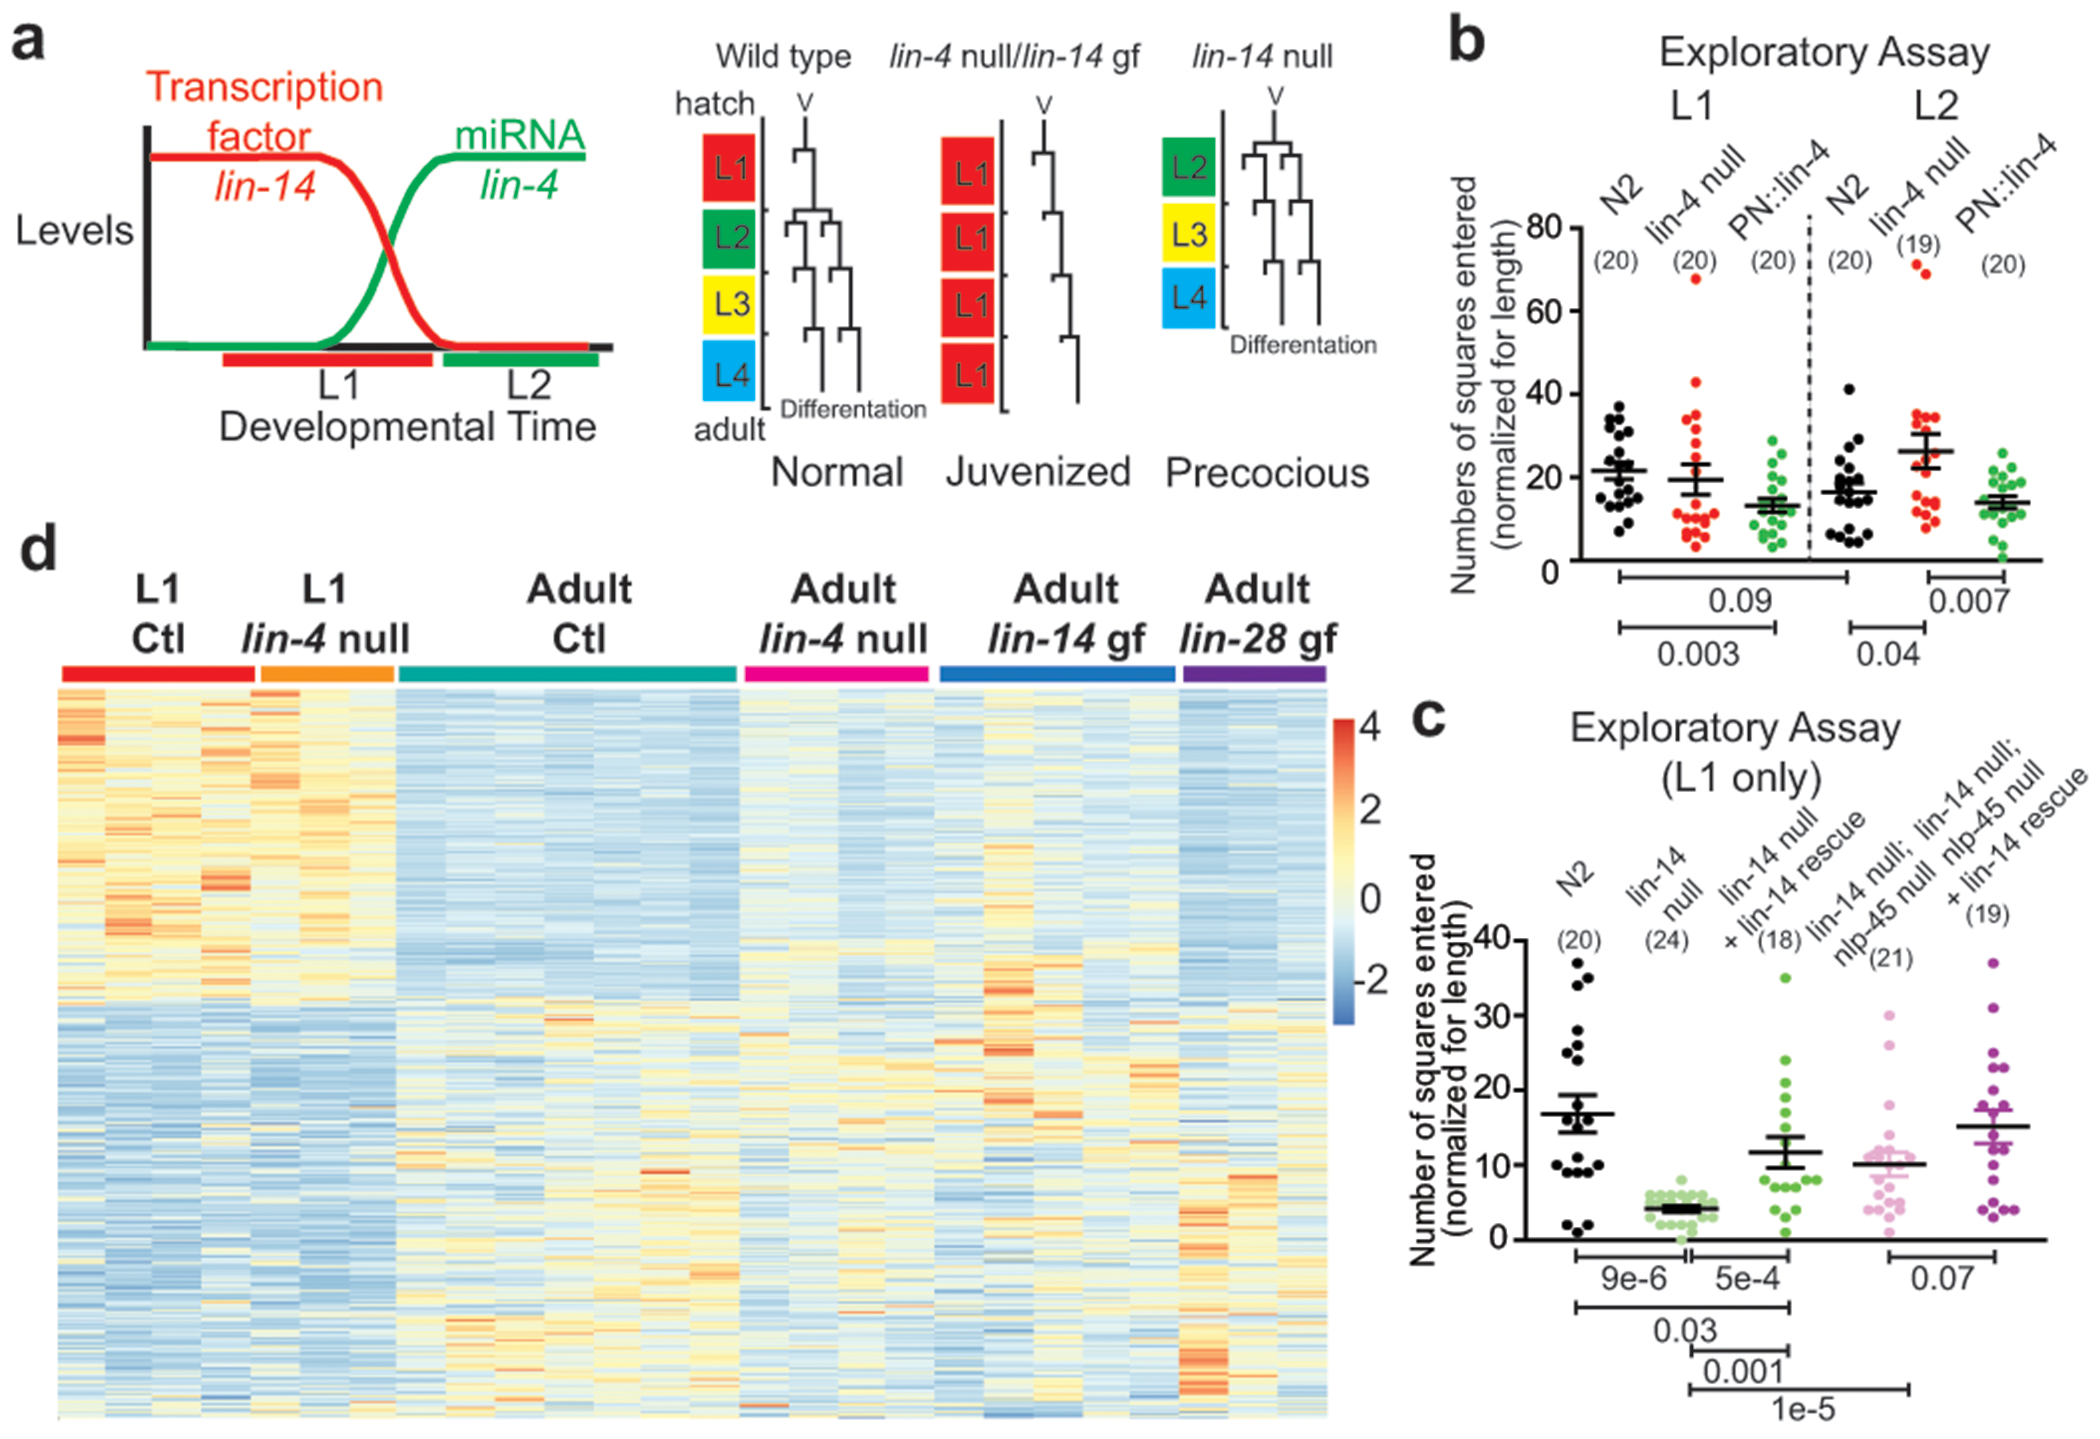
a, Schematized lin-14 and lin-4 expression and function in the context of epithelial/hypodermal lineages, revealing reiterated juvenized lineage patterns in lin-4 null/lin-14 gain of function(gf) mutants and precocious patterns in lin-14 null mutants. b, Neuronal lin-4 regulates the “maturation” of exploratory behavior during L1->L2 transition. Exploratory behavior is measured as in Extended Data Fig.10a. PN::lin-4 represents panneuronal lin-4 over-expression. c, lin-14(ma135) null mutants exhibit “precocious” exploratory behavior through regulation of nlp-45. Exploratory behavior is measured as in b. For b/c, the mean +/− SEM and n (in bracket) are shown for each condition, and each point of the scatter dot plot represents a single animal. post hoc two-sided t-test p values are shown below. d, lin-4(e912) null mutation juvenizes a subset of the adult control(Ctl) neuronal transcriptome to resemble that of the L1 Ctl neuronal transcriptome through direct de-repression of lin-14. See Extended Data Fig.5b, 6a–e, 9, Supplementary Discussion. Values displayed as in Fig. 1c.
Consistent with the notion that lin-14 promotes a juvenile state of neuronal function that is suppressed by lin-4 in later stages, we find that behavioral transitions in exploratory activity were partially juvenized (decreased dwelling/increased exploration) in lin-4 mutants and that forced neuronal expression of lin-4 at the L1 stage caused a precocious decrease in exploratory behavior (Fig. 2b). Moreover, lin-14(ma135) null animals significantly reduced their exploratory behavior, and this effect was rescued by re-supplying lin-14 (Fig. 2c).
To assess the effect of lin-4 and lin-14 on molecular transitions in the neuronal transcriptome, we again used INTACT and observed a juvenization of a subset of the neuronal transcriptome in adult lin-4 mutant adults (Fig. 2d, Extended Data Fig.6a–d, Supplementary Table 7, Supplementary Discussion). An engineered lin-14 gain of function allele that is unresponsive to lin-4 (Extended Data Fig.5b) largely recapitulated the juvenizing effect of the lin-4 null mutation (Fig. 2d, Extended Data Fig.6a–d), demonstrating that lin-4 acts through lin-14 to affect the neuronal transcriptome. The lack of developmental regulation of other subsets of genes by lin-4 and lin-14 mutations (Extended Data Fig.7) suggested that there must be additional mechanisms beyond lin-4 and lin-14 triggered heterochronic pathway that regulate the temporal transition of the nervous system across development.
To further investigate the role of lin-14 in the maturation of neuronal transcriptome, we identified genomic sites of direct LIN-14 binding in L1 and L2 animals using ChIP-seq (Extended Data Fig.8a, Supplementary Table 8, 9, Supplementary Discussion). Motif analysis identified YGGAR as a consensus binding sequence for LIN-14 (Extended Data Fig.8b). Amalgamating different methods of differential binding analysis resulted in 3466 neuronally-enriched genes that showed decreased LIN-14 binding within 3kb of the TSS across the L1->L2 transition (Extended Data Fig.8c, Supplementary Table 10–11). This overlapped with 60% of lin-4/lin-14 controlled developmentally upregulated genes (where LIN-14 acts as a repressor) and 49% of lin-4/lin-14 controlled developmentally downregulated genes (where LIN-14 acts as an activator) (Extended Data Fig.8c–e).
To explore the impact of lin-4 and lin-14 on neuron-specific gene expression patterns with single neuron resolution, we examined four neuropeptide-encoding genes (using CRISPR/Cas9-engineered reporter alleles) and one rGC-encoding gene, whose developmental regulation were predicted by our transcriptome and ChIP-seq data to be controlled by lin-4 and lin-14 (Fig. 3a, Extended Data Fig.9, Supplementary Table 12). Our focus on neuropeptides was motivated by the over-representation of neuropeptides in our developmentally regulated gene battery (Fig. 1d, Extended Data Fig.3) and by their well-known function as modulators of transitions between discrete behavioral states 19,20. We observed highly neuron type-specific effects of lin-4/lin-14 on the expression of the analyzed genes (Fig. 3a, Extended Data Fig.9, Supplementary Table 12). For example, at hatching, the gfp-tagged neuropeptide nlp-45 was primarily expressed in the RIA interneuron but expression was turned on in additional sets of neurons at subsequent development stage transitions (Fig. 3a, Extended Data Fig.3b). In the lin-4 null mutant, we observed a “juvenized” pattern of nlp-45 expression as predicted by our transcriptome profiling experiment: expression remained largely restricted to the RIA interneuron throughout development (Fig. 3a). Similarly, in the lin-14(ot1087) gain of function mutant, we observed a recapitulation of the juvenized expression pattern as observed in the lin-4 null mutant (Fig. 3a). Conversely, in the lin-14(ma135) null mutant, cells that typically expressed nlp-45 at later stages showed expression at the L1 stage (Fig. 3a).
Figure 3: lin-4/lin-14 controls developmental changes in exploratory behavior through regulation of nlp-45.
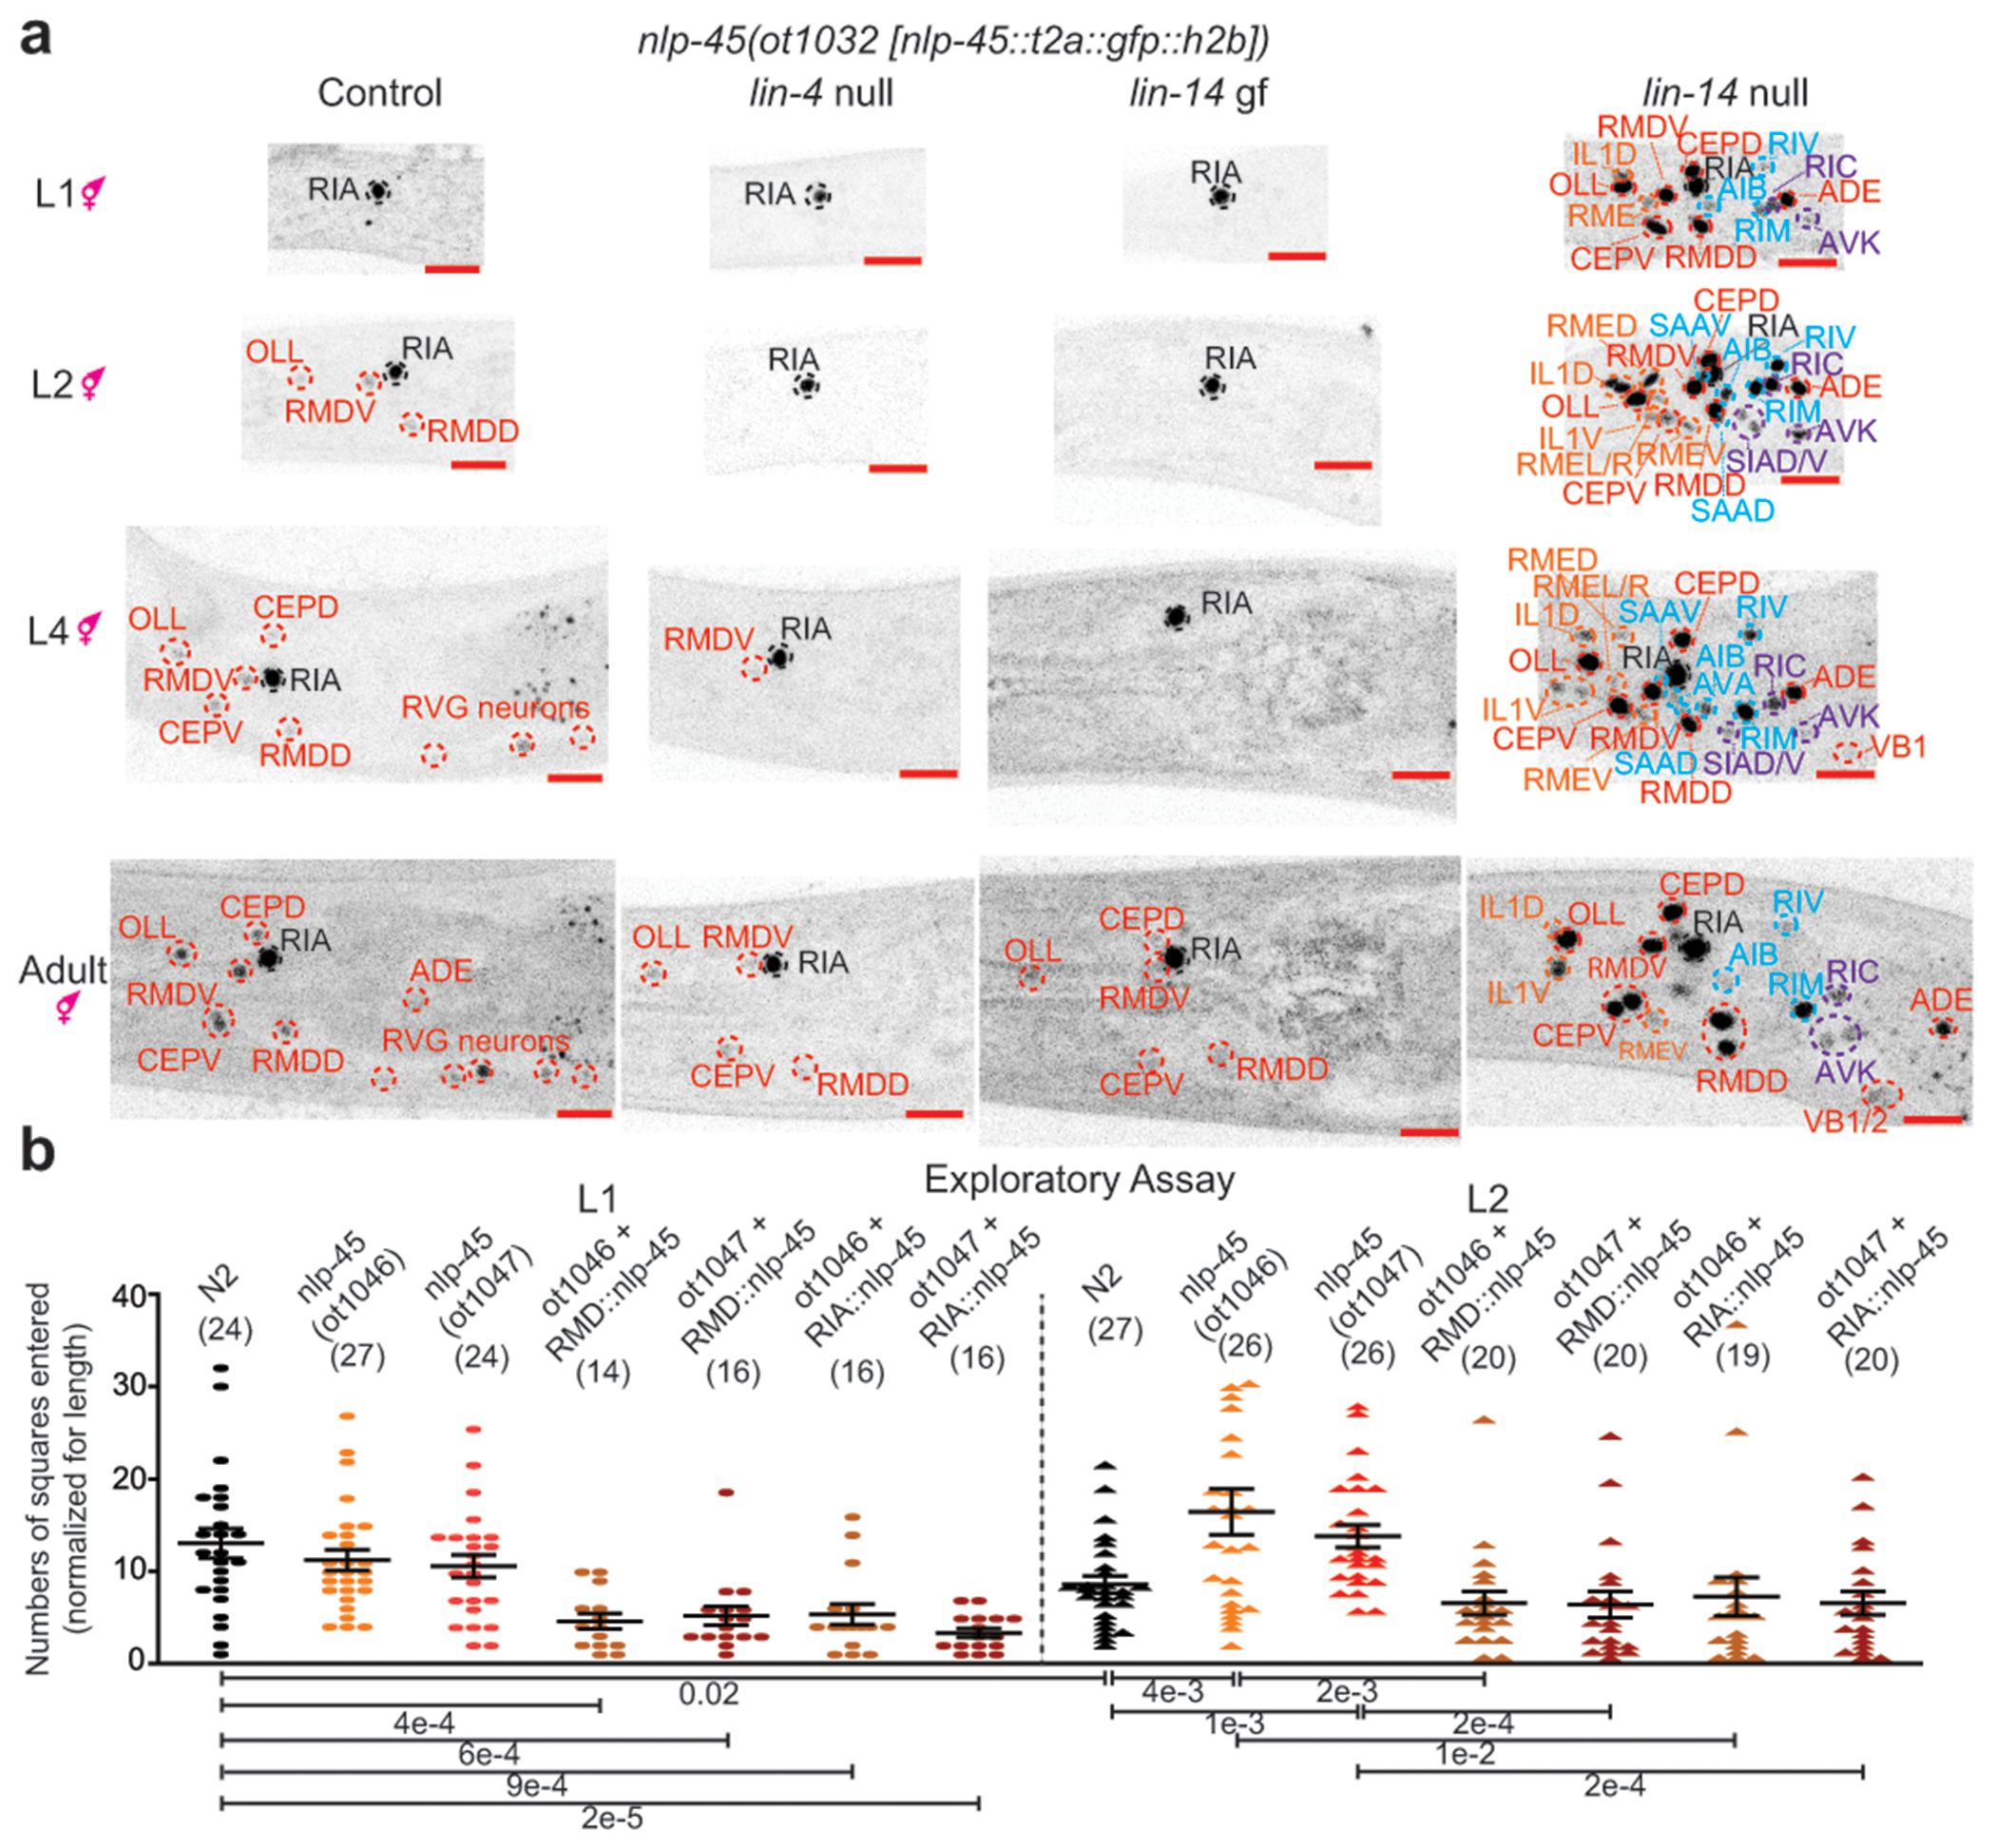
a, nlp-45 expression is juvenized in lin-4(e912) null and lin-14(ot1150) gain of function(gf) animals while more widespread nlp-45 expression is observed in the lin-14(ma135) null mutants, where neurons that typically expresses nlp-45 in later larval/adult hermaphrodite stage (labelled in red), in adult males (labelled in blue), and in dauer animals (labelled in orange) show expression at the L1 stage. Additional neurons that never show expression in any conditions tested (labelled in purple) also show nlp-45 expression in lin-14(ma135) null animals. Red scale bars (bottom right) = 10μm.
b, nlp-45 exerts temporally specific effects on exploratory behavior. Allele and assay details in Extended Data Fig.10a. Exploratory behavior, is measured as the number of squares entered normalized by the length of the animal. The mean +/− SEM and n (in bracket) are shown for each condition, and each point of the scatter dot plot represents a single animal. post hoc two-sided t-test p-values are shown below.
Other neuropeptides, as well as the rGC gcy-12, revealed lin-4/lin-14-dependent temporal dynamics of these genes in other individual neuron types (Extended Data Fig.9b–e, Supplementary Table 12). LIN-14 can act as a repressor on the same gene in some neuronal subtypes and as an activator in another neuronal subtype (Extended Data Fig.9c), as revealed by gfp-tagged neuropeptide flp-14. Differential recruitment of additional cofactors may dictate the transcriptional readout of LIN-14 activity.
We used neuropeptide nlp-45 as a paradigm to link temporally controlled gene expression changes to changes in animal behavior. One of the more dramatic transitions in nlp-45 expression in hermaphrodites was the transition between L1 and later larval stages, when expression broadened from RIA to additional sets of neurons (Fig. 3a, Extended Data Fig.3b). One of the locomotor behavioral parameters modulated during this temporal transition was the increased dwelling behavior of L2 stage animals compared to L1 stage animals (Fig. 1a, 2b, Extended Data Fig.10a,b, Supplementary Table 1). Two different engineered deletion alleles of nlp-45 resulted in a stage specific increase in exploratory behavior only observed for L2, and not L1, animals (Fig. 3b, Extended Data Fig.10a). Transgenic expression of nlp-45 in either the RMDD/V or RIA neurons reversed the increased exploratory behavior of L2 nlp-45 mutants to that of L2 control (N2) animals (Fig. 3b). The ectopic/overexpression of nlp-45 in either the RMDD/V or RIA neurons in L1 stage animals (where normally only RIA expresses nlp-45) further reduced exploratory behavior below that of L1 controls (Fig. 3b). Consistent with nlp-45 being a critical effector of the heterochronic pathway, the decreased exploratory behavior in lin-14(ma135) null mutant was partially suppressed in a nlp-45 mutant background (Fig. 2c). Altogether, these data suggest that nlp-45 functions as an anti-exploratory neuropeptide regulated by the heterochronic pathway during the L1 to L2 developmental transition (Extended Data Fig.10c).
We examined two other notable transitions in C. elegans post-embryonic development with reported changes in exploratory behavior. One is the increased exploration drive of adult males but not adult hermaphrodites for mate searching over food, observed upon sexual maturation and mediated by the PDF-1 neuropeptide 21,22. Consistent with an involvement of nlp-45, there are striking sexual dimorphisms in nlp-45 expression. In adult males, nlp-45 was activated in 5 classes of neurons in the head (SAAD/V, AVA, RIV, AIB, RIM), most RVG and most VNC motor neurons, as well as a number of tail neurons (Fig. 4a). This upregulation controlled food leaving behavior since nlp-45 mutant adult males (but not juveniles males or adult hermaphrodites) left food faster/earlier compared to control adult males (Fig. 4b, Extended Data Fig.10d). Moreover, the upregulation of nlp-45 in adult males served as a counterbalancing anti-exploratory signal to the increased exploration drive mediated by pdf-1 (Extended Data Fig.10e–g).
Figure 4: Mechanism of nlp-45 gene expression regulation across spatial, temporal, sexual, and environment dimensions of post-embryonic development.
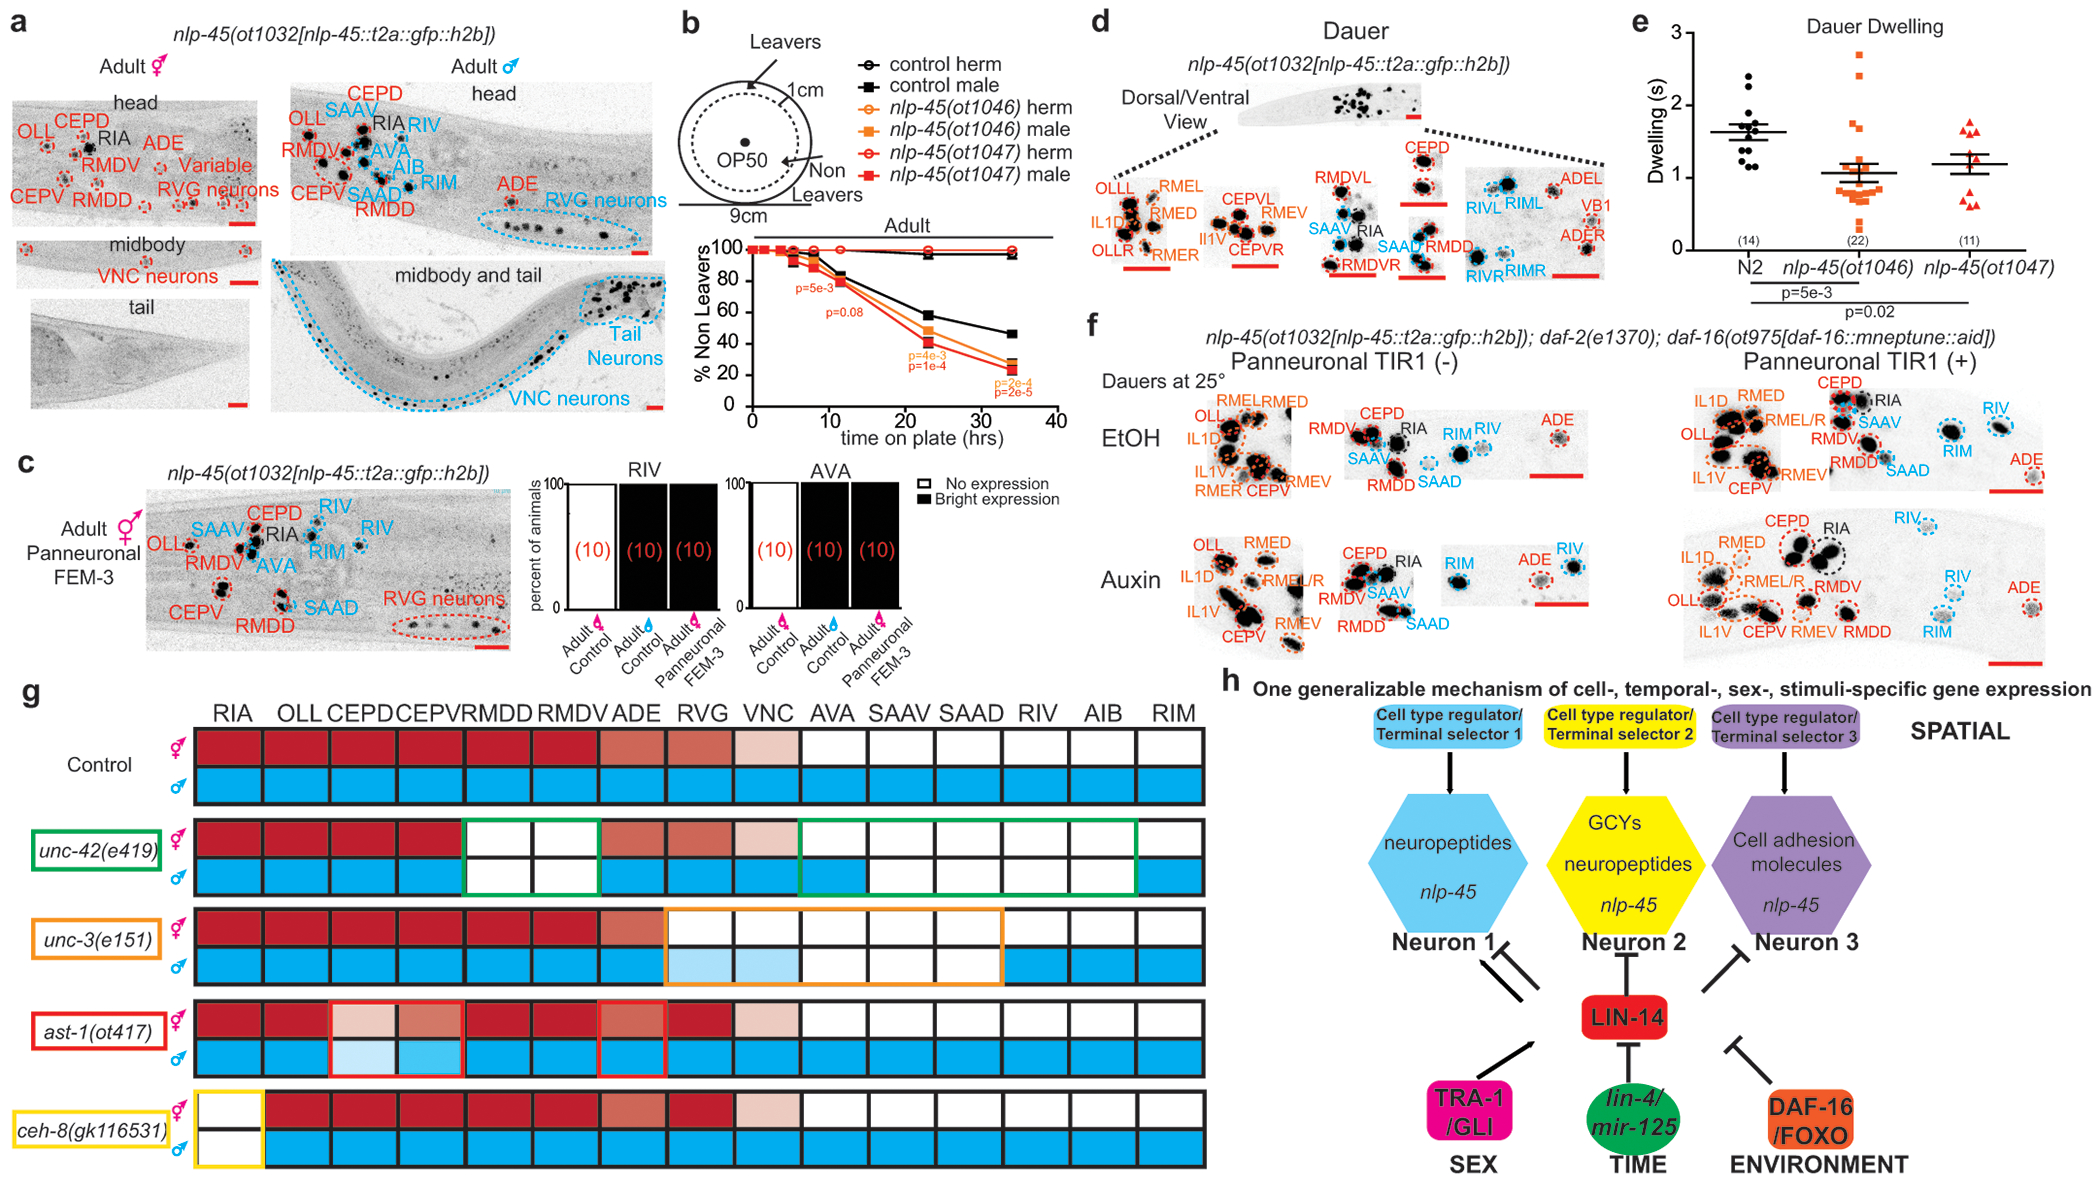
a, Sexually dimorphic expression of nlp-45 in adult hermaphrodite (red) and males (blue). b, nlp-45 deletion mutants increase the food leaving behavior of adult males but not adult hermaphrodites, as per shown leaving assay 22. Values were plotted as mean +/− SEM of three independent experiments for adult hermaphrodites and six independent experiments for adult males (n=12 animals per independent experiments). Statistical analysis (post hoc two-sided t-test) is only shown for the comparison of nlp-45 mutant adult males to control males (orange: nlp-45(ot1046) vs N2 adult males; red: nlp-45(ot1047) vs N2 adult males). c, Panneuronal depletion of sex determination master regulator TRA-1, through overexpression of FEM-3, masculinizes nlp-45 expression in adult hermaphrodite head. d, Upon entry into dauer, nlp-45 expression is observed in neurons that express nlp-45 normallly only in adult male (blue), and in additional neurons (orange). e, nlp-45 deletion mutant dauers exhibits reduced dwelling behavior compared to N2 dauers. The mean +/− SEM and n (in bracket) are shown for each condition, and each point of the scatter dot plot represents a single animal. post hoc two-sided t-test p-values are shown below. f, Panneuronal degradation of DAF-16 in auxin-treated dauers leads to a loss/reduced nlp-45 expression in several neurons. Representative images are here while quantifications are in Extended Data Fig.10o. g, nlp-45 expression patterns for the adult hermaphrodite (red) and male (blue) are shown for control and terminal selector mutant animals. Expression patterns of terminal selectors are shown as by their respective colored outlines. Dimmer red/blue colors represent dimmer and/or variable nlp-45 expression, while blank boxes represent no expression. See Extended Data Fig.11a–d for more details. h, Schematic showing temporal, sexual and environmental regulation of heterochronic regulator lin-14, in combination with cell specific terminal selectors to dictate spatiotemporal gene batteries.
Red scale bars (bottom right) = 10μm.
We noted that nlp-45 expression of the early larval lin-14(ma135) mutant hermaphrodites largely mimicked that of the wild type adult males, entailing expression in neurons that was only observed in control adult males (e.g. SAAD/V, RIV, AIB, RIM) and also stronger expression in other neuron classes (e.g. OLL, RMDD/V, CEPD/V) (Fig. 3a, 4a). This observation prompted us to ask whether the LIN-14 transcription factor is expressed in a sexually dimorphic manner. We indeed found that while LIN-14 expression was similarly downregulated in both sexes at early larval stages, expression in the L4 and particularly in the adult stage was significantly more reduced in the male nervous system compared to that of the hermaphrodite (Extended Data Fig.10h,i). Altogether, this data indicated that the LIN-14 transcription factor maintained a juvenile nlp-45 expression pattern by repressing it in specific neuron classes. The further downregulation of lin-14 in the adult male nervous system allowed for the de-repression of nlp-45 in additional neurons such as SAAD/V, RIV, AIB and RIM.
Since ChIP-seq analysis revealed binding of the hermaphrodite enriched master regulator of sexual identity, TRA-1, to cis-regulatory regions of lin-14 23, we examined the effect of TRA-1 on lin-14 expression. To this end, we eliminated TRA-1 from the nervous system through panneuronal overexpression of FEM-3, a negative regulator of TRA-1 expression, frequently used to change the sexual identity of specific cell types 24,25. We found that in these animals LIN-14 expression was significantly reduced in adult hermaphrodites and there was a consequent masculinization of nlp-45 expression (e.g. expression in SAAD/V, AVA, RIV, RIM and VNC MNs) (Fig. 4c, Extended Data Fig 10i,j). In summary, hermaphrodite enriched TRA-1 expression appears to maintain higher neuronal LIN-14 expression in adult hermaphrodites compared to adult males in order to prevent the onset of male-specific nlp-45 expression in specific neuron classes. These observations predict that other genes that are LIN-14-dependent in hermaphrodites may be expressed in a sexually dimorphic manner as well. Analyzing other reporter-tagged neuropeptide genes, we indeed find this to be the case (Extended Data Fig 10k–m, Supplementary Table 12).
Another notable example of a developmentally-controlled transition in exploratory behavior is the previously observed increased locomotor quiescence upon environmentally-induced entry into an alternative developmental stage, the diapause dauer stage 26. In dauer animals, nlp-45 gained expression in 6 classes of head neurons (Fig. 4d). We found that nlp-45 mutant dauer animals had reduced dwelling behavior compared to control dauer animals (Fig. 4e). Hence, consistent with its anti-exploratory role in early larval stage transitions and upon sexual maturation in adult males, nlp-45 upregulation in dauer animals contributes to the increased locomotor quiescence observed for this stage.
Since nlp-45 expression in lin-14(ma135) null hermaphrodites was observed in neurons that only showed nlp-45 expression at the dauer stage (e.g. RMEs, IL1s) (Fig. 3a, 4d), we considered that, similarly to the sexually dimorphic regulation of nlp-45, environmental regulation of nlp-45 expression may also converge on the regulation of transcription factor lin-14. Indeed, we found that this gain in nlp-45 expression correlated with a global downregulation in LIN-14 in the dauer animals (Extended Data Fig.10n). Moreover, through neuron-specific removal of daf-16/FoxO, the key effector of insulin signaling, we found that this dauer-specific LIN-14 downregulation was cell-autonomously controlled by insulin-signaling in the nervous system (Extended Data Fig.10n). This effect may be direct since ChIP-seq analysis revealed multiple DAF-16 in vivo binding sites in the lin-14 cis-regulatory region 27. The de-repression of lin-14 expression observed after neuronal daf-16/FoxO depletion led to the elimination/downregulation of nlp-45 expression in the 6 classes of head neurons that gained expression upon entry into dauer (Fig. 4f, Extended Data Fig.10o). The dynamics of LIN-14 expression in the dauer stage predict that other genes that are LIN-14-dependent may change their expression in the dauer stage. Analyzing other reporter-tagged neuropeptide genes, we indeed find this to be the case (Extended Data Fig.10p, q, Supplementary Table 12).
To assess how global temporal, sexual and environmental signals result in highly neuron type-specific modulation of gene (e.g. nlp-45) expression, we turned to neuron type-specific transcription factors, terminal selectors, that specify and maintain neuron type-specific batteries of terminal identity genes 28. We found that the homeobox gene unc-42/PROP1 which controls the differentiation of many nlp-45 expressing neurons in both hermaphrodite and male animals 29 is required for nlp-45 expression in all neurons where unc-42 and nlp-45 expression normally overlap (e.g. RMDD/V, RIV, SAAD/V) with the exception of AVA, where unc-42 acts redundantly with another terminal selector 29 (Fig. 4g, Extended Data Fig.11a). Similarly, unc-3/EBF, ast-1/ETV1 and ceh-8/RAX mutants affected nlp-45 expression in the cell types where these terminal selectors operate (Fig. 4g, Extended Data Fig.11b–d).
Terminal selectors and the heterochronic pathway members (i.e. lin-14) do not regulate one another (Extended Data Fig.11e–f). Additionally, nlp-45 showed precocious expression in lin-14; unc-42 double mutants, similar to the lin-14 null mutant alone, except in the neurons where unc-42 acts as a terminal selector (Extended Data Fig.11g). We conclude that terminal selectors and lin-14 act in parallel pathways, where unc-42 and other terminal selectors act permissively to promote nlp-45 expression, but temporal, sexual and dauer signals, integrated on the level of lin-14 expression, antagonize the ability of unc-42 to promote nlp-45 expression (Fig. 4h).
In conclusion, we presented here a comprehensive, nervous system-wide map of molecular changes that accompany the many behavioral transitions associated with post-embryonic nervous system maturation from juvenile to adult stages. Among the most striking changes were observed in the neuropeptidergic signaling. Honing in on one example, we demonstrated that the spatiotemporal regulation of a novel anti-exploratory neuropeptide across development resulted in consequential change in exploratory behavior across three separate temporal transitions. Consistent with work in other organsisms 20, our works strongly suggests that neuromodulatory peptides are broadly employed regulators of behavioral state transitions across development.
We characterized a genetic program that controls the temporal transitions in neuronal gene expression profiles across post-embryonic development. While studies in vertebrates have mostly focused on the role of environmental stimuli (e.g. neuronal activity) on the maturation of post-mitotic neuronal features 6,7, much less attention had been focused on identifying the genetic programs that regulated the temporal identity of post-mitotic neurons, akin to those that have been characterized for the temporal identities of dividing neuroblasts 8–11. We described here how an internal clock, the heterochronic gene pathway, composed of several phylogenetically conserved gene regulatory factors, regulates the temporal transitions in the expression of many but not all developmentally-regulated genes in a highly cell type-specific manner throughout the nervous system, in apparent collaboration with neuron-type specific terminal selectors of neuronal identity (see also Supplementary Discussion). The observation that the sex determination pathway (through the global sex regulator TRA-1) and environmentally responsive insulin pathway (through DAF-16/FoxO) regulate LIN-14 expression demonstrate that LIN-14 acts as a key hub to integrate the three different axes of time, sex and environment. “Static” genes are initiated and maintained by neuron identity-determining terminal selector transcription factors alone, while genes dynamically regulated by time, sex or environment, depend on both, the resident terminal selector of a neuron, as well as LIN-14 (Fig. 4h), which either promotes or antagonizes the ability of terminal selectors to activate such target genes.
METHODS
C. elegans strains and handling.
Worms were grown at 20°C on nematode growth media (NGM) plates seeded with E. coli (OP50) bacteria as a food source unless otherwise mentioned. Worms were maintained according to standard protocol. Wild-type strain used is Bristol variety, strain N2. A complete list of strains and transgenes used in this study is listed in Supplementary Table 13. Whenever synchronization of developmental stages was necessary, animals were egg prepped according to standard protocol and synchronized at the L1 stage. They were then plated on food and collected after 8 +/−1 hrs, 21 +/−1 hrs, 30 +/− 2hr, 40 +/− 2hrs, and 53 +/− 2hrs for L1, L2, L3, L4, and adult stages, respectively for either molecular or behavioral analysis. These time points were chosen such that the animals were in the middle of each larval stage or relatively early in adulthood for the analysis. Dauer animals were obtained using standard crowding, starvation and high temperature conditions.
Constructs cloning and stain generation
UPN INTACT.
To generate the UPN::INTACT tag (npp-9::mcherry::3xflag), a concatenated panneuronal promoter 30, containing promoter fragments from unc-11, rgef-1, ehs-1, and ric-19, and the INTACT tag 14 were cloned together using Gibson assembly. The construct was injected (5ng/μl with 100ng/μl digested OP50 DNA) and the resulting extrachromosomal array strain was integrated into the genome using standard UV irradiation methods. This was followed by 6 rounds of backcrossing to N2 to generate otIs790.
Fosmid recombineering.
To generate the lin-4 fosmid reporter, standard fosmid recombineering protocol was used as described previously 31. Briefly, a 90bp lin-4 primary miRNA was replaced with nls::yfp::h2b in fosmid WRM0613aD08. The recombineered fosmid was injected (15ng/μl with 100ng/μl digested OP50 DNA), and the resulting extrachromosomal array strain was integrated into the genome using standard UV irradiation methods. This was followed by 2 rounds of backcrossing to N2 to generate otIs763.
Genome engineering (CRISPR-Cas9).
lin-14(ot1087/1149/1150/1151), lin-28(ot1153/1154/1155), nlp-45(ot1032[nlp-45::t2a::gfp::h2b), nlp-45(ot1046), nlp-45(ot1047) were generated using Cas9 protein, tracrRNA, and crRNAs from IDT, as previously described 32. For lin-14(ot1087/1149/1150/1151), two crRNAs (gttcctgagagcaatttttg and caaaactcacaaccaactca) and a single strand oligodeoxynucleotide (ssODN) donor (ttgctttttcctgcactcactttacctttgtctcactttttcttacttctgtatcacaaaaatgattata) was used to ensure a precise 466bp deletion in the lin-14 3’UTR to remove all seven lin-4 binding site. For lin-28(ot1153/1154/1155), one crRNA (cctgagagtgcaatttgagg) and a ssODN donor (cccctctaaaccatactaccacctacctcctcaaacttttttttttcaaatagaactgattgcacctgtt) were used to ensure a precise 18bp deletion in the lin-28 3’UTR to remove the single lin-4 binding site. For, nlp-45(ot1032[nlp-45::t2a::gfp::h2b), two crRNAs (aagcatctggactgccgatg and tgacttgaacaggaagcatc) and an asymmetric double stranded t2a::gfp::h2b, PCRed from pBALU43, were used to insert the fluorescent tag at the C terminal. For nlp-45(ot1046) and nlp-45 (ot1047), two crRNAs (acttgcgttaaccacaatga and tgacttgaacaggaagcatc) were used and random deletions were screened to obtain nlp-45(ot1046) and nlp-45 (ot1047). These deletions were 43 and 239 bps within the first exon, respectively, and both resulted in frameshift mutations and premature stops. Neither mutation resulted in the production of the predicted mature peptide (Extended Data Fig.10a). npr-17(ot1101) was generated using a standard method as previously described to insert C-terminal fused gfp 33. ins-6(syb2685), ins-9 (syb2616), nlp-50(syb2704), nlp-13(syb3411), flp-26(syb3588), flp-28(syb3207), flp-14(syb3323) were generated by SUNY Biotech. To facilitate the neuronal ID of the secreted neuropeptide expression reporters, a nuclear localized GFP was inserted behind the neuropeptide coding sequences, separated by a T2A sequence that splits the two proteins 34.
Single copy insertion by MiniMos.
The concatenated panneuronal promoter (UPN) and a 338bp fragment containing the lin-4 miRNA were fused together and cloned into pCFJ910 using Gibson Assembly. The plasmid was injected to obtain single copy insertion of UPN::lin-4 as previously described 35.
Cell specific nlp-45 overexpression.
mgl-1 promoter 36 and glr-3 promoter 37 were PCRed from genomic DNA for neuron specific expression in RMDD/V and RIA neurons respectively. nlp-45 cDNA was obtained from Dharmacon. The promoter fragments and the nlp-45 cDNA were fused together with sl2::2xnls::tagrfp::p10 3’utr by Gibson assembly. The constructs were injected at 50ng/μl and extrachromosomal array lines were selected according to standard protocol.
All other strains.
The inx-19 fosmid (otIs773) was obtained through integration of a previously published extrachromosomal array strain 38. The gcy-12 promoter fusion GFP reporter was obtained through integration of an existing extrachromosomal array strain, DA1266. All other strains were previously published, and/or obtained from CGC and/or crosses with these strains as detailed in Supplementary Table 13.
Neuron identification
For neuronal cell identification, colocalization with the NeuroPAL landmark strain (otIs669 or otIs696) was used to determine the identity of all neuronal expression as previously described 30. Examples of how this was done are shown in Supplementary Fig.1. All images using NeuroPAL to ID are deposited to the Zenodo database.
Behavioral analysis
Automated Worm tracking.
Automated single worm tracking was performed using the Wormtracker 2.0 system at room temperature 13. Animals at all stages were recorded for 5 mins each except for dauers, which were recorded for 10 mins to ensure adequate sampling of locomotor features due to increased quiescence. All animals were tracked on NGM plates uniformly covered with food (OP50), except for dauer animals, which were tracked on non-coated plates. Analysis of the tracking videos was performed as previously described 13.
Exploratory Assay.
To measure exploration behavior, an adapted exploratory assay from a previous study 39 was used to increase sensitivity for younger/smaller animals. Individual animals at the respective developmental stages and genotypes were picked to a 5 cm agar plate uniformly seeded with E. coli strain OP50. After 90 min, plates were superimposed on a grid containing 1 mm squares, and the number of squares entered by the worm tracks were manually counted. The number of squares explored is adjusted for the length of the animal, to compensate for the different size of animals at different developmental stages/genotypes. Transgenic and mutant strains were always compared to control animals assayed in parallel. All plates were scored by an investigator blind to the genotype of the animals.
Food leaving Assay.
The food leaving (also known as mate-searching) assay was performed as previously described 22. A single drop (18μl) of OP50 was seeded the day before and allowed to grow. The following day, a single animal of the respective developmental stage, sex and genotype was placed in the center of a 9 cm agar plate, and each animal that had left the food was scored blindly at 8 time points for a period of up to 55 hrs. A worm was considered a leaver if it was 1 cm from the edge of the plate.
Microscopy
Worms were anesthetized using 100mM of sodium azide and mounted on 5% agarose on glass slides. All images were acquired using a Zeiss confocal microscope (LSM880). Image reconstructions was performed using Zen software tools. Maximum intensity projections of representative images were shown. Fluorescence intensity was quantified using the Zen software. Figures were prepared using Adobe Photoshop and Illustrator.
INTACT for purification of affinity-tagged neuronal nuclei
UPN::INTACT control worms (otIs790) as well as mutants were grown on large plates (150mm) with enriched peptone media coated with NA22 bacteria to allow for the growth of large quantities of worms: 100,000 worms can grow from synchronized L1 stage to gravid adults on a single plate. Animals were collected at the respective stage as described above. lin-4(e912) and lin-14(ot1149) animals were slower in their developmental progression compared to controls 40, and adult lin-4(e912) and lin-14(ot1149) animals were collected ~ 57+/− 2 hrs (4 hrs after the control and lin-28(ot1154) adult animals were collected). ~600,000 animals were collected for each L1/L2 replicate, while ~200,000 animals were collected for each L4/adult replicate. At the time of collection, animals were washed off the plate with M9, washed 3x with M9, lightly fixed with cold RNAse-free DMF for 2 minutes before washing with 1xPBS 3x.
Modifications were made from the previous INTACT protocol 14 to optimize pulldown of neuronal nuclei. All steps following were done in cold rooms (4°C) to minimize RNA and protein tag degradation. The animals were homogenized mechanically using disposable tissue grinders (Fisher) in 1x hypotonic buffer (1x HB: 10mM Tris pH 7.5, 10mM NaCl, 10mM KCl, 2mM EDTA, 0.5mM EGTA, 0.5mM Spermidine, 0.2mM Spermine, 0.2mM DTT, 0.1% Triton X-100, 1x protease inhibitor). After each round of mechanical grinding (60 turns of the grinder), the grinder was washed with 1mL 1x HB and the entire homogenate was centrifuged at 100xg for 3 min. The supernatant was collected for later nuclei extraction and the pellet was put under mechanical grinding and centrifugation for 4 additional rounds. The supernatant collected from each round were pooled, dounced in a glass dounce, and gently passed through an 18-gauge needle 20x to further break down small clumps of cells. The supernatant was then centrifuged at 100xg for 10 min to further remove debris and large clumps of cells. Nuclei was isolated from the supernatant using Optiprep (Sigma): supernatant after centrifugation was collected in a 50mL tube, added with nuclei purification buffer (1x NPB: 10mM Tris pH 7.5, 40mM NaCl, 90mM KCl, 2mM EDTA, 0.5mM EGTA, 0.5mM Spermidine, 0.2mM Spermine, 0.2mM DTT, 0.1% Triton X-100, 1x protease inhibitor) to 20mL, and layered on top of 5mL of 100% Optiprep and 10mL of 40% Optiprep. The layered solution was centrifuged at 5000xg for 10 min in a swinging bucket centrifuge at 4°C. The nuclei fraction was collected at the 40/100% Optiprep interface. After removal of the top and bottom layers, leaving a small volume containing the nuclei, the process was repeated 2 additional times. After final collection of the crude nuclei fraction, the volume was added to 4mL with 1xNPB and precleared with 10μl of Protein-G Dynabeads and 10 μl of M270 Carboxylated beads for 30min to 1hr (Invitrogen). The precleared nuclei extract was then removed, and 50 μl was taken out as input samples (total nuclei). The rest was incubated with 30μl of Protein G Dynabeads and 3 μl of anti-FLAG M2 antibody (Sigma) overnight to immunoprecipitate (IP) the neuronal nuclei. The following day, the IPed neuronal nuclei/beads was washed 6-8 times with 1xNPB for 10-15 min each time. The resulting IPed neuronal nuclei/beads were resuspended in 50 ul 1xNPB and a small aliquot was used to check with DAPI staining to quality-check the procedure for the following: 1) sufficient quantities of nuclei was immunoprecipitated; 2) nuclei are intact and not broken; 3) the majority of bound nuclei are single, mCherry-labelled neuronal nuclei and minimal nuclei clumps and large tissue chunks were immunoprecipitated. Anything not satisfying these quality checks were not used for downstream processing. The resulting input and neuronal IP samples were used for isolation of total RNA using Nucleospin RNA XS kit according to manufacturer’s protocol (Takara).
RNA-seq and data analysis
RNA-seq libraries were prepared using the Universal RNA-seq kit (Tecan) according to manufacturer’s protocol. The libraries were sequenced on Illumina NextSeq 500 machines with 75bp single-end reads. After initial quality check, the reads were mapped to WS220 using the Subread package 41, and assigned to genes using featurecounts. Neuronal enrichment was conducted by comparing neuronal IP samples to their respective input samples using DESeq2, with batch effect taken into account for the analysis 42. 7974 genes were found to be neuronally-enriched (Supplementary Table 2). We took the read counts of these 7974 genes for all IP samples across development, normalized for library size, and conducted all developmental and mutant analysis using DESeq2. We found that this approach minimized contamination artifacts resulting from the protocol and led to the best biological validation.
ChIP-seq and analysis
The C-terminally GFP tagged lin-14 (lin14(cc2841[lin-14::gfp]) and N2 strains were used for the ChIP. ~600,000 animals were collected for each L1/L2 replicate and fixed with 2% formaldehyde for 15 minutes at room temperature (RT). ChIP assay was performed as previously described with the following modifications 43. After fixation, worms were resuspended in FA buffer supplemented with protease inhibitors (150 mM NaCl, 10 μl 0.1 M PMSF, 100 μl 10% SDS, 500 μl 20% N-Lauroyl sarcosine sodium, 1 tablets of cOmplete ULTRA Protease Inhibitor Cocktail in 10 ml FA buffer). The sample was sonicated using a Covaris S220 at the following settings: 200 W Peak Incident Power, 20% Duty Factor, 200 Cycles per Burst for 6 min. Samples were transferred to centrifuge tubes and spun at the highest speed for 15 min. The supernatant was transferred to a new tube, and 5% of the material was saved as input. The remainder was incubated with 25 μl GFP-Trap Magnetic Beads (Chromotek gtd) at 4°C overnight. Wild-type (N2) worms do not carry the GFP tag and serve as negative control. The next day, the beads were washed at 4°C twice with 150 mM NaCl FA buffer (5 min each), once with 1M NaCl FA buffer (5 min). twice with 500 mM NaCl FA buffer (10 min each), once with TEL buffer (0.25 M LiCl, 1% NP-40, 1% sodium deoxycholate, 1 mM EDTA, 10 mM Tris-HCl, pH 8.0) for 10 min, and twice with TE buffer (5 min each). The immunocomplex was then eluted in 200 μl elution buffer (1% SDS in TE with 250 mM NaCl) by incubating at 65°C for 20 min. The input and ChIP samples were then treated with 1μl of 20 mg/ml proteinase K, incubated at 55°C for 2 hr, and then 65°C overnight to reverse cross-link. The immunoprecipitated DNA was purified with Ampure XP beads (A63881) according to manufacturer’s instructions, and used to generate sequencing library using Ovation Ultralow System V2 (Tecan) according to manufacturer’s instructions. The libraries were sequenced on Illumina NextSeq 500 machines with 75bp single-end reads. After initial quality check, the reads were mapped to WS220 using BWA 44 and filtered using SAMtools 45. Peaks were called using MACS2 46. The ChIP-seq peak distribution was calculated and plotted using ChIPseeker 47. The consensus binding motif was obtained using MEME-ChIP 48. Differential binding analysis between L1 and L2 was done using Diffbind 49. All peaks and differential binding sites were annotated and assigned to the nearest gene using ChIPseeker 47.
Auxin inducible degradation
The AID system was employed as previously described 38,50. The conditional daf-16 allele daf-16(ot975[daf-16::mneptune2.5::3xflag::aid) 51 was crossed with daf-2(e1370), panneuronal TIR1-expressing transgenic lines and lin-14/nlp-45 reporters to generate the experimental strains. Animals were grown (from embryo onward) on NGM plates supplemented with OP50 and 4mM auxin in EtOH (indole-3 acetic acid, IAA, Alfa Aesar) at 25°C to degrade DAF-16 panneuronally and to induce dauer formation. As controls, plates were supplemented with the solvent EtOH instead of auxin. Additional control animals without panneuronal TIR-1 expression grown on EtOH and auxin were also included for comparison.
Quantification, Statistical analysis AND Reproducibility
Statistical analysis of the automated worm tracking videos was performed as previously described 13. Briefly, statistical significance between each group was blindly calculated using Wilcoxon rank-sum test and correcting for false-discovery rate. Statistical analysis of RNA-seq comparison was performed using DESeq2 as previously described 42. Statistical analysis for various aspects of ChIP-seq was done using MACS2, MEME-ChIP and Diffbind 46,48,49.
All microscopy fluorescence quantifications were done in the Zen software (Carl Zeiss). For image quantifications, all direct comparisons were done in the same imaging sessions with the same laser settings. Wherever possible, an internal control (i.e. another fluorescent marker within the same strain) that was not altered by the different experimental conditions was used to normalize. If that was not possible, then the image was normalized to background fluorescence (taken as the same size box outside of the worm across all conditions).
For all behavioral assay, randomization and blinding was done wherever possible. For all other molecular and microscopy experiments, experimenters were not blind during data collection/analysis. All statistical tests for fluorescence quantifications and behavior assays were conducted using Prism (Graphpad) and Excel as described in figure legends.
All experiments were repeated at least once independently. At each repeat, all control and experimental conditions were included, and the results of all independent experiments were combined. Whenever representative microscopy images were shown without any quantification, the exact same results were observed in at least 10 animals unless variability is stated.
Extended Data
Extended Data Fig.1. Developmental transitions in neuronal transcriptome across post-embryonic life stages.
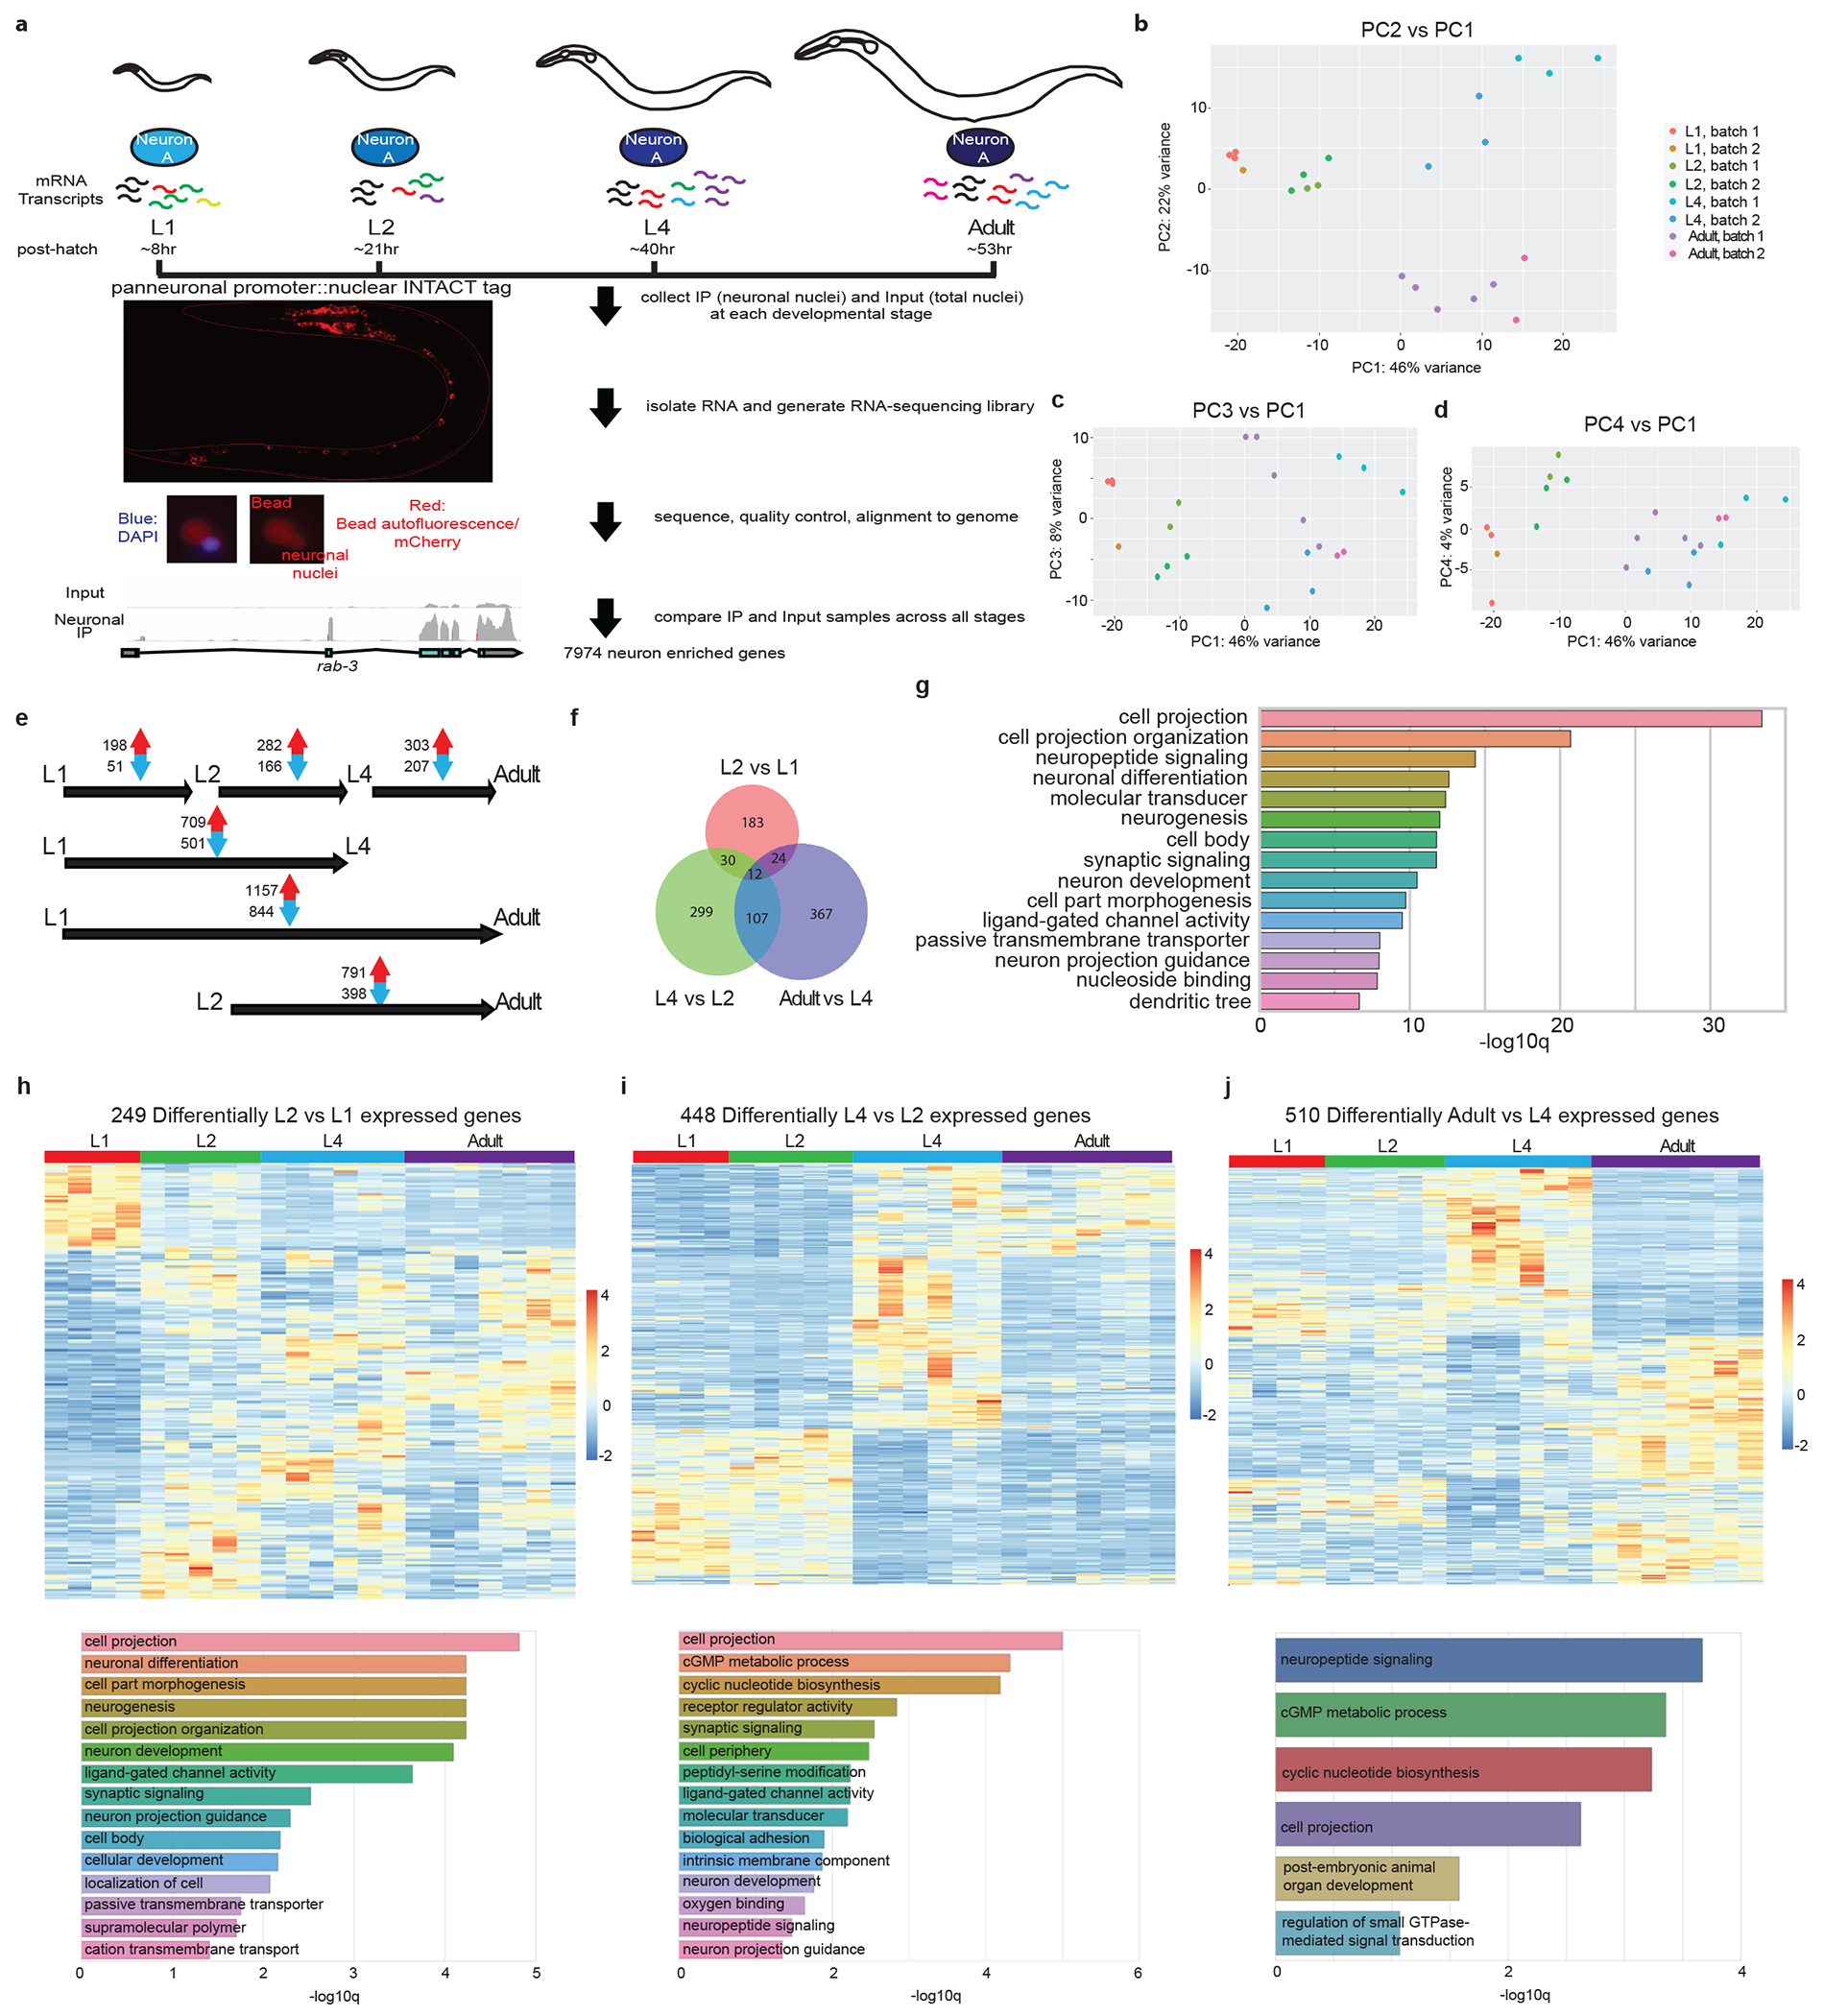
a, Schematic and experimental design for INTACT sample collection, protocol, and data analysis for neuronal transcriptome profiling across development. Representative images of the panneuronal INTACT strain as well as neuronal nuclei after immunoprecipitation (IP) are shown in bottom left panels. Representative tracks from IGV are shown for input and neuronal IP samples to demonstrate IP enrichment for panneuronally expressed gene, rab-3.
b-d, Principal component analysis (PCA) of neuronal transcriptome across post-embryonic development was conducted using DESeq2 in R studio 42. Both batch as well as developmental stage were taken as factors for analysis. Each dot represents a replicate in the RNA-seq analysis. b, PC2 vs PC1. PC1 and 2 delineated the transitions between early larval (L1 and L2) stages and late larval (L4)/adult stages, and between all larval (L1 through L4) stages and the adult stage, respectively. c, PC3 vs PC1. PC3 largely accounted for variation as a result of batch. d, PC4 vs PC1. PC4 largely accounted for L2 specific changes.
e, The numbers of significant (padj<0.01) increases/decreases in gene expression are shown for each stage transition. f, Venn diagram of developmental changes in neuronal gene expression across different stage transitions, showing some overlaps but also distinct developmental changes across each stage transition. g, Gene ontology analysis of the 2639 developmentally-regulated genes using the Enrichment Tool from Wormbase. h, Top: heatmap of the 249 developmentally-regulated genes between L1 and L2 stages across post-embryonic development. In addition to developmentally upregulated and downregulated genes, there was a small subset of genes that showed specific upregulation at the L2 stage. Bottom: gene ontology analysis of these genes using the Enrichment Tool from Wormbase.
i, Top: heatmap of the 448 developmentally-regulated genes between L2 and L4 stages across post-embryonic development. Bottom: gene ontology analysis of these genes using the Enrichment Tool from Wormbase. j, Top: heatmap of the 510 developmentally-regulated genes between L4 and adult stages across post-embryonic development. Bottom: gene ontology analysis of these genes using the Enrichment Tool from Wormbase.
Extended Data Fig.2. Temporal transitions in nervous system gene expression across C. elegans post-embryonic development.
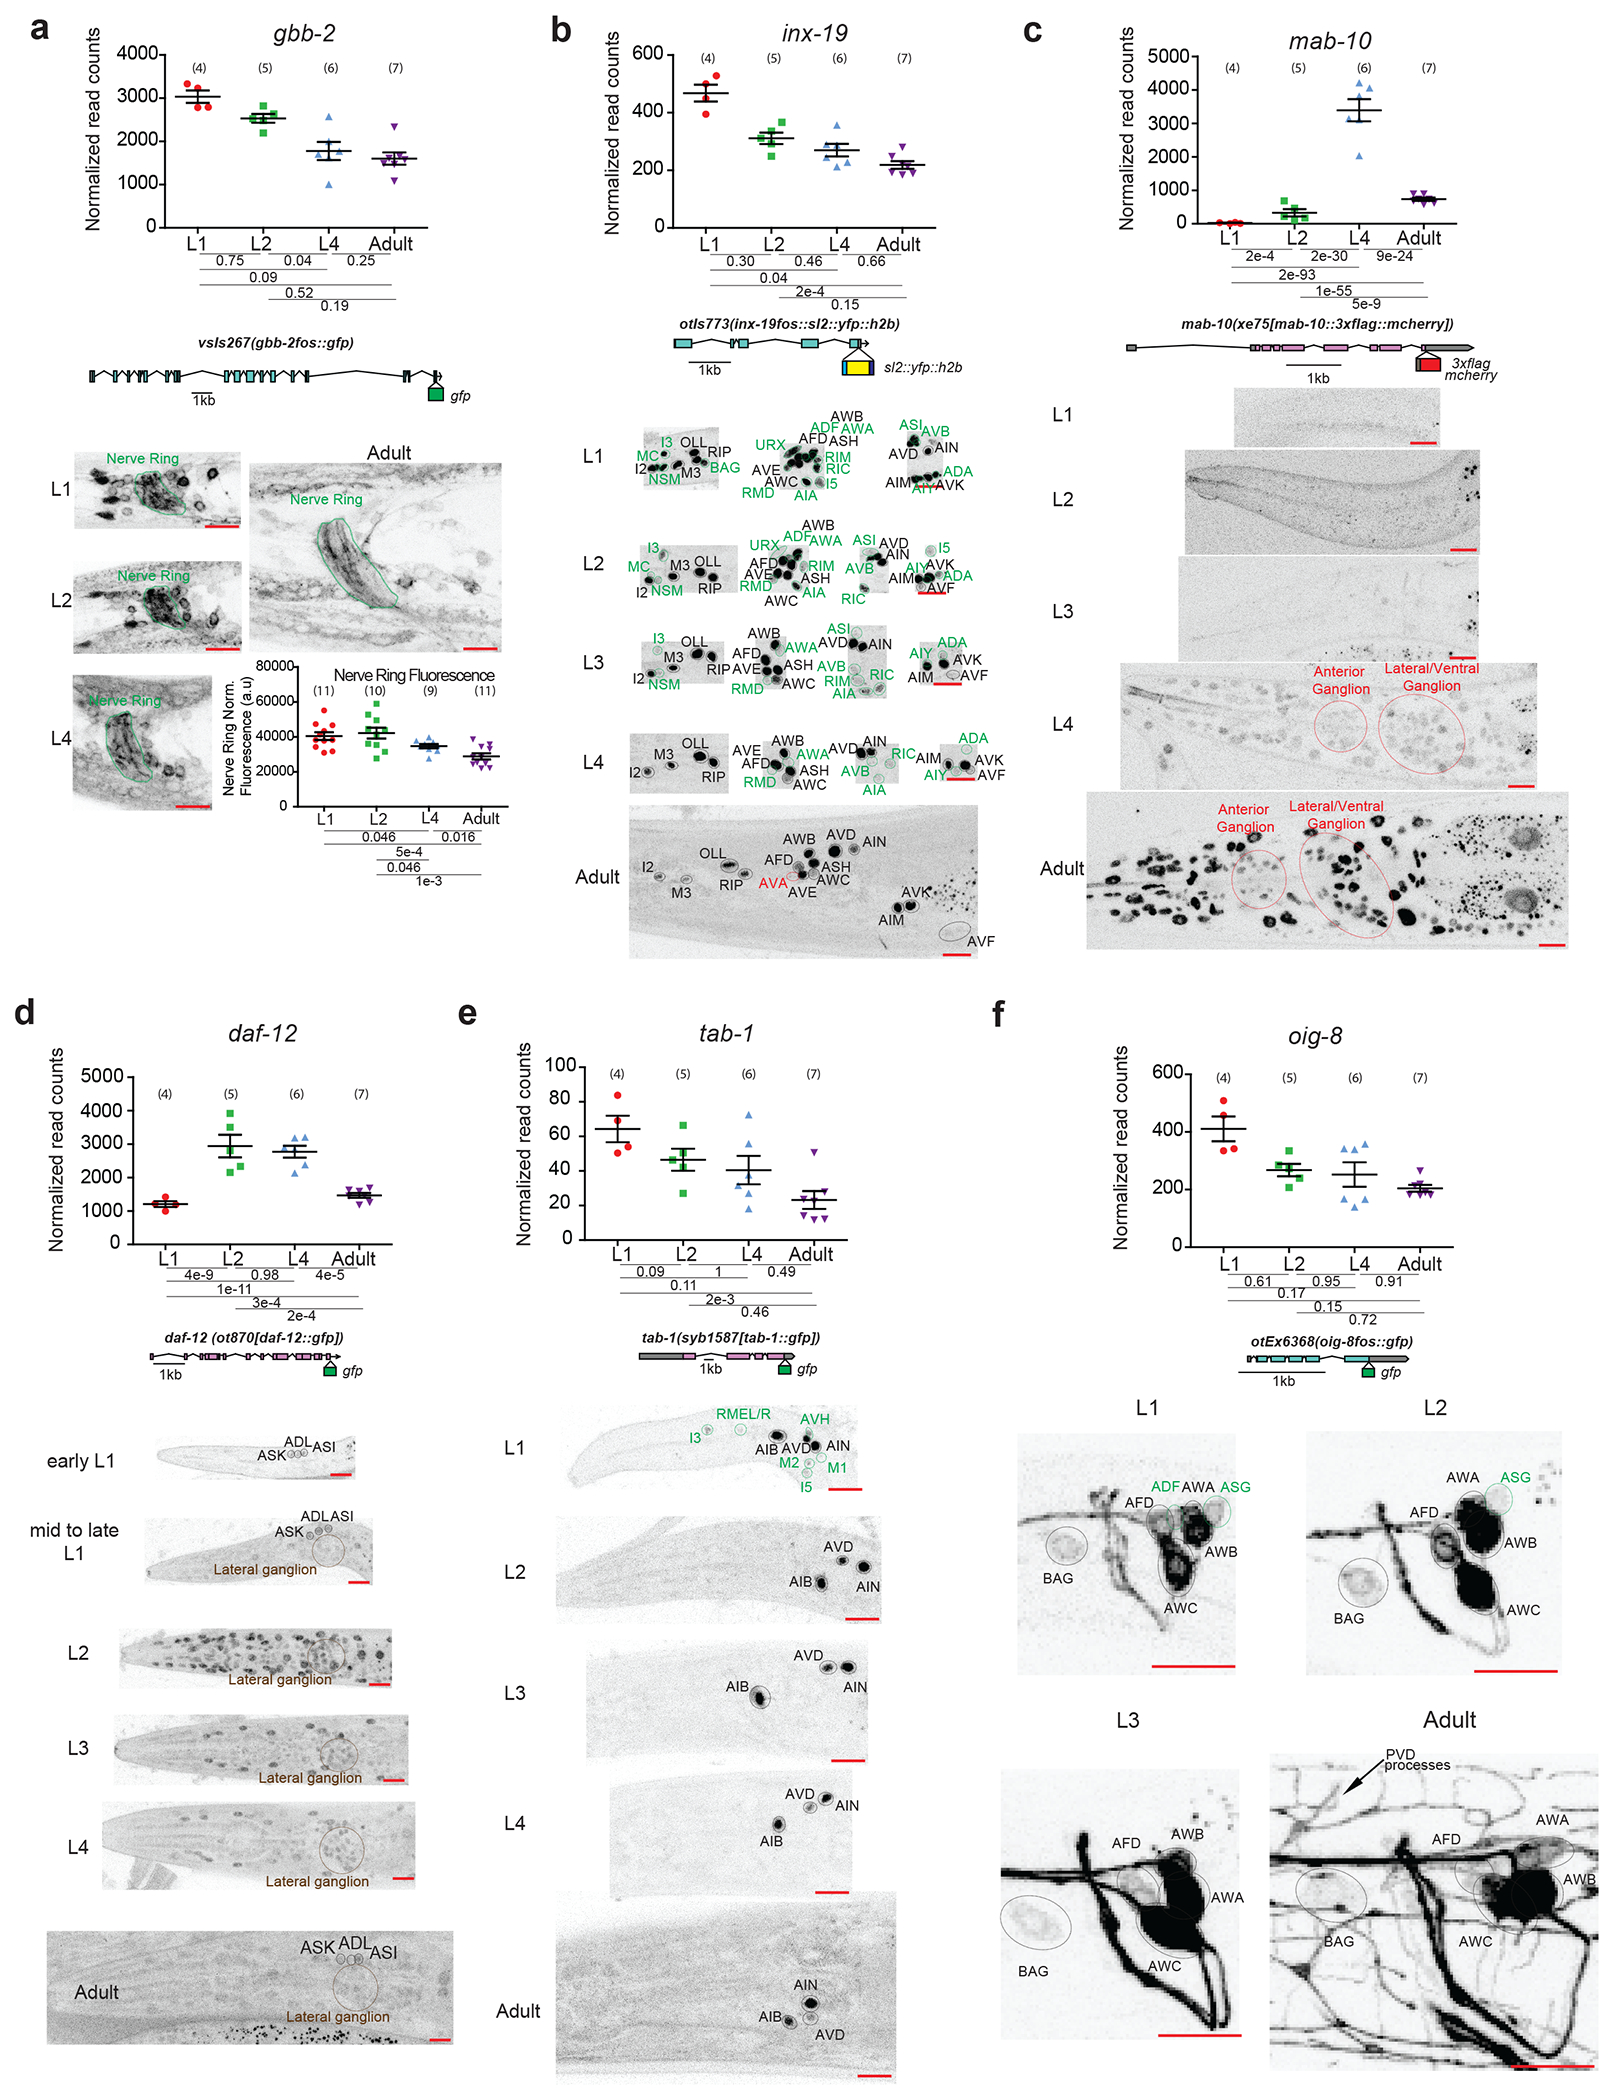
For all panels, validations of developmentally regulated genes with expression reporters are shown. On top are the scattered dot plots (each point represents a single replicate, n in bracket) of the normalized read counts across all developmental stages from the neuronal INTACT/RNA-seq profiling. Mean +/− SEM are shown for each stage. Adjusted p values (padj), as calculated by DESeq2, for each developmental comparison are below. Below the RNA-seq read count plots are the schematics and allele names of the expression reporters. Below that are representative confocal microscopy images of the expression reporters across development. Specific regions/neurons are labeled with dotted lines: those labelled with black dotted lines/names are not altered developmentally while those labelled with green and red lines/names demonstrate, respectively, decreases and increases in expression across development. Those labelled with brown lines/names demonstrate both increases and decreases in expression in the same neurons across development. Red scale bars (10μm) are on the bottom right of all representative images. For all panels, L1 through L4 represent the first through the fourth larval stage animals. For a, additional quantification of fluorescence intensity is also shown at the bottom. Post-hoc two-sided t-test p values and n (in bracket) are shown. Additional details are included in Supplementary Table 6.
a, Metabotropic glutamate receptor gbb-2, as validated with a translational fosmid reporter (gfp), shows expression in the same set of neurons across development 30, although the intensity of expression is decreased across development, including that in the nerve ring as measured with fluorescence intensity. b, Gap junction molecule inx-19, as validated with a transcriptional fosmid reporter (sl2::yfp::h2b), loses expression in sixteen neuronal classes across development and gains expression in the AVA neuron upon entry into adulthood.
c, Transcription cofactor mab-10, as validated with an endogenous translational reporter (3xflag::mcherry) engineered with CRISPR/Cas9, gains expression across the nervous system amongst other tissue during transition into the L4 stage that is further upregulated in adulthood. The RNA prediction matches well with previous RNA FISH analysis 52. The difference between RNA data and protein reporter expression is consistent with previous characterized post-transcriptional regulation by LIN-41 53. d, Nuclear hormone receptor daf-12, as validated with an endogenous translational reporter (gfp) engineered with CRISPR-Cas9, shows increased expression broadly across the nervous system during early/mid-larval stage and then decreased expression upon transition into late larval/adult stage. e, Homeodoman transcription factor tab-1, as validated with an endogenous translational reporter (gfp) engineered with CRISPR-Cas9, loses expression in five classes of neuron during early larval development. f, Immunoglobulin-like domain molecule oig-8, as validated with a translational fosmid reporter (gfp), loses expression in two classes of neuron during early larval development.
Extended Data Fig.3. Temporal transitions in nervous system gene expression across C. elegans post-embryonic development for the neuropeptide family.
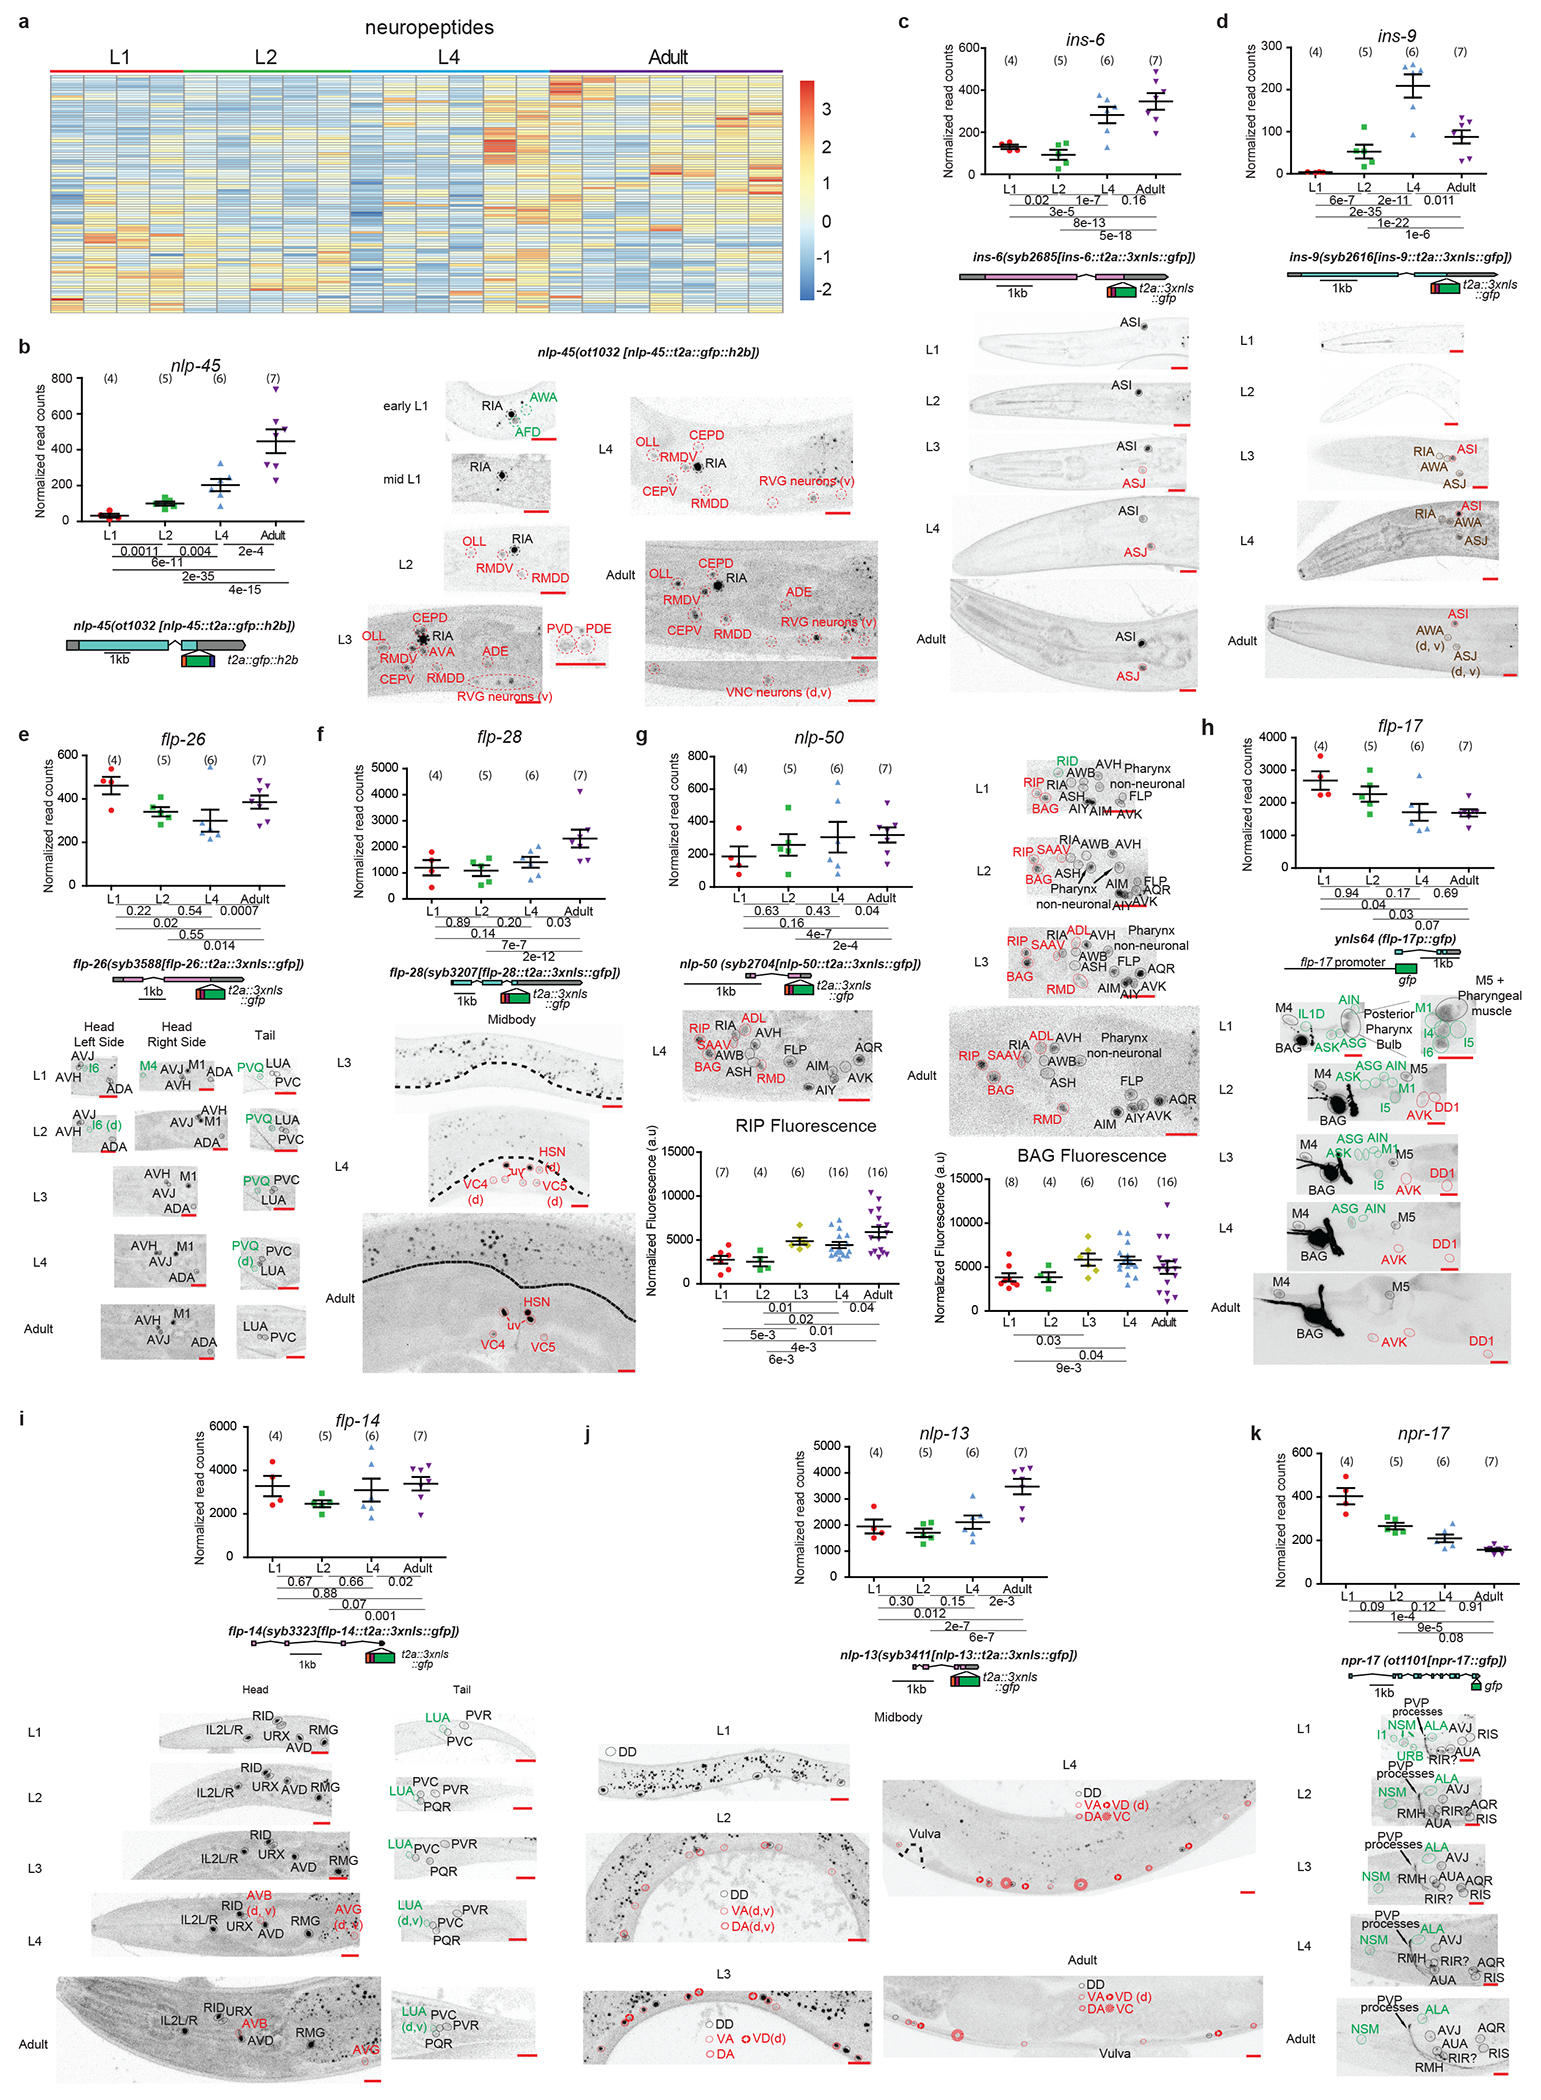
a, Heatmap of all neuronally-enriched neuropeptides across post-embryonic development. Values were z-score normalized and plotted using pheatmap in R studio. Each row represents a single gene, and each column represents a single RNA-seq replicate.
For b-k, validations of developmentally regulated genes with expression reporters are shown. On top (left for b) are the scattered dot plots (each point represents a single replicate, n in bracket) of the normalized read counts across all developmental stages from the neuronal INTACT/RNA-seq profiling. Mean +/− SEM are shown for each stage. Adjusted p values (padj), as calculated by DESeq2, for each developmental comparison are below. Below the RNA-seq read count plots are the schematics and allele names of the expression reporters. Below that (to the right for b, g) are representative confocal microscopy images of the expression reporters across development. Specific regions/neurons are labeled with dotted lines: those labelled with black dotted lines/names are not altered developmentally while those labelled with green and red lines/names demonstrate, respectively, decreases and increases in expression across development. Those labelled with brown lines/names demonstrate both increases and decreases in expression in the same neurons across development. d and v in brackets denotes dim and variable expression, respectively. Red scale bars (10μm) are on the bottom right of all representative images. For all panels, L1 through L4 represent the first through the fourth larval stage animals. Additional details are included in Supplementary Table 6.
b, Other than some remnant expression from embryo in early L1 animals, nlp-45 gains expression progressively in a number of neurons across development. c, Neuropeptide-encoding gene ins-6, as validated with an endogenous reporter (t2a::3xnls::gfp) engineered with CRISPR-Cas9, gains expression in ASJ across the L2->L3 transition. Variable AWA expression (not shown) is detected in L3 animals onwards. d, Neuropeptide-encoding gene ins-9, as validated with an endogenous reporter (t2a::3xnls::gfp) engineered with CRISPR-Cas9, gains expression in a number of neurons as it enters L3/L4 stages and loses expression in a subset of these neurons upon entry into adulthood. Extremely variable and dim RVG neuron expression (VB1/2, not shown) is detected in L3/L4 animals. e, Neuropeptide-encoding gene flp-26, as validated with an endogenous reporter (t2a::3xnls::gfp) engineered with CRISPR-Cas9, loses expression in M4 and I6 pharyngeal neurons across early larval development and loses expression in PVQ as it enters late larval/adult stages. f, Neuropeptide-encoding gene flp-28, as validated with an endogenous reporter (t2a::3xnls::gfp) engineered with CRISPR-Cas9, gains expression in hermaphrodite specific neurons (VC, HSN) as it enters late larval/adult stages. Head/tail neurons do not appear to be developmentally regulated in this reporter (images not shown). g, Neuropeptide-encoding gene nlp-50, as validated with an endogenous reporter (t2a::3xnls::gfp) engineered with CRISPR-Cas9, gains expression in a number of neurons across development. It also loses expression in the RID neuron during early larval development. Additional quantification of RIP and BAG fluorescence intensity across development is also shown at the bottom. Post-hoc two-sided t-test p values and n in brackets are shown. h, Neuropeptide-encoding gene flp-17, as validated with a promoter fusion reporter (gfp), loses and gains expression in nine and two classes of neurons, respectively, across post-embryonic development. i, Neuropeptide-encoding gene flp-14, as validated with an endogenous reporter (t2a::3xnls::gfp) engineered with CRISPR-Cas9, loses and gains expression in one (LUA) and two (AVB and AVG) classes of neurons as it enters late larval/adult stages, respectively. j, Neuropeptide-encoding gene nlp-13, as validated with an endogenous reporter (t2a::3xnls::gfp) engineered with CRISPR-Cas9, gains expression in the ventral nerve cord neurons (DA, VA, VD, VC) across development. Head/tail neurons do not appear to be developmentally regulated in this reporter (images not shown). k, Neuropeptide receptor gene npr-17, as validated with an endogenous translational reporter (gfp) engineered with CRISPR-Cas9, shows decreased and increased expression in four and one classes of neurons, respectively.
Extended Data Fig.4. Temporal transitions in nervous system gene expression across C. elegans post-embryonic development for the receptor-type guanylyl cyclases (rGCs) family.
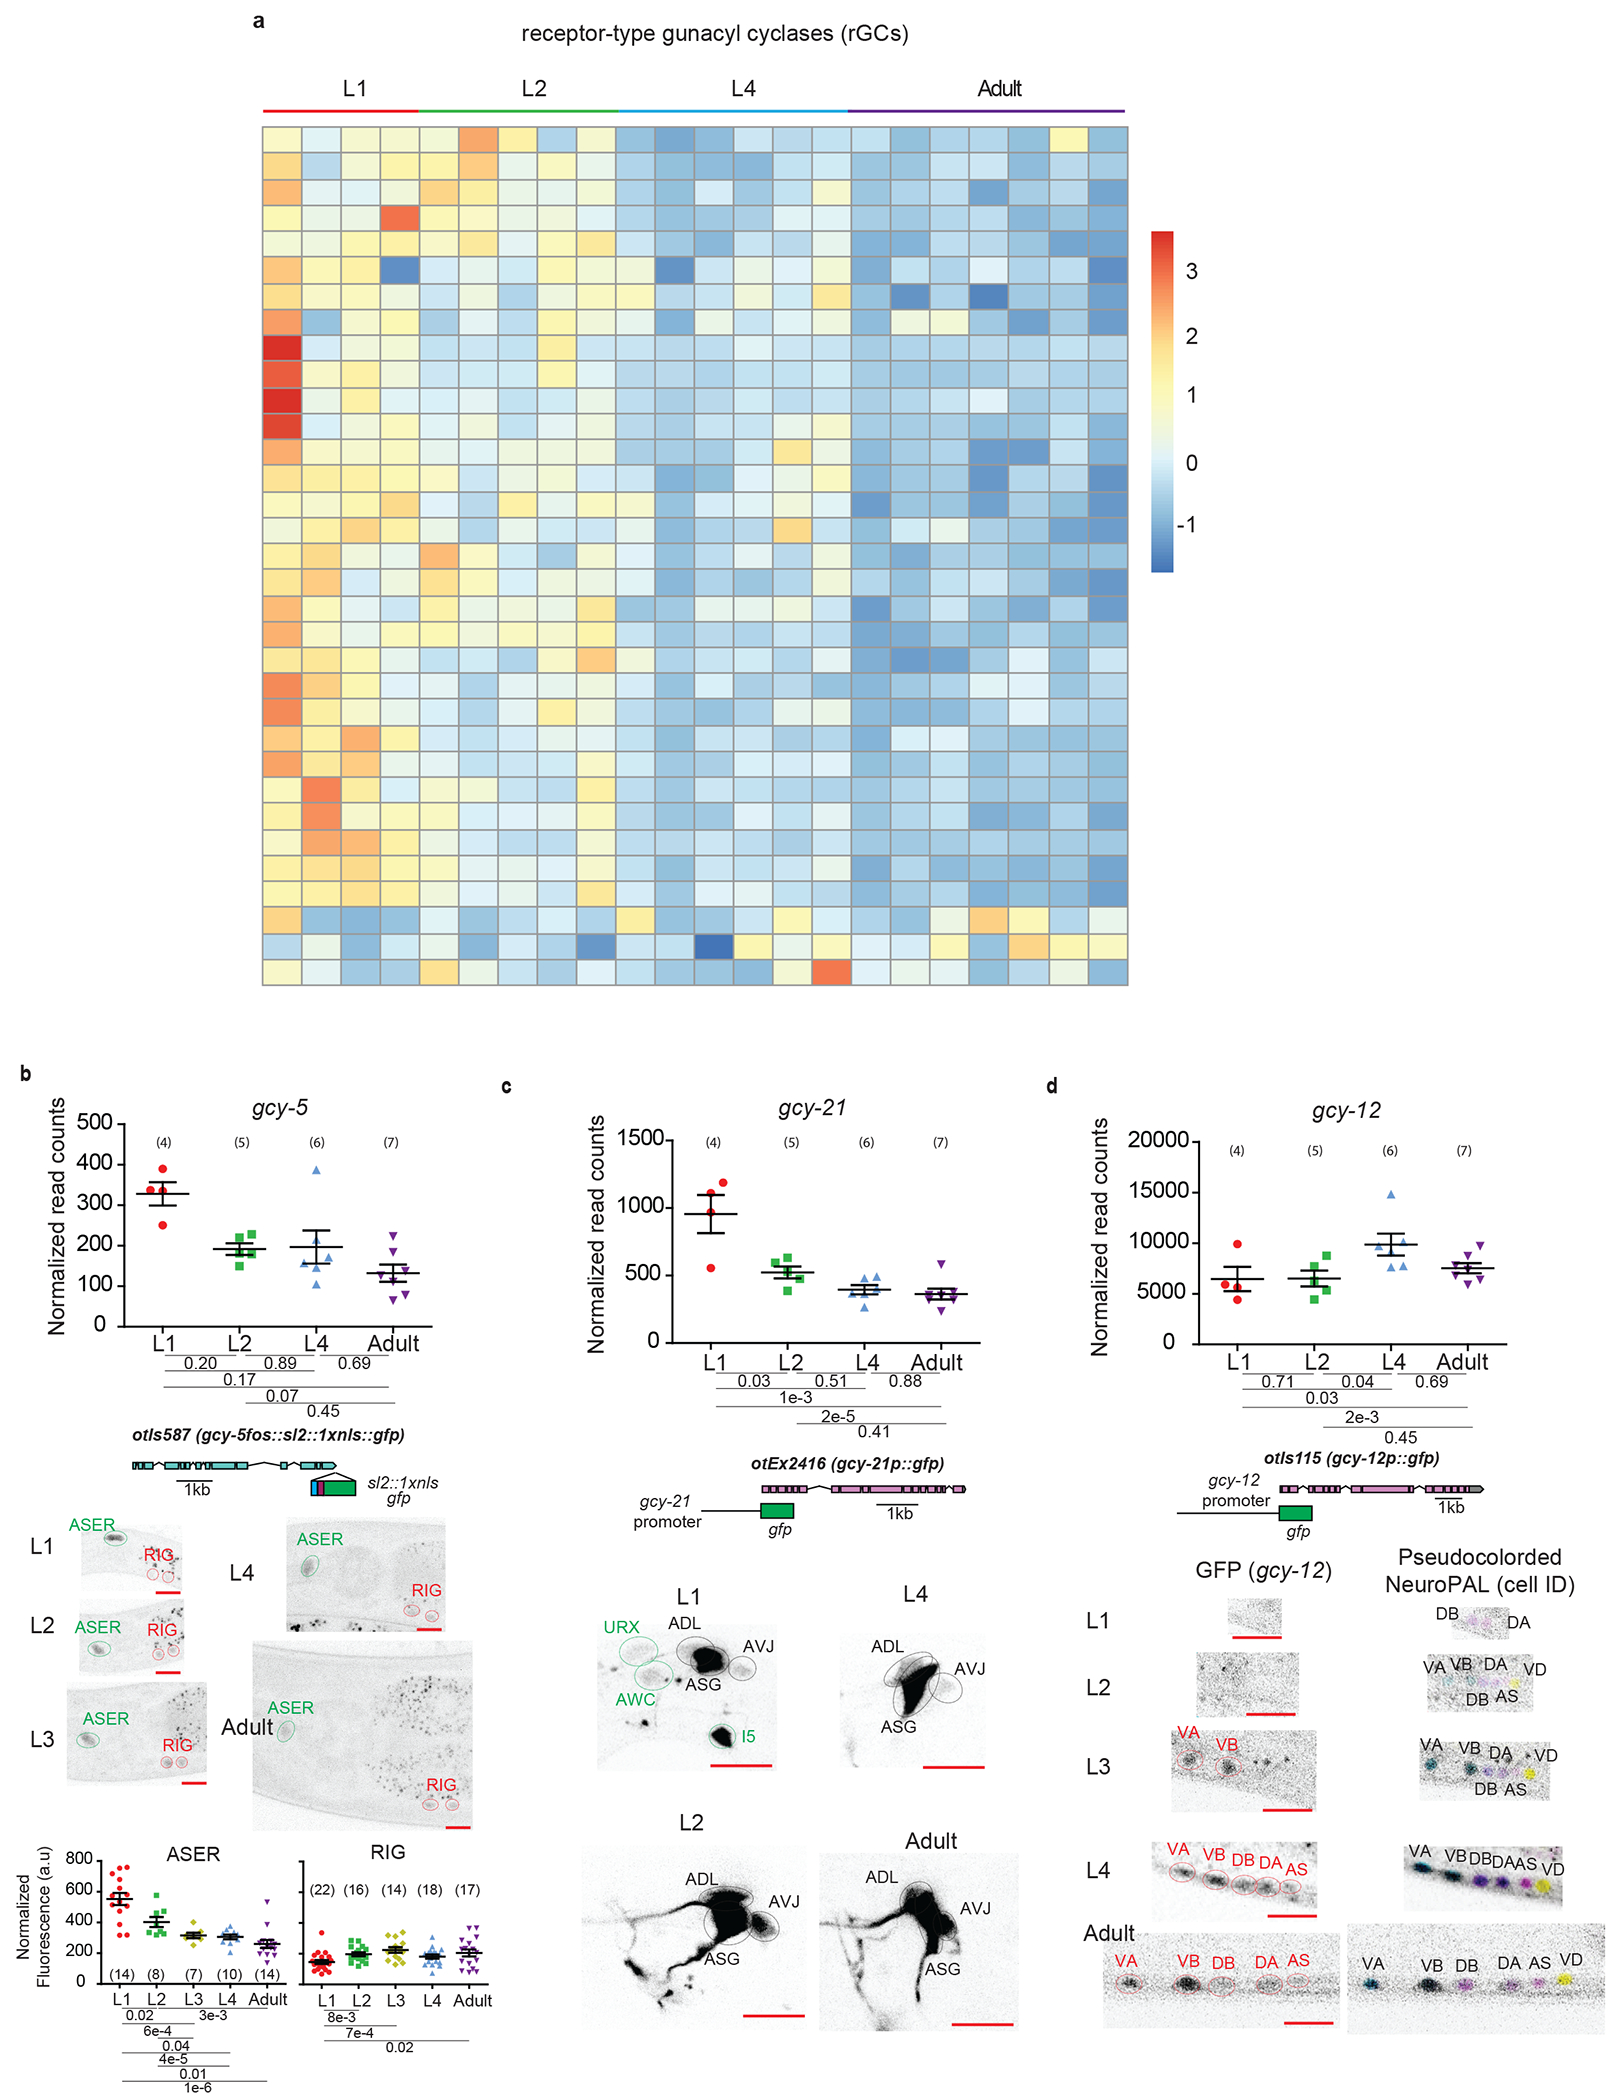
a, Heatmap of all neuronally-enriched receptor-type guanylyl cyclases (rGCs) across post-embryonic development. Values were z-score normalized and plotted using pheatmap in R studio. Each row represents a single gene, and each column represents a single RNA-seq replicate.
For b-d, validations of developmentally regulated genes with expression reporters are shown. On top are the scattered dot plots (each point represents a single replicate, n in bracket) of the normalized read counts across all developmental stages from the neuronal INTACT/RNA-seq profiling. Mean +/− SEM are shown for each stage. Adjusted p values (padj), as calculated by DESeq2, for each developmental comparison are below. Below the RNA-seq read count plots are the schematics and allele names of the expression reporters. Below that are representative confocal microscopy images of the expression reporters across development. Specific regions/neurons labeled with dotted lines: those labelled with black dotted lines/names are not altered developmentally while those labelled with green and red lines/names demonstrate, respectively, decreases and increases in expression across development. Red scale bars (10μm) are on the bottom right of all representative images. For all panels, L1 through L4 represent the first through the fourth larval stage animals. Additional details are included in Supplementary Table 6.
b, rGC gcy-5, as validated with a transcriptional fosmid reporter (sl2::1xnls::gfp), shows decreased expression in ASER and increased expression in RIG, as measured with fluorescence intensity, across development. Quantifications of fluorescence intensity are shown at the bottom. Post-hoc two-sided t-test p values and n in brackets are shown. c, rGC gcy-21, as validated with a promoter fusion reporter (gfp), loses expression in three neuronal classes across the L1->L2 transition. d, rGC gcy-12, as validated with a promoter fusion reporter (gfp), gains expression in A and B type motor neurons across mid/late larval development.
Extended Data Fig.5. Expression of lin-14 is downregulated in the nervous system amongst other tissues across post-embryonic development in a lin-4 dependent manner in hermaphrodite animals.
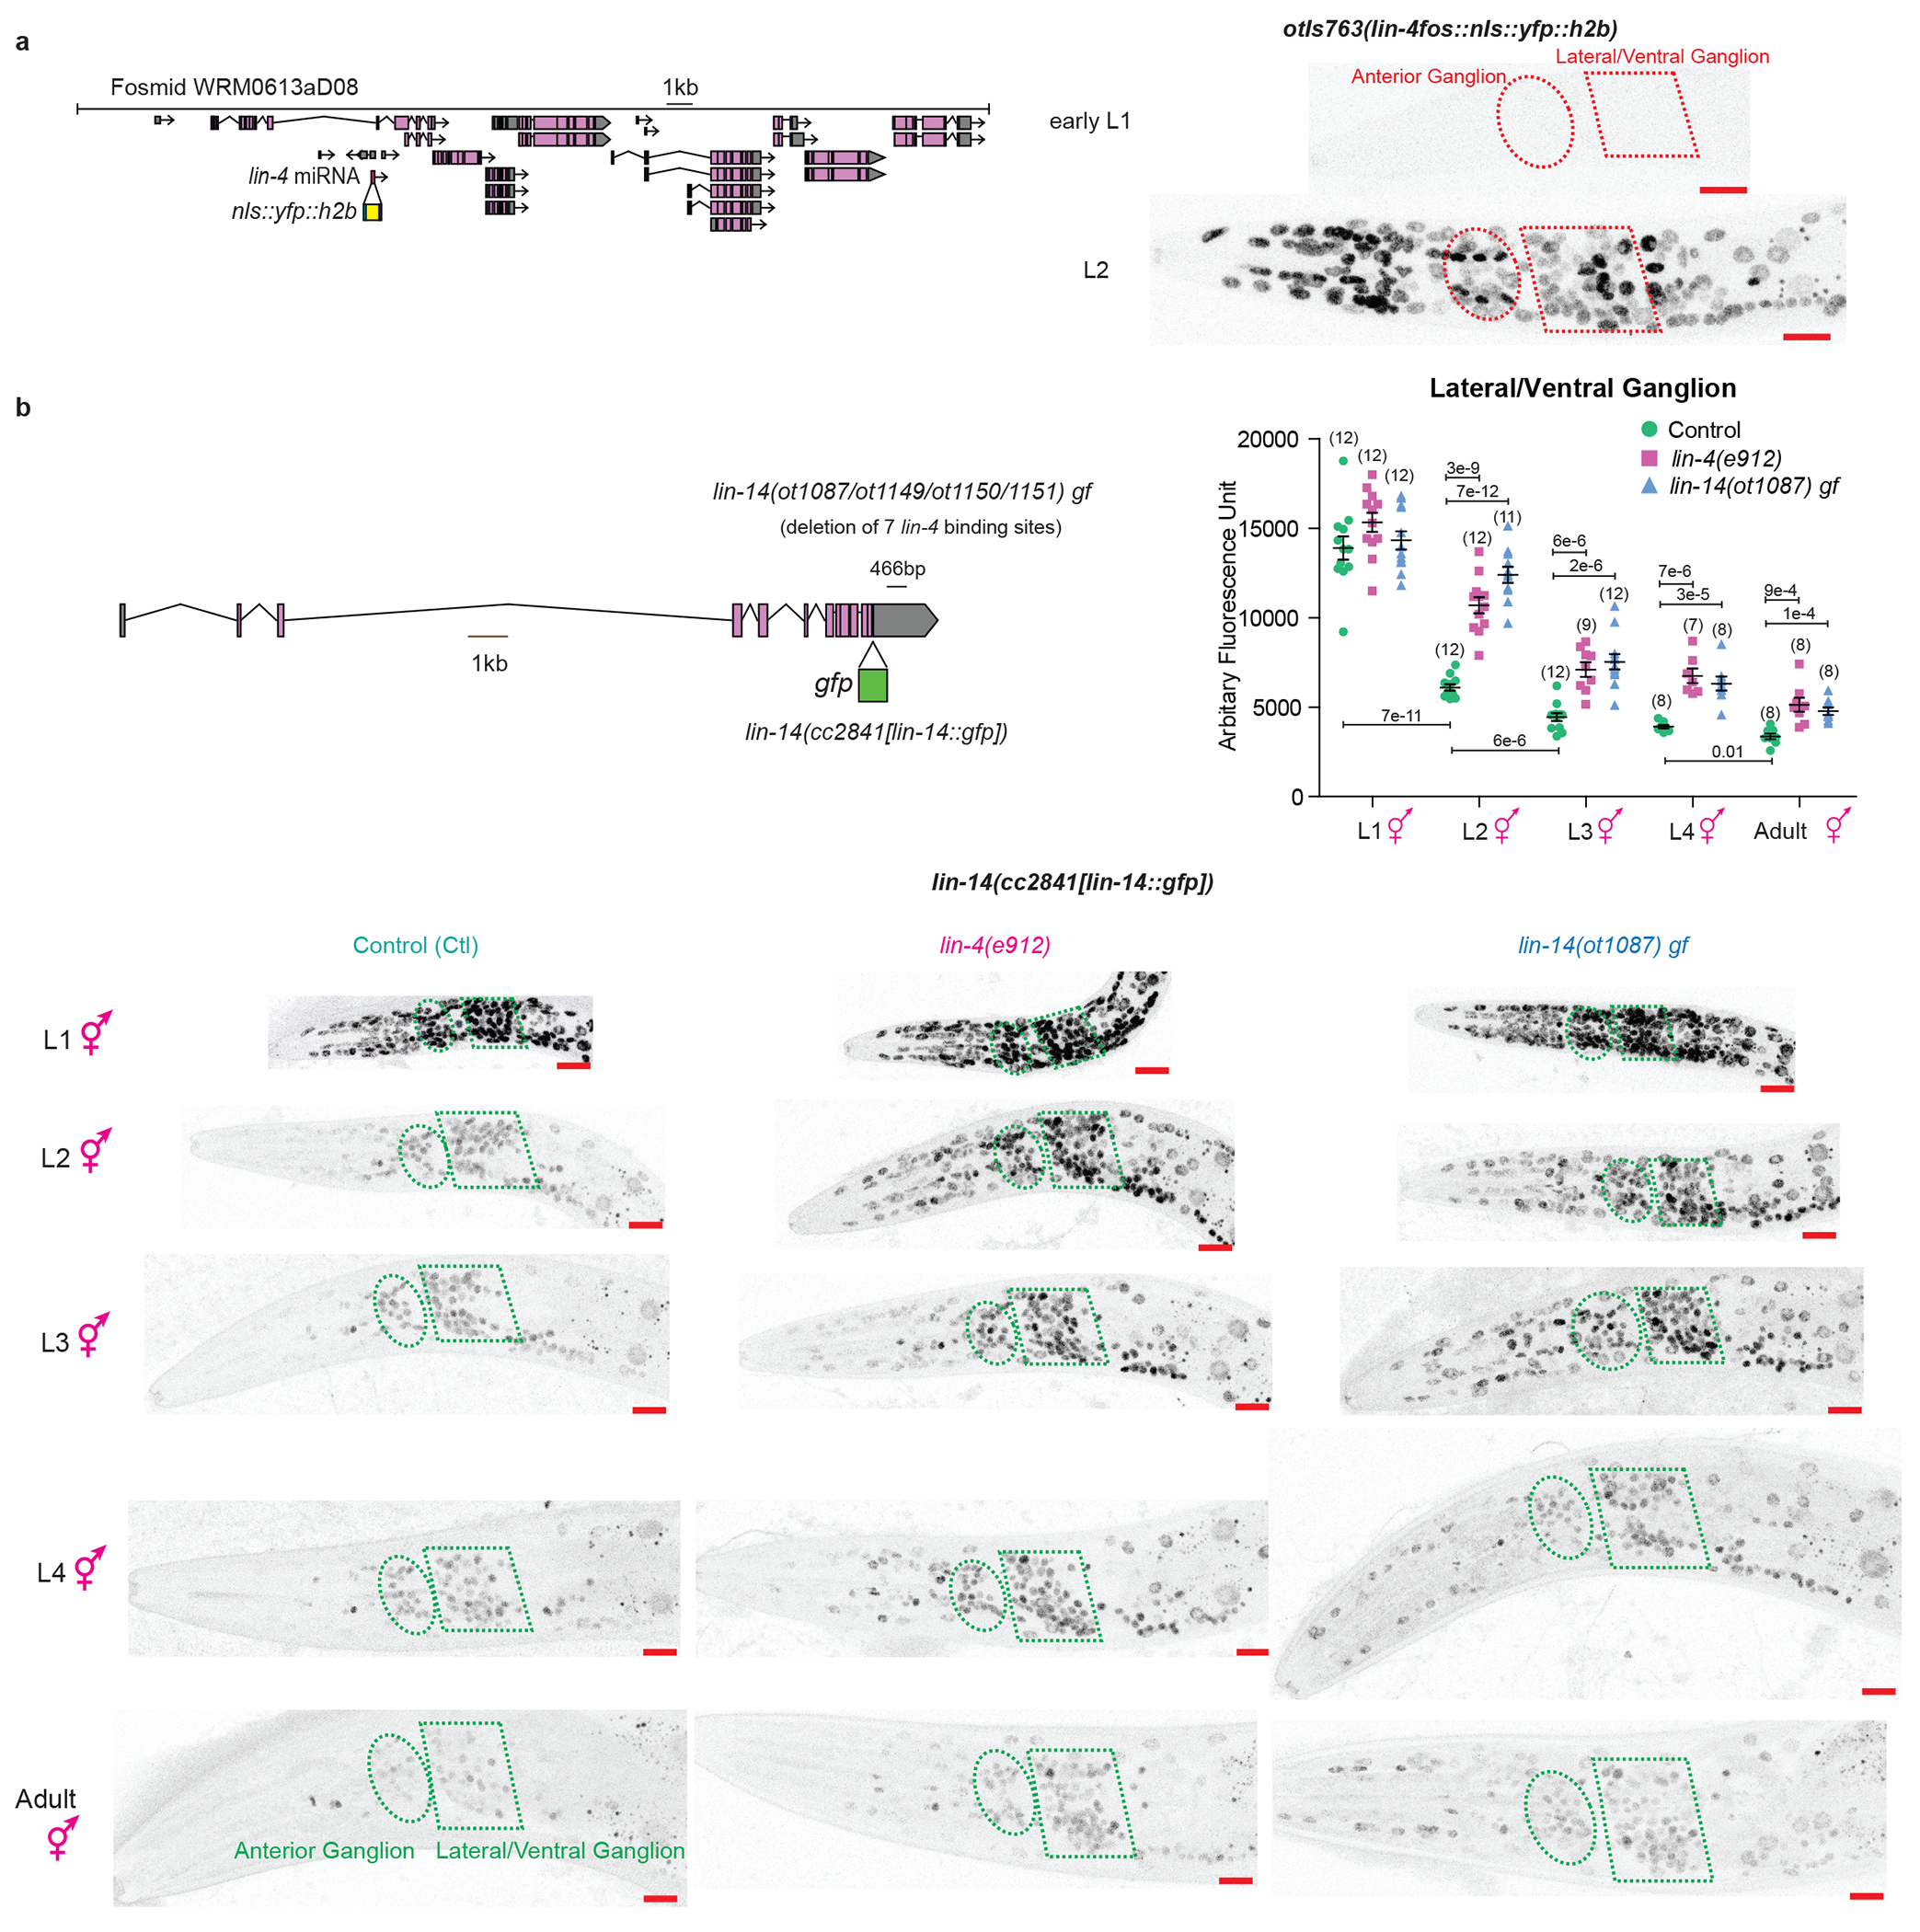
a, Expression of lin-4 is turned on in the nervous system amongst other tissues during the L1->L2 transition. Schematic of the lin-4 fosmid expression reagent, in which the lin-4 pre-miRNA sequence was replaced with YFP, is shown on the left. Representative images of lin-4 expression in L1 and L2 animals are shown on the right. Ellipse and polygon outline the anterior and lateral/ventral neuronal ganglions respectively. b, Expression of lin-14 is downregulated in the nervous system amongst other tissues across post-embryonic development in a lin-4 dependent manner in hermaphrodite animals. Schematic of the lin-14 translational GFP allele, as engineered by CRISPR-Cas9, as well as lin-14 gain of function(gf) alleles (ot1087/ot1149/ot1150/ot1151), where a 466bp region containing all seven lin-4 repressive binding sites is deleted, are shown on the upper left. All 4 gf alleles represent the same molecular lesion but resulted from independent CRISPR-Cas9 mediated deletions. Quantification of LIN-14::GFP expression in the lateral/ventral ganglion is shown on the upper right. Post-hoc two-sided t-test p values and n (in bracket) are shown. On the bottom are the representative images of the lin-14::GFP allele across post-embryonic development in control, lin-4(e912) null, and lin-14(ot1087) gf animals. Ellipse and polygon outline the anterior and lateral/ventral neuronal ganglions respectively. Red scale bars (10μm) are on the bottom right of all representative images. Expression of lin-14 is still detectable in the adult hermaphrodite. lin-14 expression is upregulated in lin-4(e912) null and lin-14(ot1087) gf animals across development. The incomplete juvenization of lin-14 expression across development in the lin-4 null mutant suggests additional mechanisms beyond lin-4 that downregulate lin-14 across post-embryonic development.
Extended Data Fig.6: lin-4 controls a subset of the developmentally-regulated gene battery through direct repression of lin-14, and not lin-28.
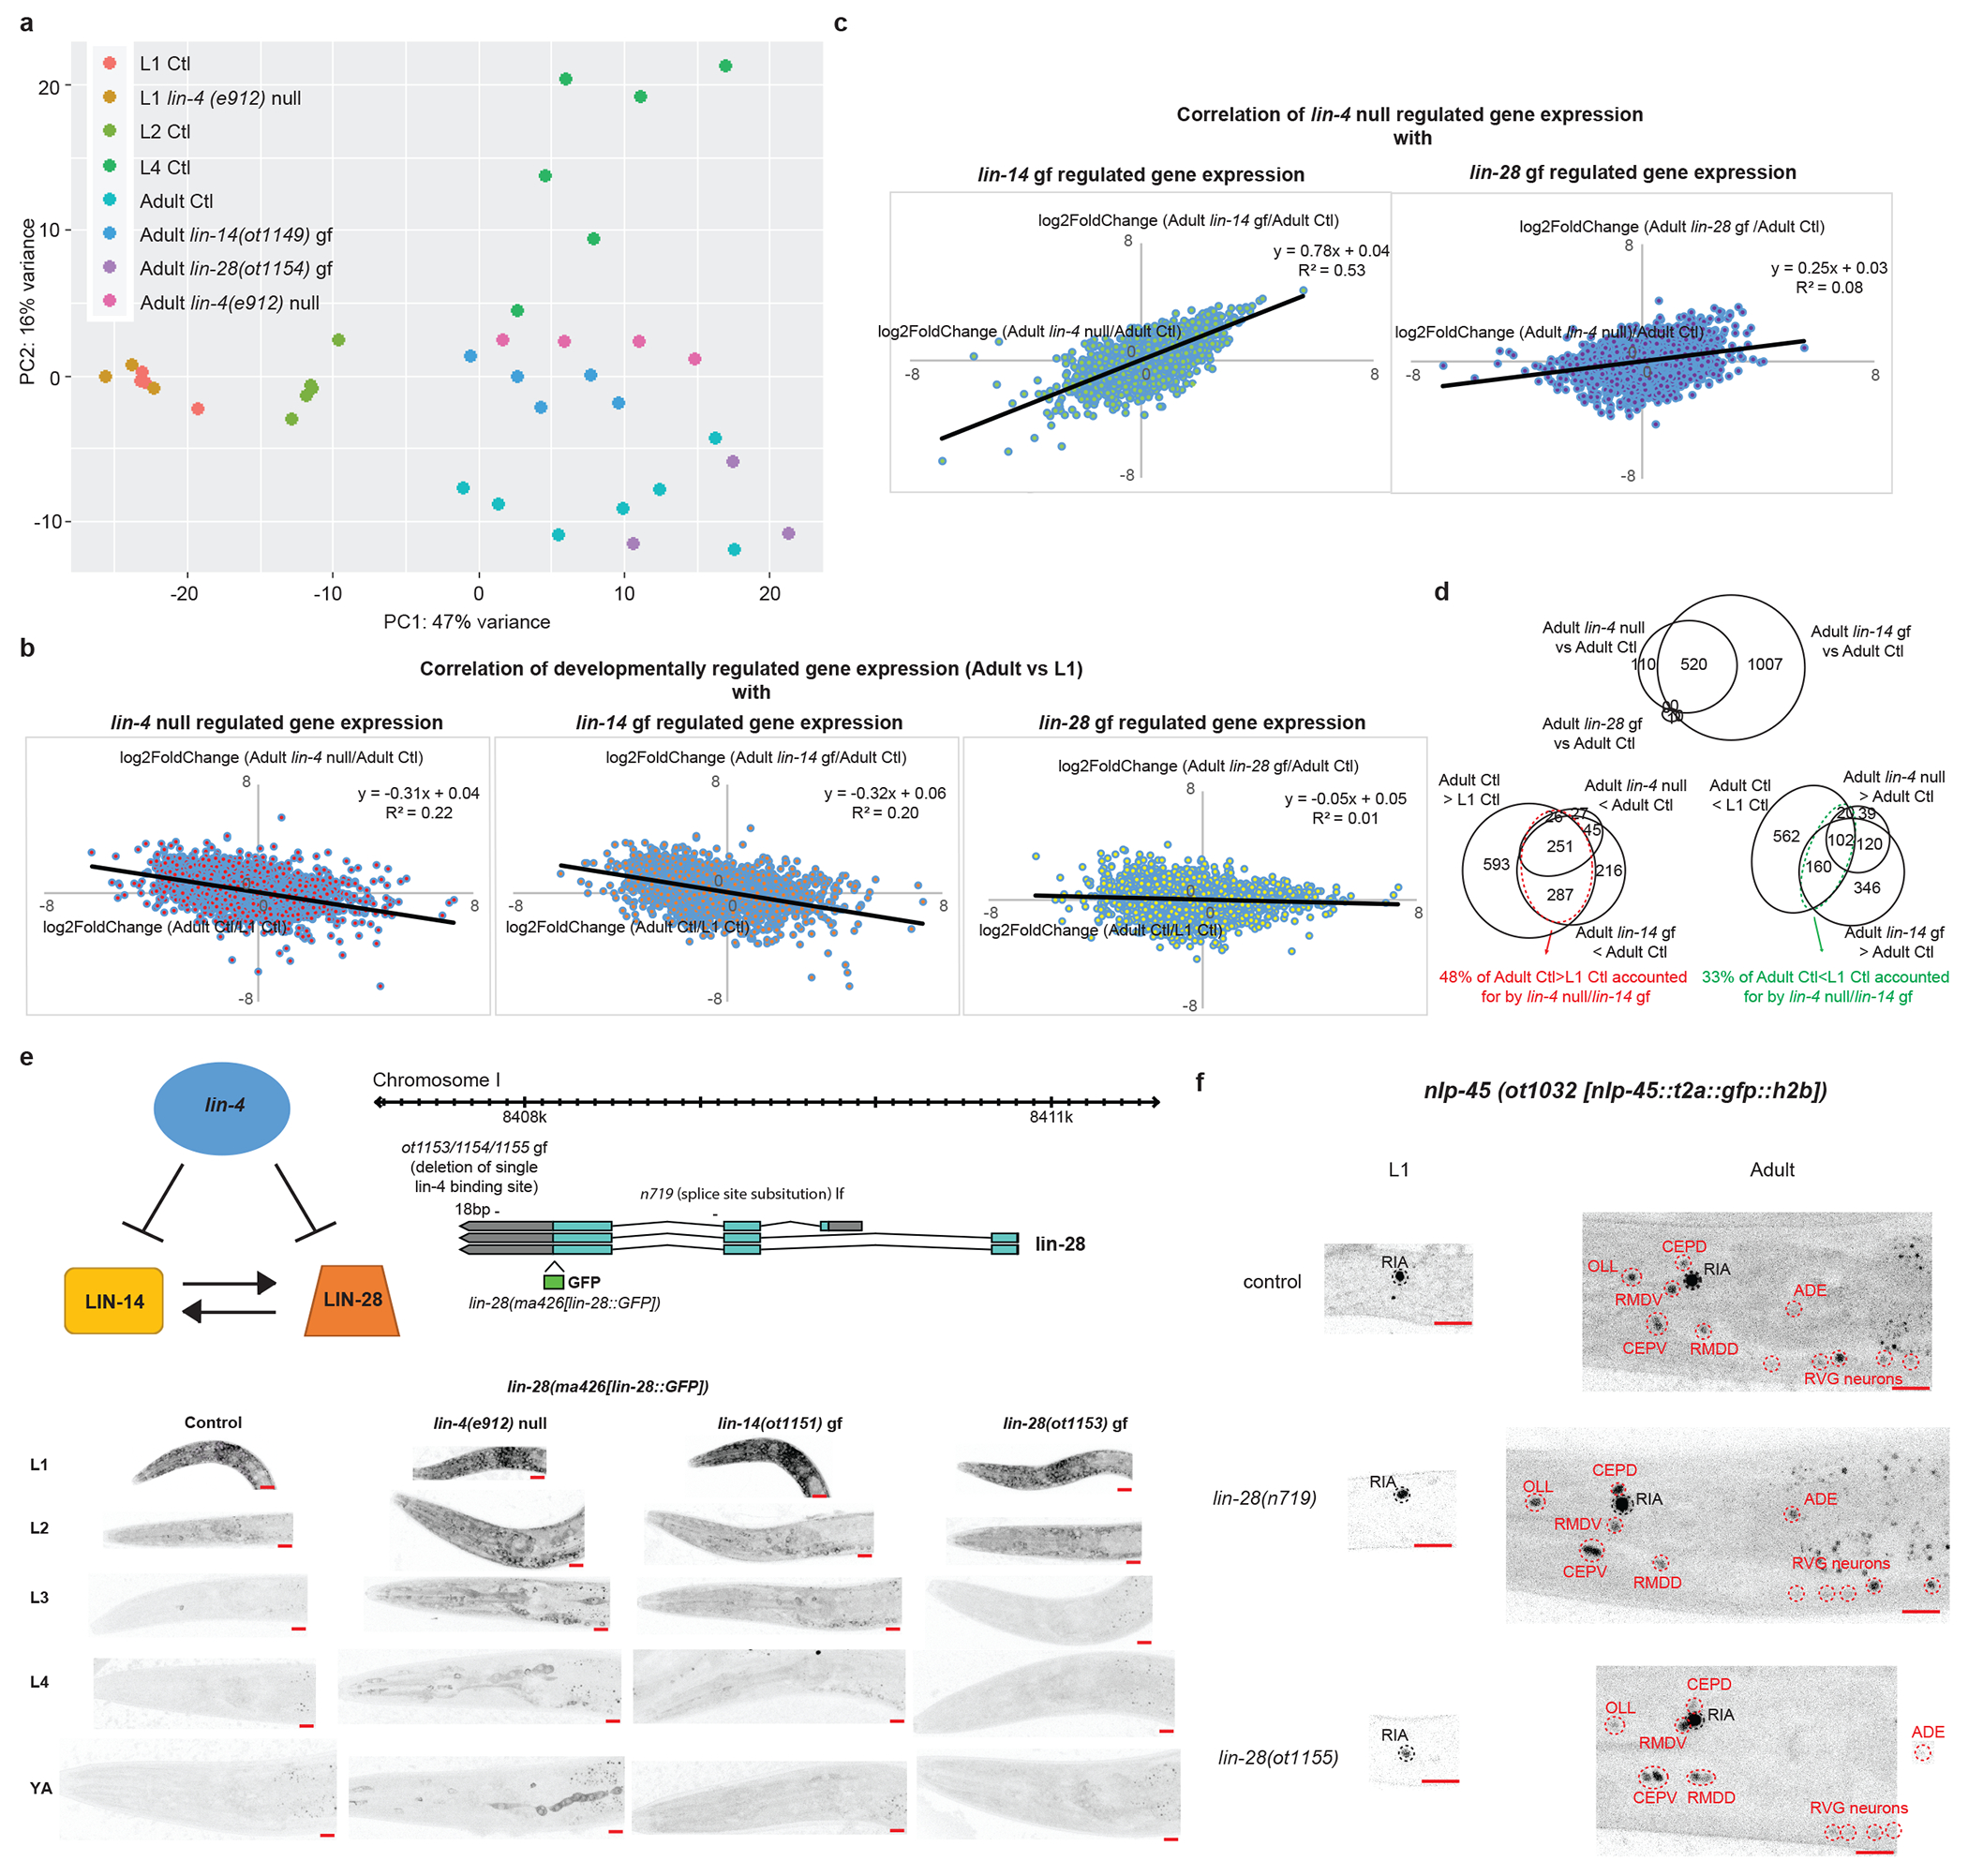
a, lin-4(e912) null mutation juvenizes a subset of the adult control(Ctl) neuronal transcriptome to resemble that of the L1 Ctl neuronal transcriptome through direct de-repression of lin-14 and not lin-28. Principal component analysis (PCA) of the neuronal transcriptomes across post-embryonic development and across genotypes was conducted using DESeq2 in R studio. Each dot represents a replicate in the RNA-seq analysis. b, Correlation between developmentally gene expression changes (log2FoldChange[Adult Expression/L1 Expression]) with gene expression changes in lin-4(e912) null mutation (log2FoldChange[Adult lin-4(e912) null expression/Adult control expression], left), in lin-14(ot1149) gain of function (gf) mutation (log2FoldChange[Adult lin-14(ot1149) gf expression/Adult control expression], middle), and in lin-28(ot1154) gf mutation (log2FoldChange[Adult lin-28(ot1154) gf expression/Adult control expression], right). Linear regression was fitted through each set of data points, and the equation and R2 values are shown for each. lin-4 null and lin-14 gf mutations accounted for some of the developmentally gene expression changes between L1 and adult, while lin-28 gf mutation did not. c, Correlation between gene expression changes in lin-4(e912) null mutation (log2FoldChange[Adult lin-4(e912) null expression/Adult control expression]) with gene expression changes in lin-14(ot1149) gf mutation (log2FoldChange[Adult lin-14(ot1149) gf expression/Adult control expression], left), and in lin-28(ot1154) gf mutation (log2FoldChange[Adult lin-28(ot1154) gf expression/Adult control expression], right). Linear regression was fitted through each set of data points, and the equation and R2 values are shown for each. lin-14 gain of function mutation accounted for most of the changes observed in the lin-4 null mutation, but lin-28 gain of function mutation did not. d, Top Venn diagram showing that the difference between the adult lin-4 null neuronal transcriptome compared to the adult control(Ctl) neuronal transcriptome is largely recapitulated in the transcriptome of adult lin-14(ot1149) gf mutants. Only one gene is significantly different in the adult lin-28(ot1154) gf vs adult control comparison and does not overlap with the genes regulated by lin-4/lin-14. Bottom left Venn diagram showing that 48% of genes that demonstrate developmental upregulation (adult control(Ctl)>L1 Ctl) are juvenized in the adult lin-4 null and/or lin-14(ot1149) gf animals. Bottom right Venn diagram showing that 33% of genes that demonstrate developmental downregulation (adult control(Ctl)<L1 Ctl) are juvenized in the adult lin-4 null and/or lin-14(ot1149) gf animals. e, lin-4 regulates lin-28 mainly through lin-14 and not through direct repression of lin-28. On the top left is the schematic of the regulation between lin-4, lin-14 and lin-28 based upon previous studies. On the top right is the schematic of the lin-28 translational GFP allele, as engineered by CRISPR-Cas9, as well as lin-28(ot1153/54/55) gf and lin-28(n719) lf alleles. These three gf alleles represent the same molecular lesion (deletion of single lin-4 binding site in the lin-28 3’UTR) but independent CRISPR-Cas9 mediated deletion events. On the bottom are the representative images of the lin-28 translational GFP allele across post-embryonic development in control, lin-4(e912) null, lin-14(ot1151) gf, and lin-28(ot1153) gf animals. The signal is diffuse and cytoplasmic but can be observed in all tissues including the nervous system in early larval animals. Red scale bars (10μm) are on the bottom right of all representative images. LIN-28 is downregulated across post-embryonic development. lin-4(e912) null and lin-14 (ot1151) gf mutations delay the downregulation of LIN-28, particularly during the L2->L3 transition, while the lin-28(ot1153) gf mutation does not. f, lin-28 does not regulate developmental expression pattern of nlp-45. Representative images of the nlp-45 expression reporter in control, lin-28(n719) lf and lin-28(1155) gf animals. Neurons that are labelled in black are not developmentally regulated while those that are labelled in red are developmentally upregulated. Red scale bars (10μm) are on the bottom right of all representative images.
Extended Data Fig 7. Developmentally regulated genes not controlled by lin-4/lin-14.
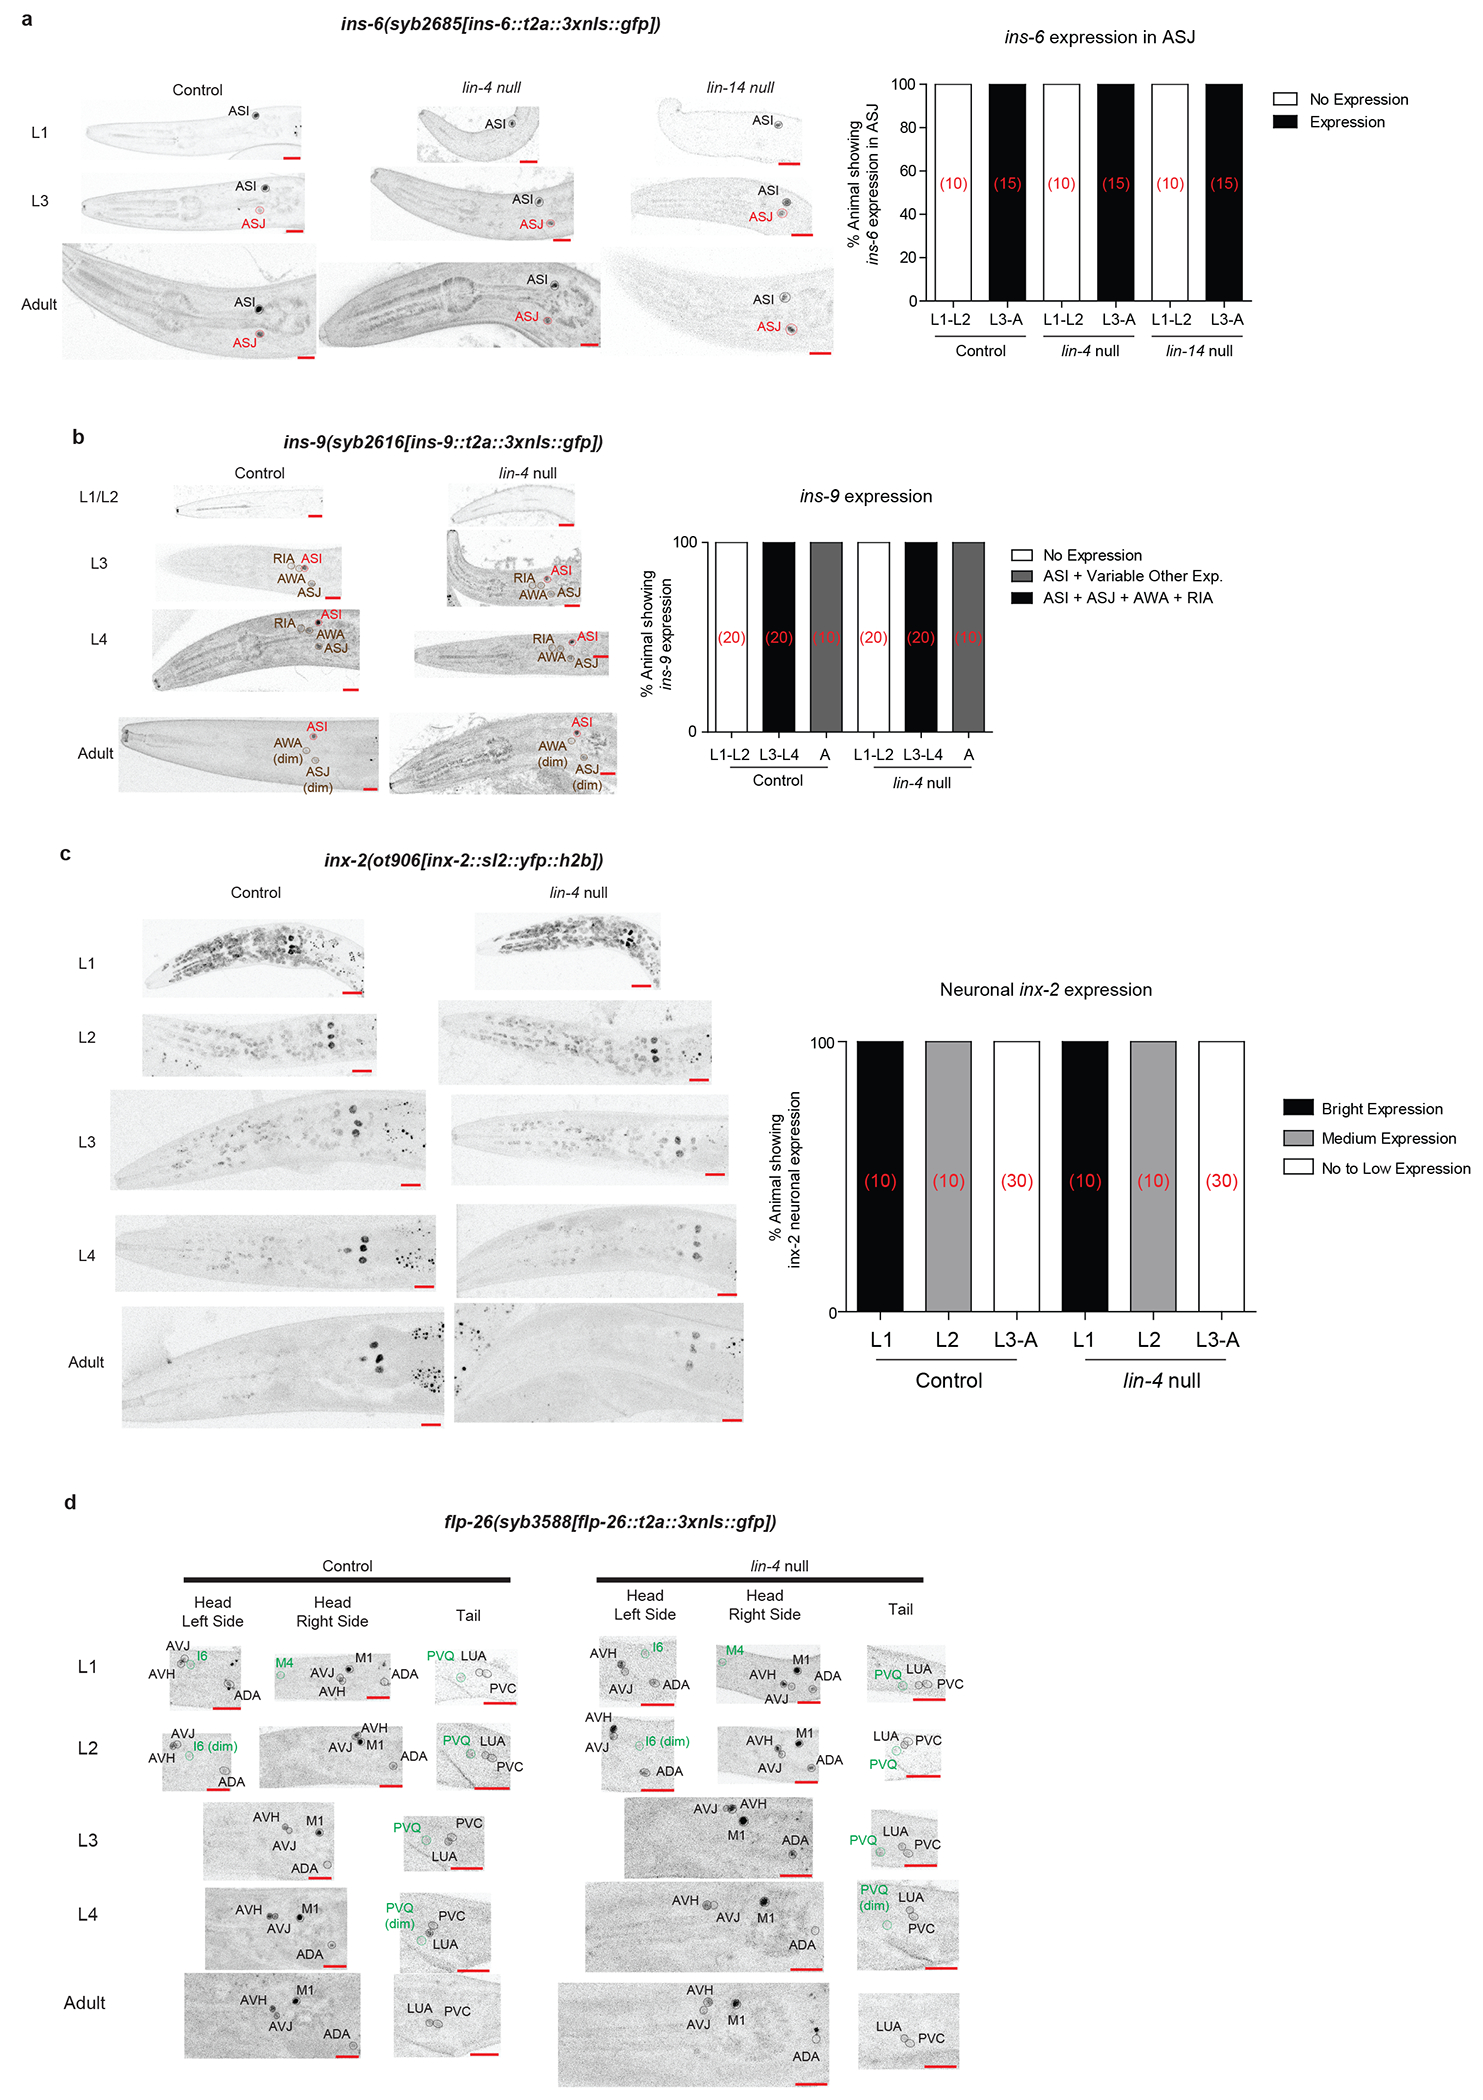
a, ins-6 developmental expression is not regulated by lin-4 nor lin-14. Representative images of the ins-6 expression reporter in control, lin-4 null and lin-14 null animals are shown on the left while quantification of the ins-6 expression in ASJ is shown on the right (number of animals for each condition is shown in red brackets). b, ins-9 developmental expression is not regulated by lin-4. Representative images of the ins-9 expression reporter in control and lin-4 null animals are shown on the left while quantification of the ins-9 expression is shown on the right (number of animals for each condition is shown in red brackets). c, inx-2 developmental expression is not regulated by lin-4. Representative images of the inx-2 expression reporter in control and lin-4 null animals are shown on the left while quantification of neuronal inx-2 expression is shown on the right (number of animals for each condition is shown in red brackets). d, flp-26 developmental expression is not regulated by lin-4. Representative images of the flp-26 expression reporter in control and lin-4 null animals are shown. Control images for A-D are taken from Extended Data Fig.3. Red scale bars (10μm) are on the bottom right of all representative images.
Extended Data Fig 8. Decreased LIN-14 binding across L1->L2 transition controls lin-4/lin-14 dependent transcriptomic changes.
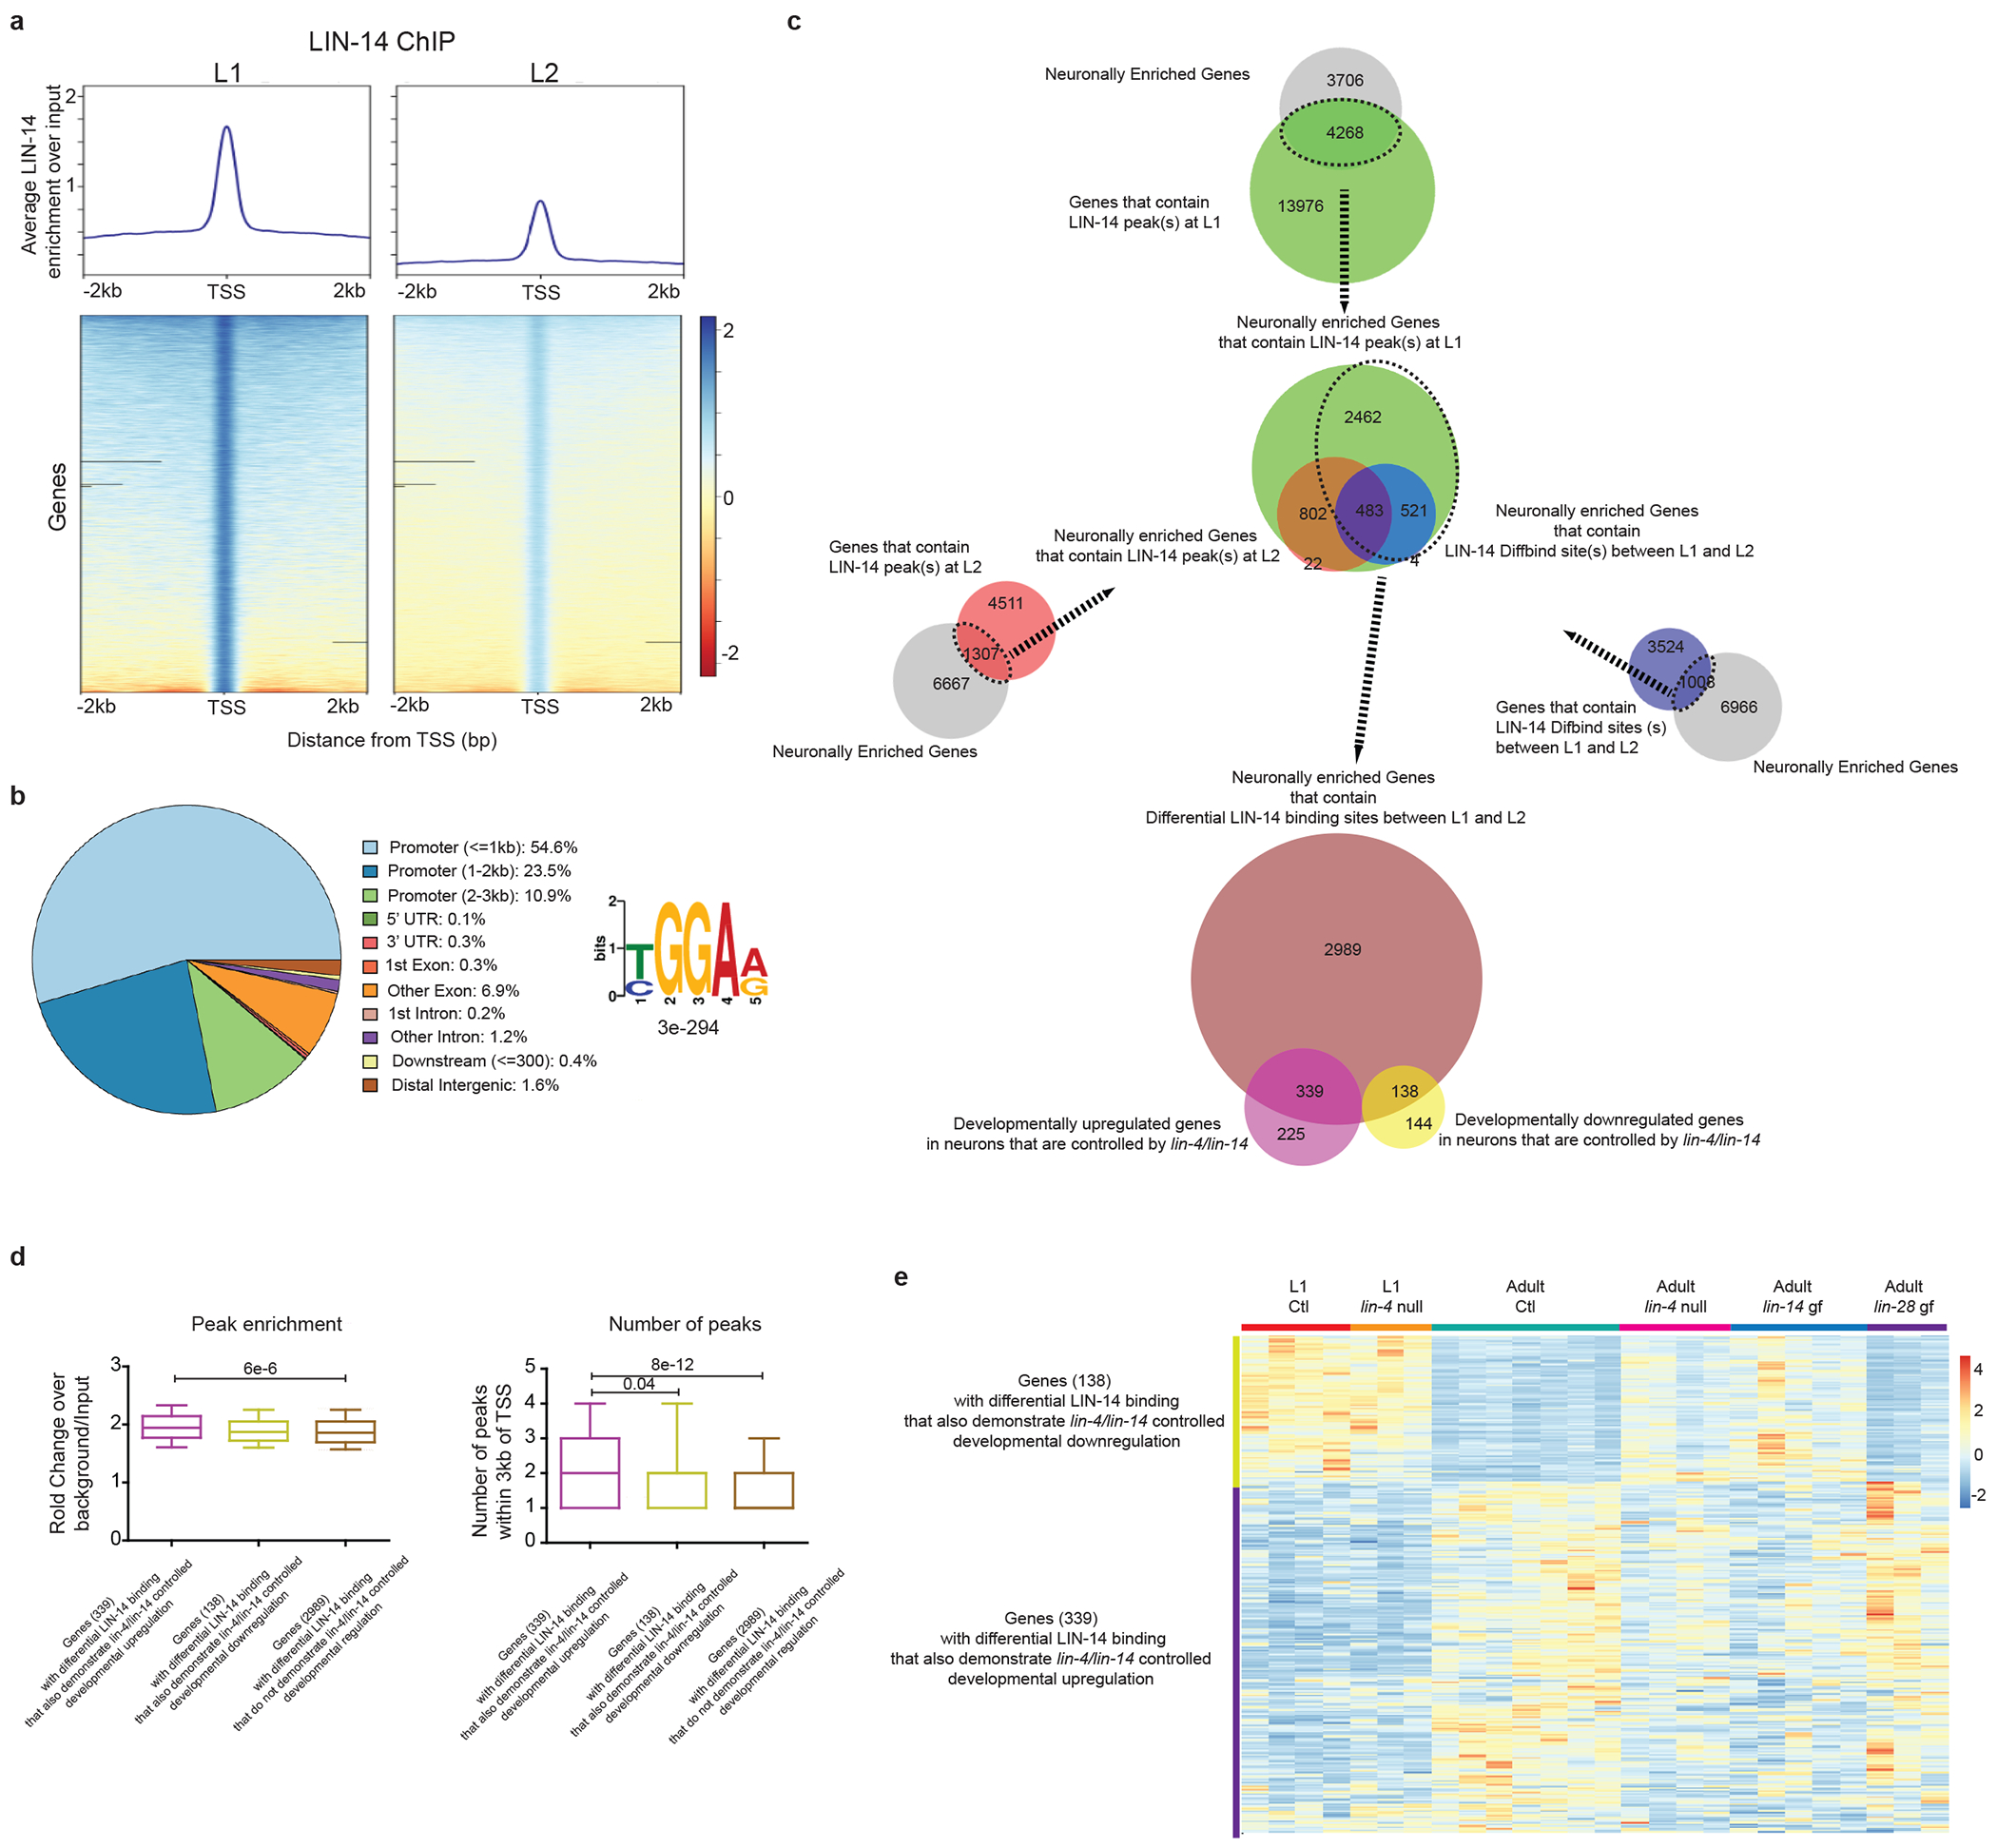
a, Decreased LIN-14 binding at promoters of target genes during the L1 -> L2 transition. Normalized datasets at each developmental stage against respective inputs are generated using the bamCompare function of deepTools2 54. LIN-14 enrichment around TSS +/− 2kb is then computed using the computeMatrix function and plotted using the plotHeatmap function of deepTools2 54. b, LIN-14 ChIP-seq peak distribution and motif across L1 and L2 animals. The ChIP-seq peak distribution on the left is plotted using ChIPseeker 47. The consensus binding motif on the right is obtained using MEME-ChIP 48. c, Amalgamation of different methods of assessing differential LIN-14 binding across the L1->L2 transition. Outer three Venn Diagrams on the top are the 32990 LIN-14 peaks in L1 animals within 3kb of the TSS of 18245 genes (green, Supplementary Table 8), the 7240 LIN-14 peaks in L2 animals within 3kb of the TSS of 5818 genes (red, Supplementary Table 9), and the 5267 differential L1 vs L2 LIN-14 binding within 3kb of the TSS of 4532 genes (blue, as determined by DiffBind, Supplementary Table 10), each overlapped with the 7974 neuronally enriched genes. These neuronally-enriched peaks in L1 (green), peaks in L2 (red) and differential L1 vs L2 binding (blue) were overlapped in the middle Venn Diagram to result in the 3466 genes (Supplementary Table 11) that show differential (mostly decreased) L1 vs L2 binding. These 3466 genes overlapped with 339 (60%) of the lin-4/lin-14 controlled developmentally upregulated genes and 138 (49%) of the lin-4/lin-14 controlled developmentally downregulated genes. d, The 339 genes that showed developmental upregulation (LIN-14 as a repressor) had increased LIN-14 peak enrichment and number of LIN-14 peaks within 3kb of TSS as compared to the 138 genes that showed developmental downregulation (LIN-14 as an activator) or the 2989 genes that show no developmental regulation. Box Whisker plots (10-90 percentile) are used, and post-hoc two-sided t-test p values are shown for the comparisons. e, Heatmap of the developmental up-/down-regulated genes that also had differential LIN-14 binding from c across development (L1 and adult) and genotype (Control[Ctl] and lin-4/lin-14 mutants). Values were z-score normalized and plotted using pheatmap in R studio. Each row represents a single gene, and each column represents a single RNA-seq replicate. The rows are clustered according to gene expression patterns.
Extended Data Fig 9. lin-4/lin-14 control developmental regulation of neuropeptide-encoding and receptor-type guanylyl cyclase (rGC) genes.
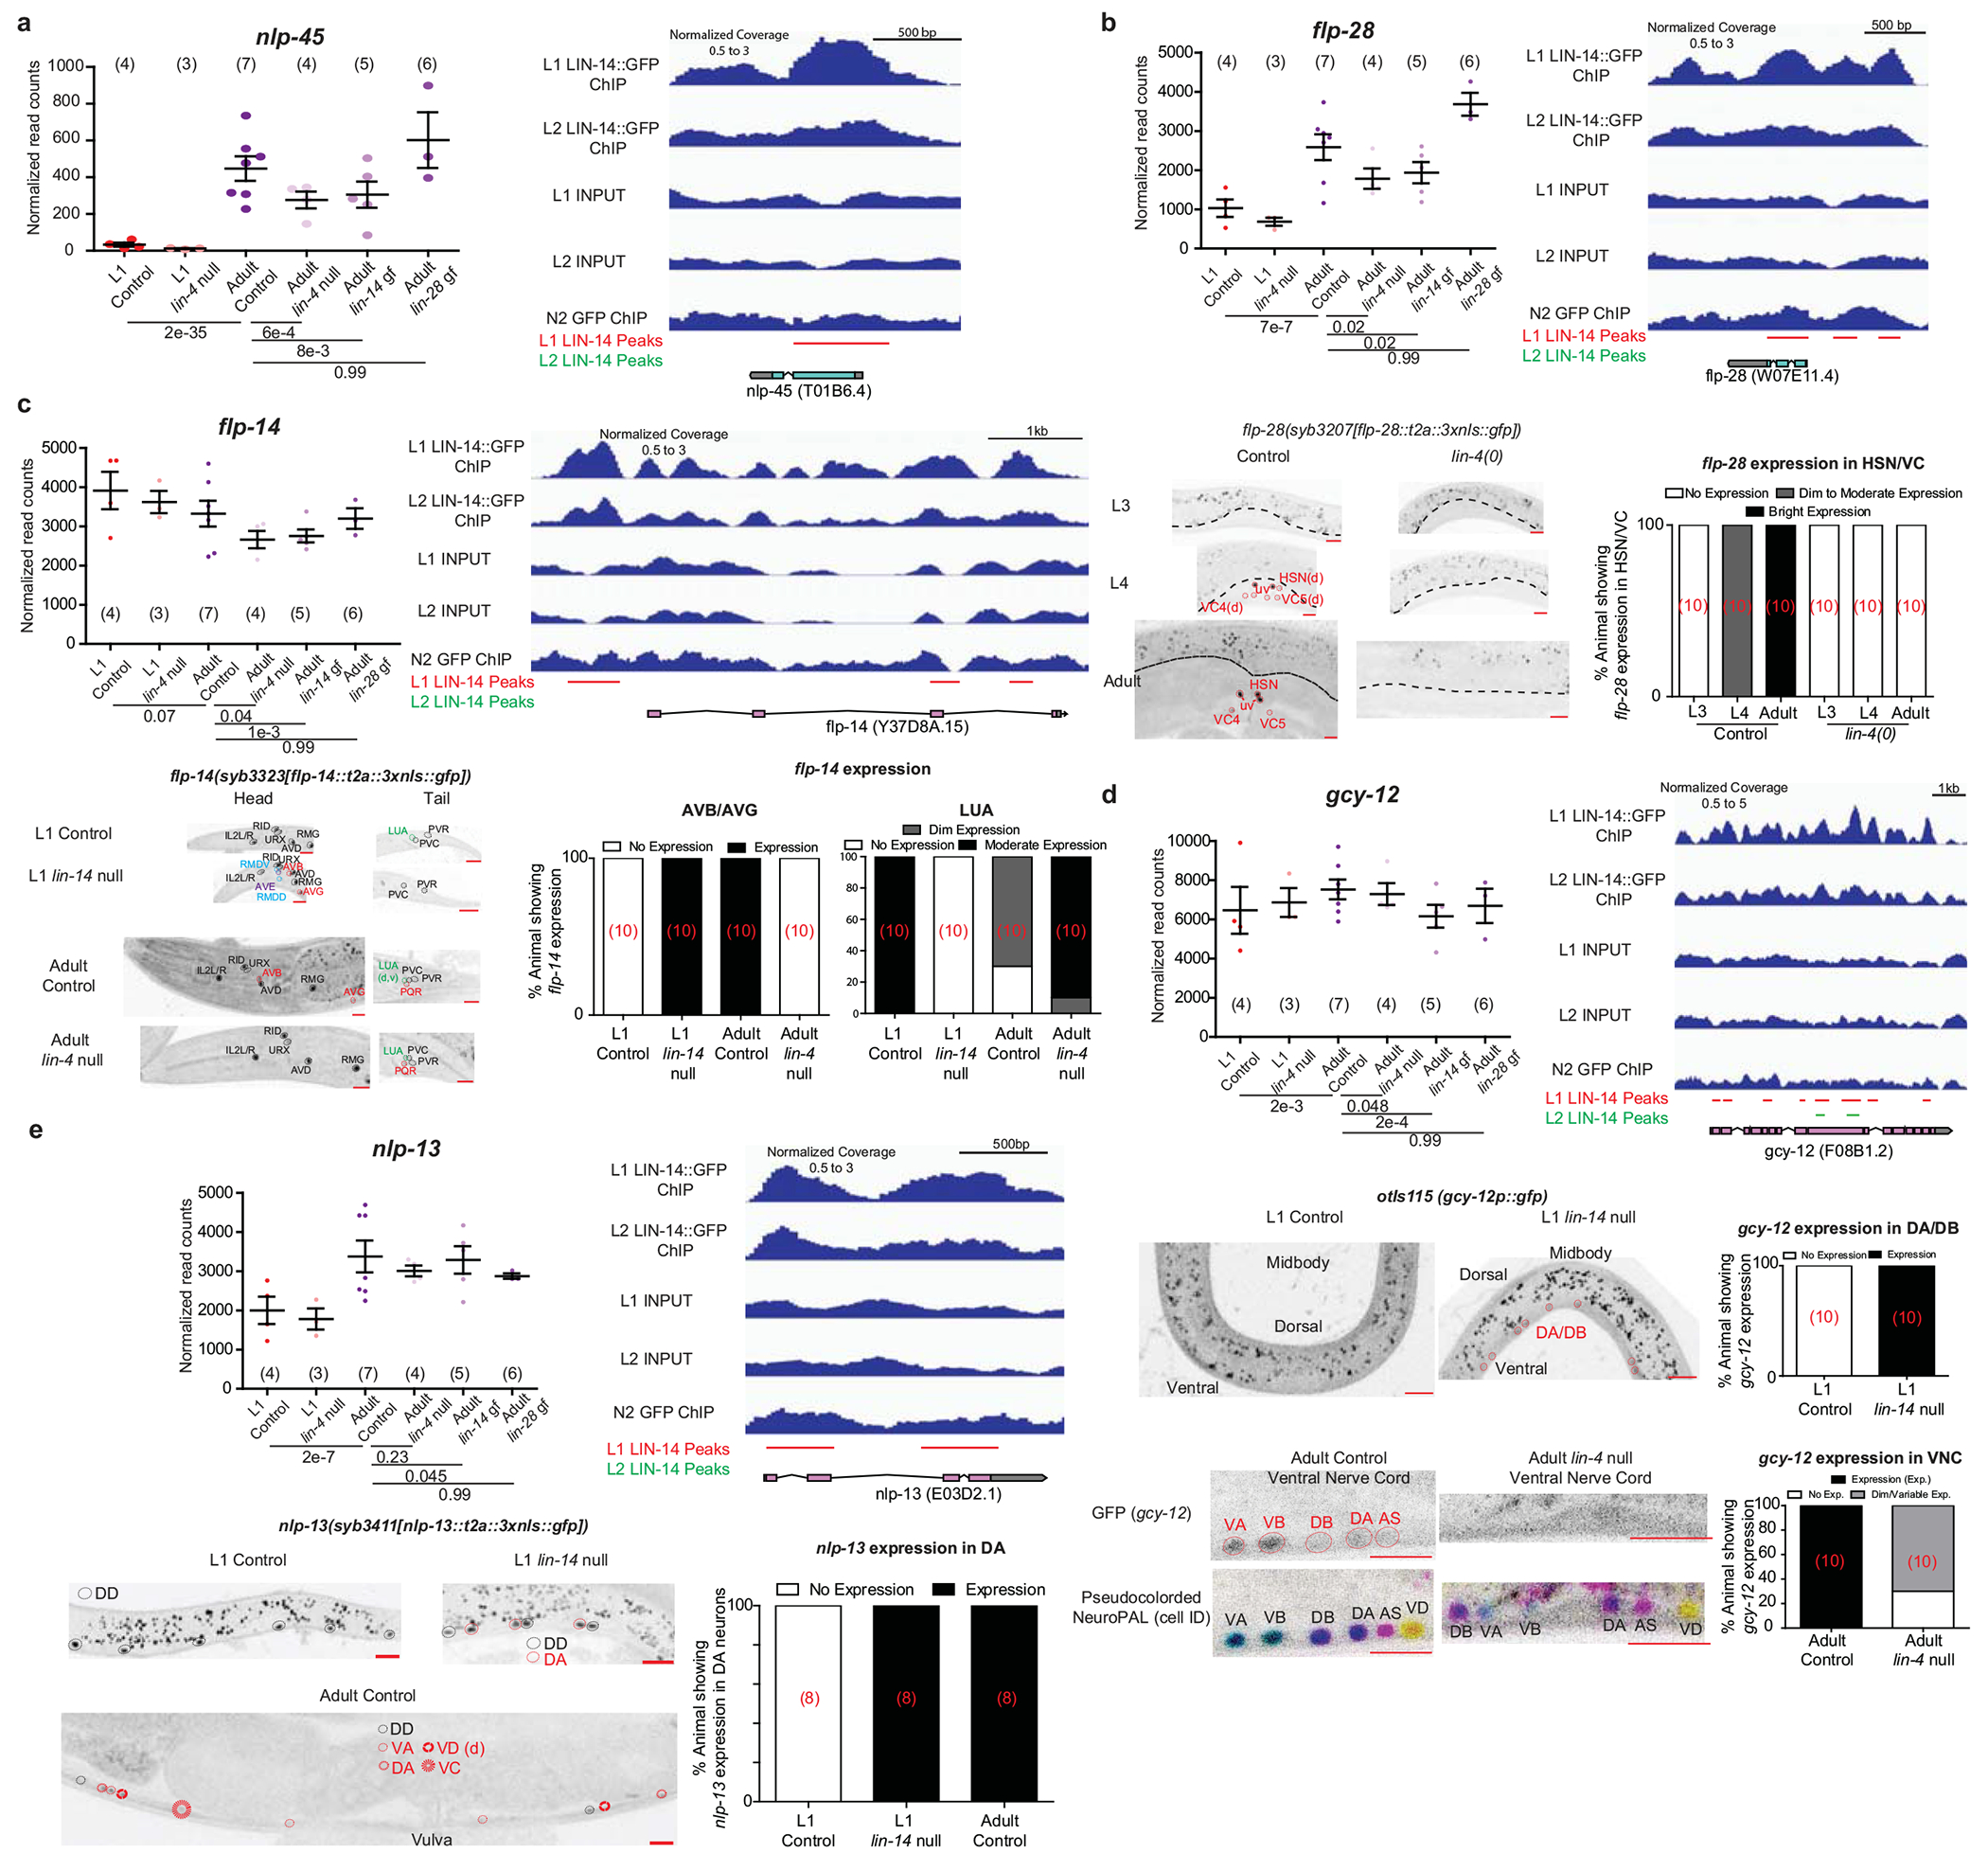
For all panels, the plots with normalized RNA-seq read counts for the L1/adult control/heterochronic mutant animals are plotted, with each point representing a replicate (n in bracket) and the mean +/− SEM shown for each stage, on the upper left. Adjusted p values (padj), as calculated by DESeq2, for each comparison are below. lin-4 null/lin-14 gain of function mutations juvenize the expression of all four genes. LIN-14 ChIP-seq binding at each gene is shown on the upper right. All samples from their respective experimental conditions are merged for their respective tracks in IGV. Decrease in LIN-14 binding during the L1->L2 transition is observed for all 4 genes. Representative confocal images under control and mutant conditions are shown in the bottom left. d in brackets denote dim expression, while v in brackets denote variable expression. Red scale bars (10μm) are on the bottom right of all representative images. Quantification of the images are shown on the bottom right (number of animals for each condition is shown in red brackets). a, Juvenization of nlp-45 expression by lin-4/lin-14 across development as predicted from the neuronal INTACT/RNA-seq profiling and LIN-14 ChIP-seq binding at the nlp-45 gene. Representative images are shown in Fig. 3a. b, flp-28 expression is gained in hermaphrodite specific neurons (HSN, VC) during transition into late larval/adult stages while the same developmental upregulation is not observed in lin-4 null mutants. flp-28 expression in head/tail neurons is not regulated in lin-4 null animals (images not shown). Control images are taken from Extended Data Fig.3f. c, flp-14 loses and gains expression in one (LUA, outlined in green) and two (AVB and AVG, outlined in red) classes of neurons as it enters late larval/adult stages, respectively. flp-14 expression is de-repressed in the AVB and AVG neurons in L1 lin-14 null animals while flp-14 expression is repressed in the LUA neurons in L1 lin-14 null animals. Consistently, flp-14 expression in the AVB and AVG neurons are repressed in adult lin-4 null animals while flp-14 expression is increased in the LUA neuron as compared to adult control animals. flp-14 expression is also weakly de-repressed in two classes of neurons that express flp-14 in the adult male (RMDD/V, outlined in blue) and one additional class of neuron (AVE, outlined in purple) in L1 lin-14 null animals. Control images are taken from Extended Data Fig.3i. d, gcy-12 gains expression in the A and B type motor neurons across mid/late larval development. gcy-12 expression in the A and B type motor neurons is de-repressed in lin-14 null L1 animals while gcy-12 expression in the A and B type motor neurons is repressed in the lin-4 null adult animals as compared to respective control animals. gcy-12 expression in head/tail neurons is not regulated in lin-4 null animals (images not shown). e, nlp-13 gains expression in the ventral nerve cord neurons (DA, VA, VD, VC) across development. nlp-13 expression in the DA neurons is de-repressed in lin-14 null L1 animals as compared to L1 control animals. Control L1 and adult images are taken from Extended Data Fig.3j.
Extended Data Fig 10. Regulation and function of nlp-45 across temporal, sexual, and environmental dimensions of post-embryonic development.
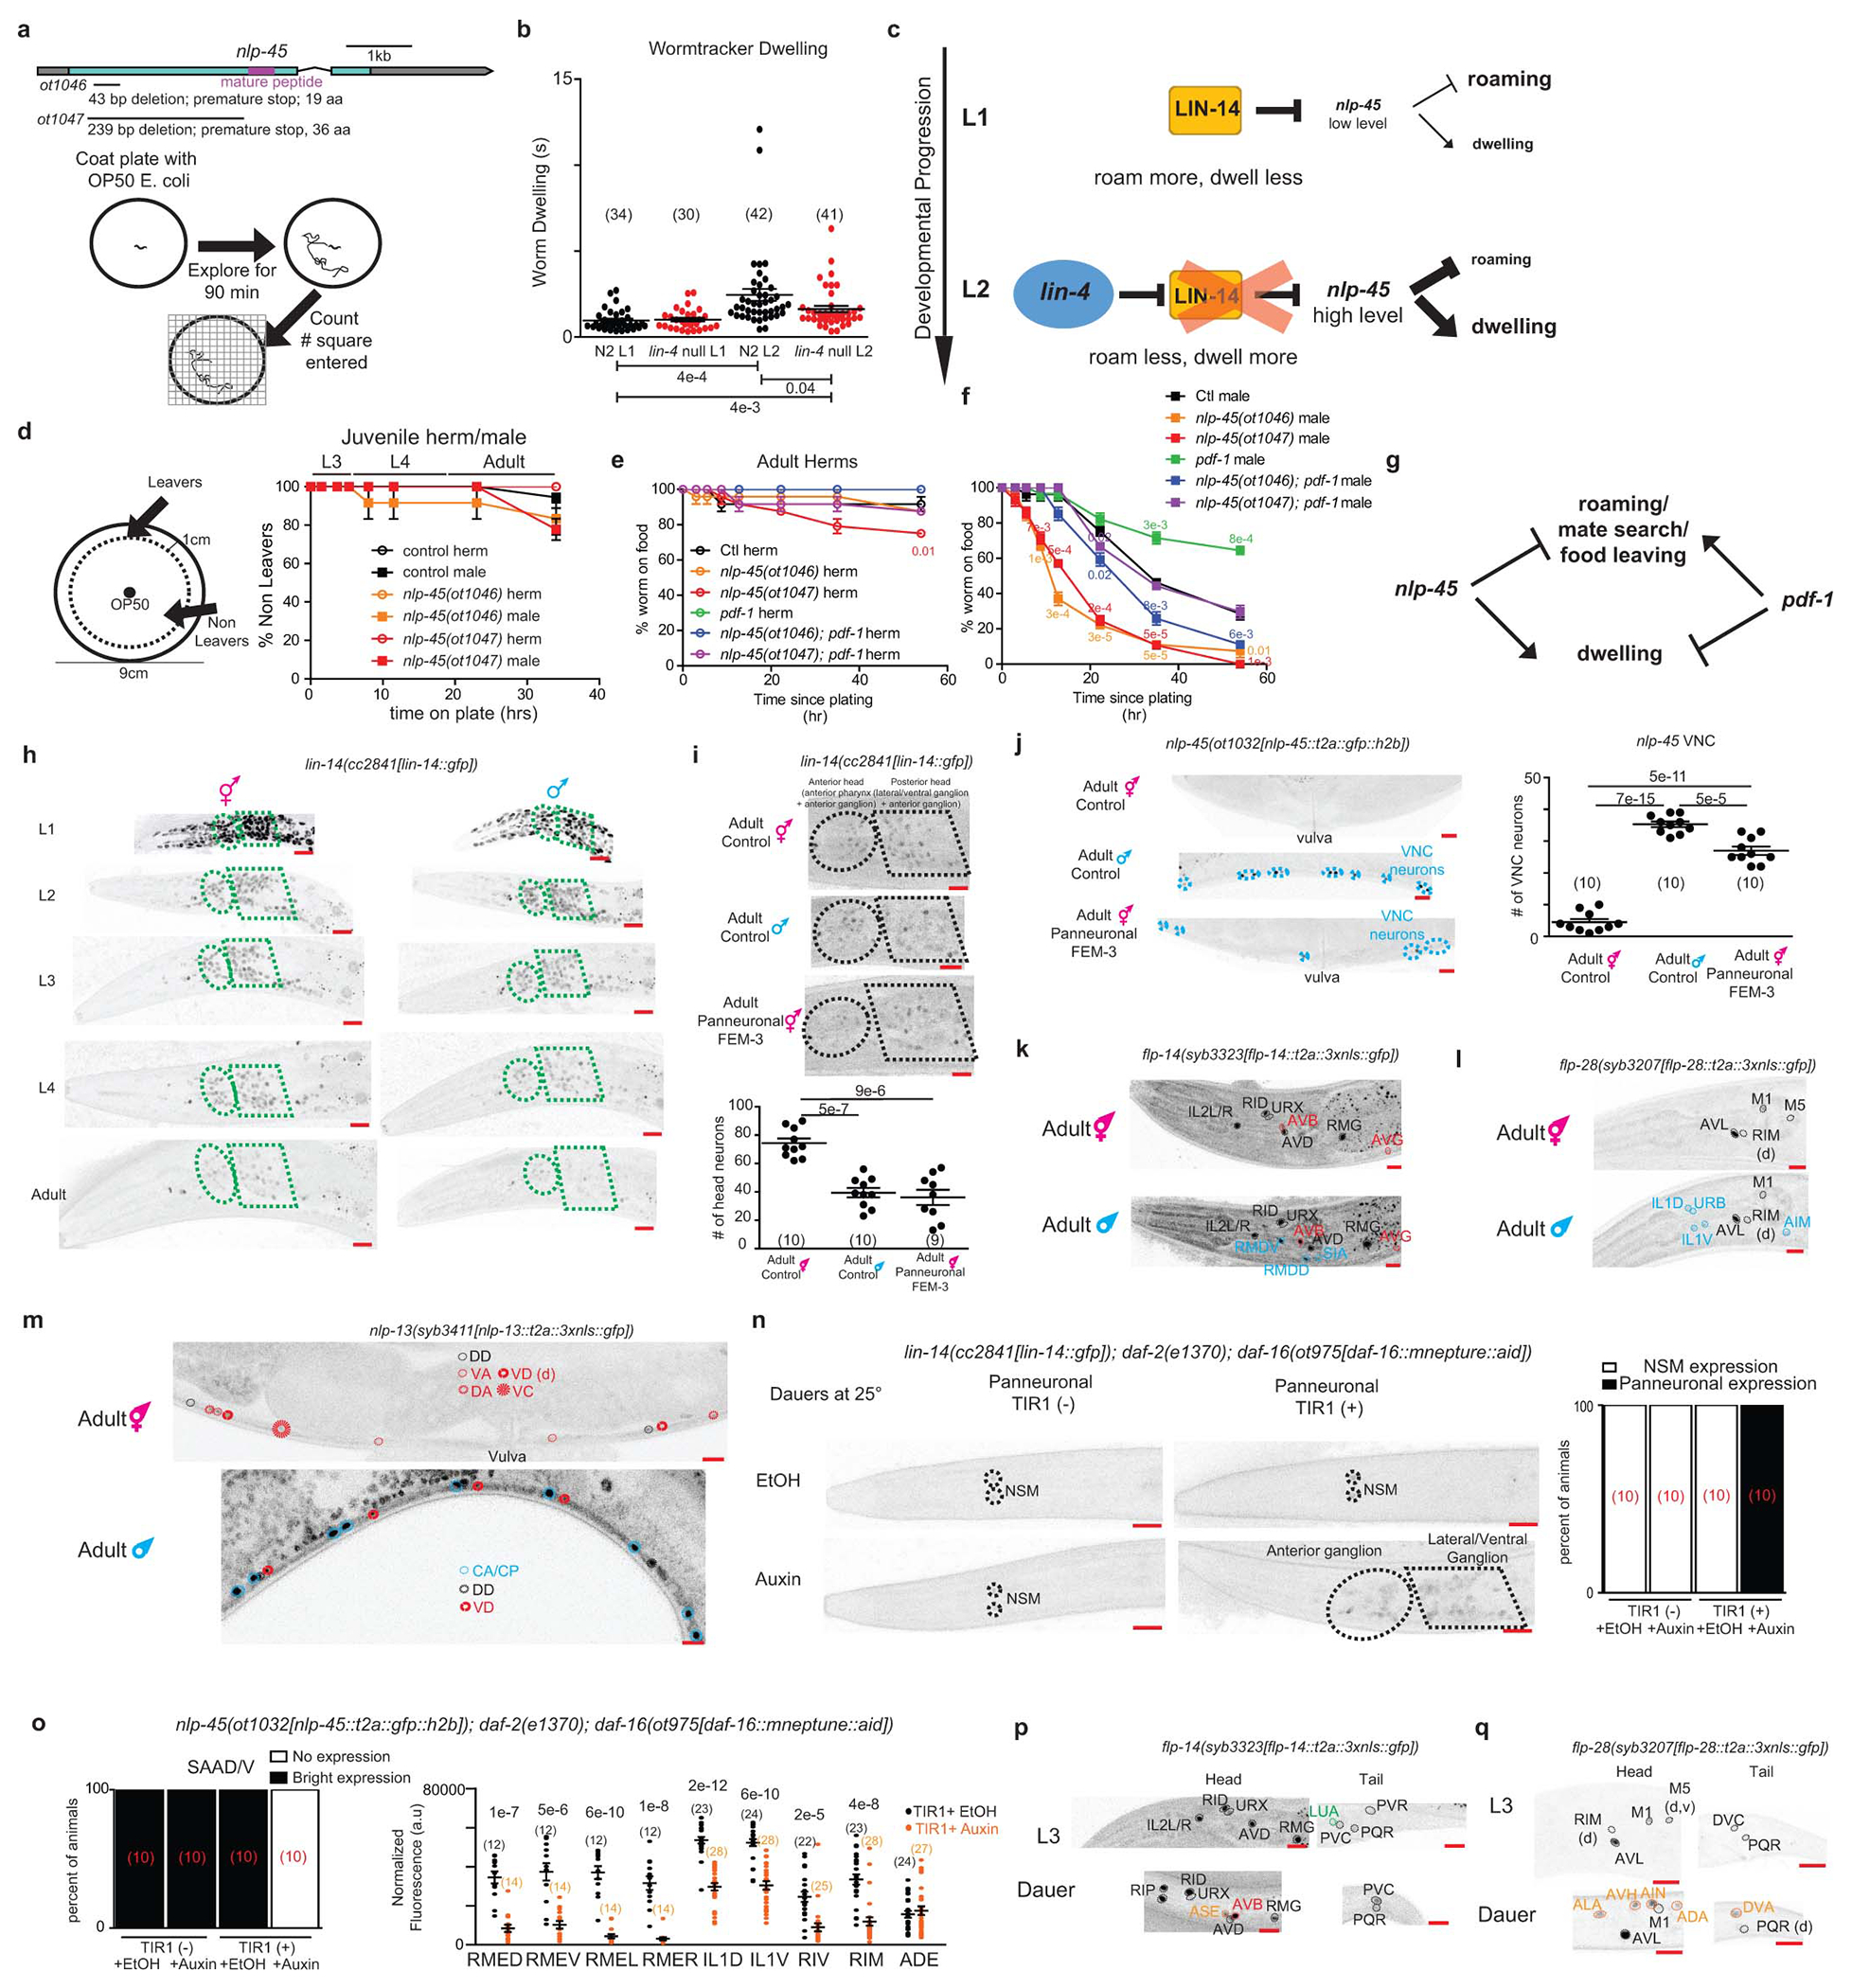
a, Schematic of nlp-45 deletion mutants and exploratory assay. b, Increased dwelling during L1->L2 transition is partially juvenized in lin-4(e912) animals. Mean +/− SEM and n (in bracket) are shown for each condition, and each point of the scatter dot plot represents a single animal. Wilcoxon rank-sum tests and false-discovery rate q values for each comparison shown below. c, Schematic showing lin-4/lin-14 regulation of nlp-45 to alter exploratory behavior during the L1>L2 transition. d, nlp-45 deletion mutants do not significantly affect the food leaving behaviors of juvenile males/hermaphrodites. Values were plotted as mean +/− SEM of three independent experiments (n=6 animals per independent experiments). e, Leaving assay for adult hermaphrodite in nlp-45 and pdf-1 mutant animals. Values were plotted as mean +/− SEM of three independent experiments (n= 8 animals per independent experiments). Statistical analysis (post-hoc two-sided t-test) is only shown for the comparison to respective controls (color coded respectively). f, Leaving assay for adult male in nlp-45 and pdf-1 mutant animals. Values plotted as mean +/− SEM of three independent experiments (n= 8 animals per independent experiments). Statistical analysis (post-hoc two-sided t-test) is only shown for the comparison to respective controls (color coded respectively). g, Schematic of the opposing role of nlp-45 and pdf-1 on male food leaving behavior. h, Developmental expression of lin-14 in hermaphrodites and males. Representative images for the lin-14(cc2841[lin-14::gfp]) reporter are shown across all developmental stages for both sexes. LIN-14 expression was similarly downregulated in both sexes at early larval stages, its expression in the late larval and particularly in the adult stage was significantly more reduced in the male nervous system compared to that of the hermaphrodite. Ellipse and polygon outline anterior and lateral/ventral neuronal ganglia. Representative images for hermaphrodite are re-used here from Extended Data Fig.5b for direct side by side comparison with male animals across development. i, Panneuronal depletion of sex determination master regulator TRA-1, through overexpression of FEM-3, decreases nervous system LIN-14 expression in adult hermaphrodites to mimic that of adult males. Representative microscope images, shown above, are overexposed in comparison to previous lin-14 reporter images to better show the dim expression in adult males and FEM-3 overexpressed hermaphrodites. The quantifications of head neuron numbers across the three conditions are shown below. The mean +/− SEM and n (in bracket) shown for each condition, and each point of the scatter dot plot represents a single animal. Post-hoc two-sided t-test p values are shown for each comparison. j, Panneuronal depletion of TRA-1, through overexpression of FEM-3, masculinizes nlp-45 expression in adult hermaphrodite VNC. Representative images are shown on the left. Quantifications of VNC neuron numbers are shown on the right. The mean +/− SEM and n (in bracket) are shown for each condition, and each point of the scatter dot plot represents a single animal. Post-hoc two-sided t-test p values are shown for each comparison. k, Sexually dimorphic expression of flp-14 in adult hermaphrodites and males. In addition to stronger flp-14 expression in the AVB neuron (red) as compared to adult hermaphrodites, adult males gain flp-14 expression in the RMDD/V and SIA neurons (blue). Adult hermaphrodite images are re-used from Extended Data Fig.3i. l, Sexually dimorphic expression of flp-28 in adult hermaphrodites and males. As compared to adult hermaphrodites, adult males gain flp-28 expression in the IL1D/V, URB, and AIM neurons (blue). Adult hermaphrodite images are re-used from Extended Data Fig.3f. m, Sexually dimorphic expression of nlp-13 in adult hermaphrodites and males. In addition to stronger nlp-13 expression in the VD neurons (red) as compared to adult hermaphrodites, adult males gain nlp-13 expression in the male specific CA/CP motor neurons (blue) and lose nlp-13 expression in the DA, VA and hermaphrodite specific VC motor neurons. Adult hermaphrodite images are re-used from Extended Data Fig.3j. n, Panneuronal degradation of DAF-16 in auxin-treated dauers leads to panneuronal de-repression of lin-14 in dauer animals. Representative images are on the left while binary quantifications of panneuronal expression are shown on the right (number of animals for each condition is shown in red brackets). Animals were grown (from embryo onward) on NGM plates supplemented with OP50 and 4mM auxin in EtOH (indole-3 acetic acid, IAA, Alfa Aesar) at 25°C to degrade DAF-16 panneuronally and to induce dauer formation. As controls, plates were supplemented with the solvent EtOH instead of auxin. Additional control animals without panneuronal TIR-1 expression grown on EtOH and auxin were also included for comparison. o, Panneuronal degradation of DAF-16 in auxin-treated dauers leads to a loss or reduced nlp-45 expression in several neuronal classes. Representative images are shown in Fig. 4f. Binary quantifications are shown for the SAAD/V neurons (number of animals for each condition is shown in red brackets) while fluorescence quantifications are shown for the RMED/V, RMEL/R, IL1D/V, RIV, RIM, and ADE neurons. The mean +/− SEM and n (in bracket) are shown for each condition, and each point of the scatter dot plot represents a single animal. Post hoc two-sided t-test p values are shown for each comparison. p, Expression of flp-14 in dauer animals as compared to L3 animals. Upon entry into dauer, similar to expression pattern in the adult hermaphrodite/male, animals gain flp-14 expression in the AVB neurons (red) and lose flp-14 expression in the LUA neurons (green). Additional dauer specific flp-14 expression is gained in the ASE neurons (orange). Expression in the PVR neurons is also lost in dauer animals. L3 hermaphrodite images are re-used from Extended Data Fig.3i. q, Expression of flp-28 in dauer animals as compared to L3 animals. Upon entry into dauer, animals gain flp-28 expression in the ALA, AVH, AIN, ADA, and DVA neurons (labelled in orange) and lose flp-28 expression in the DVC neurons. L3 hermaphrodite images are re-used from Extended Data Fig.3f. d and v in brackets denote dim and variable expression, respectively. Scale bars = 10μm.
Extended Data Fig 11. Terminal selector provides spatial specificity to nlp-45 expression pattern.
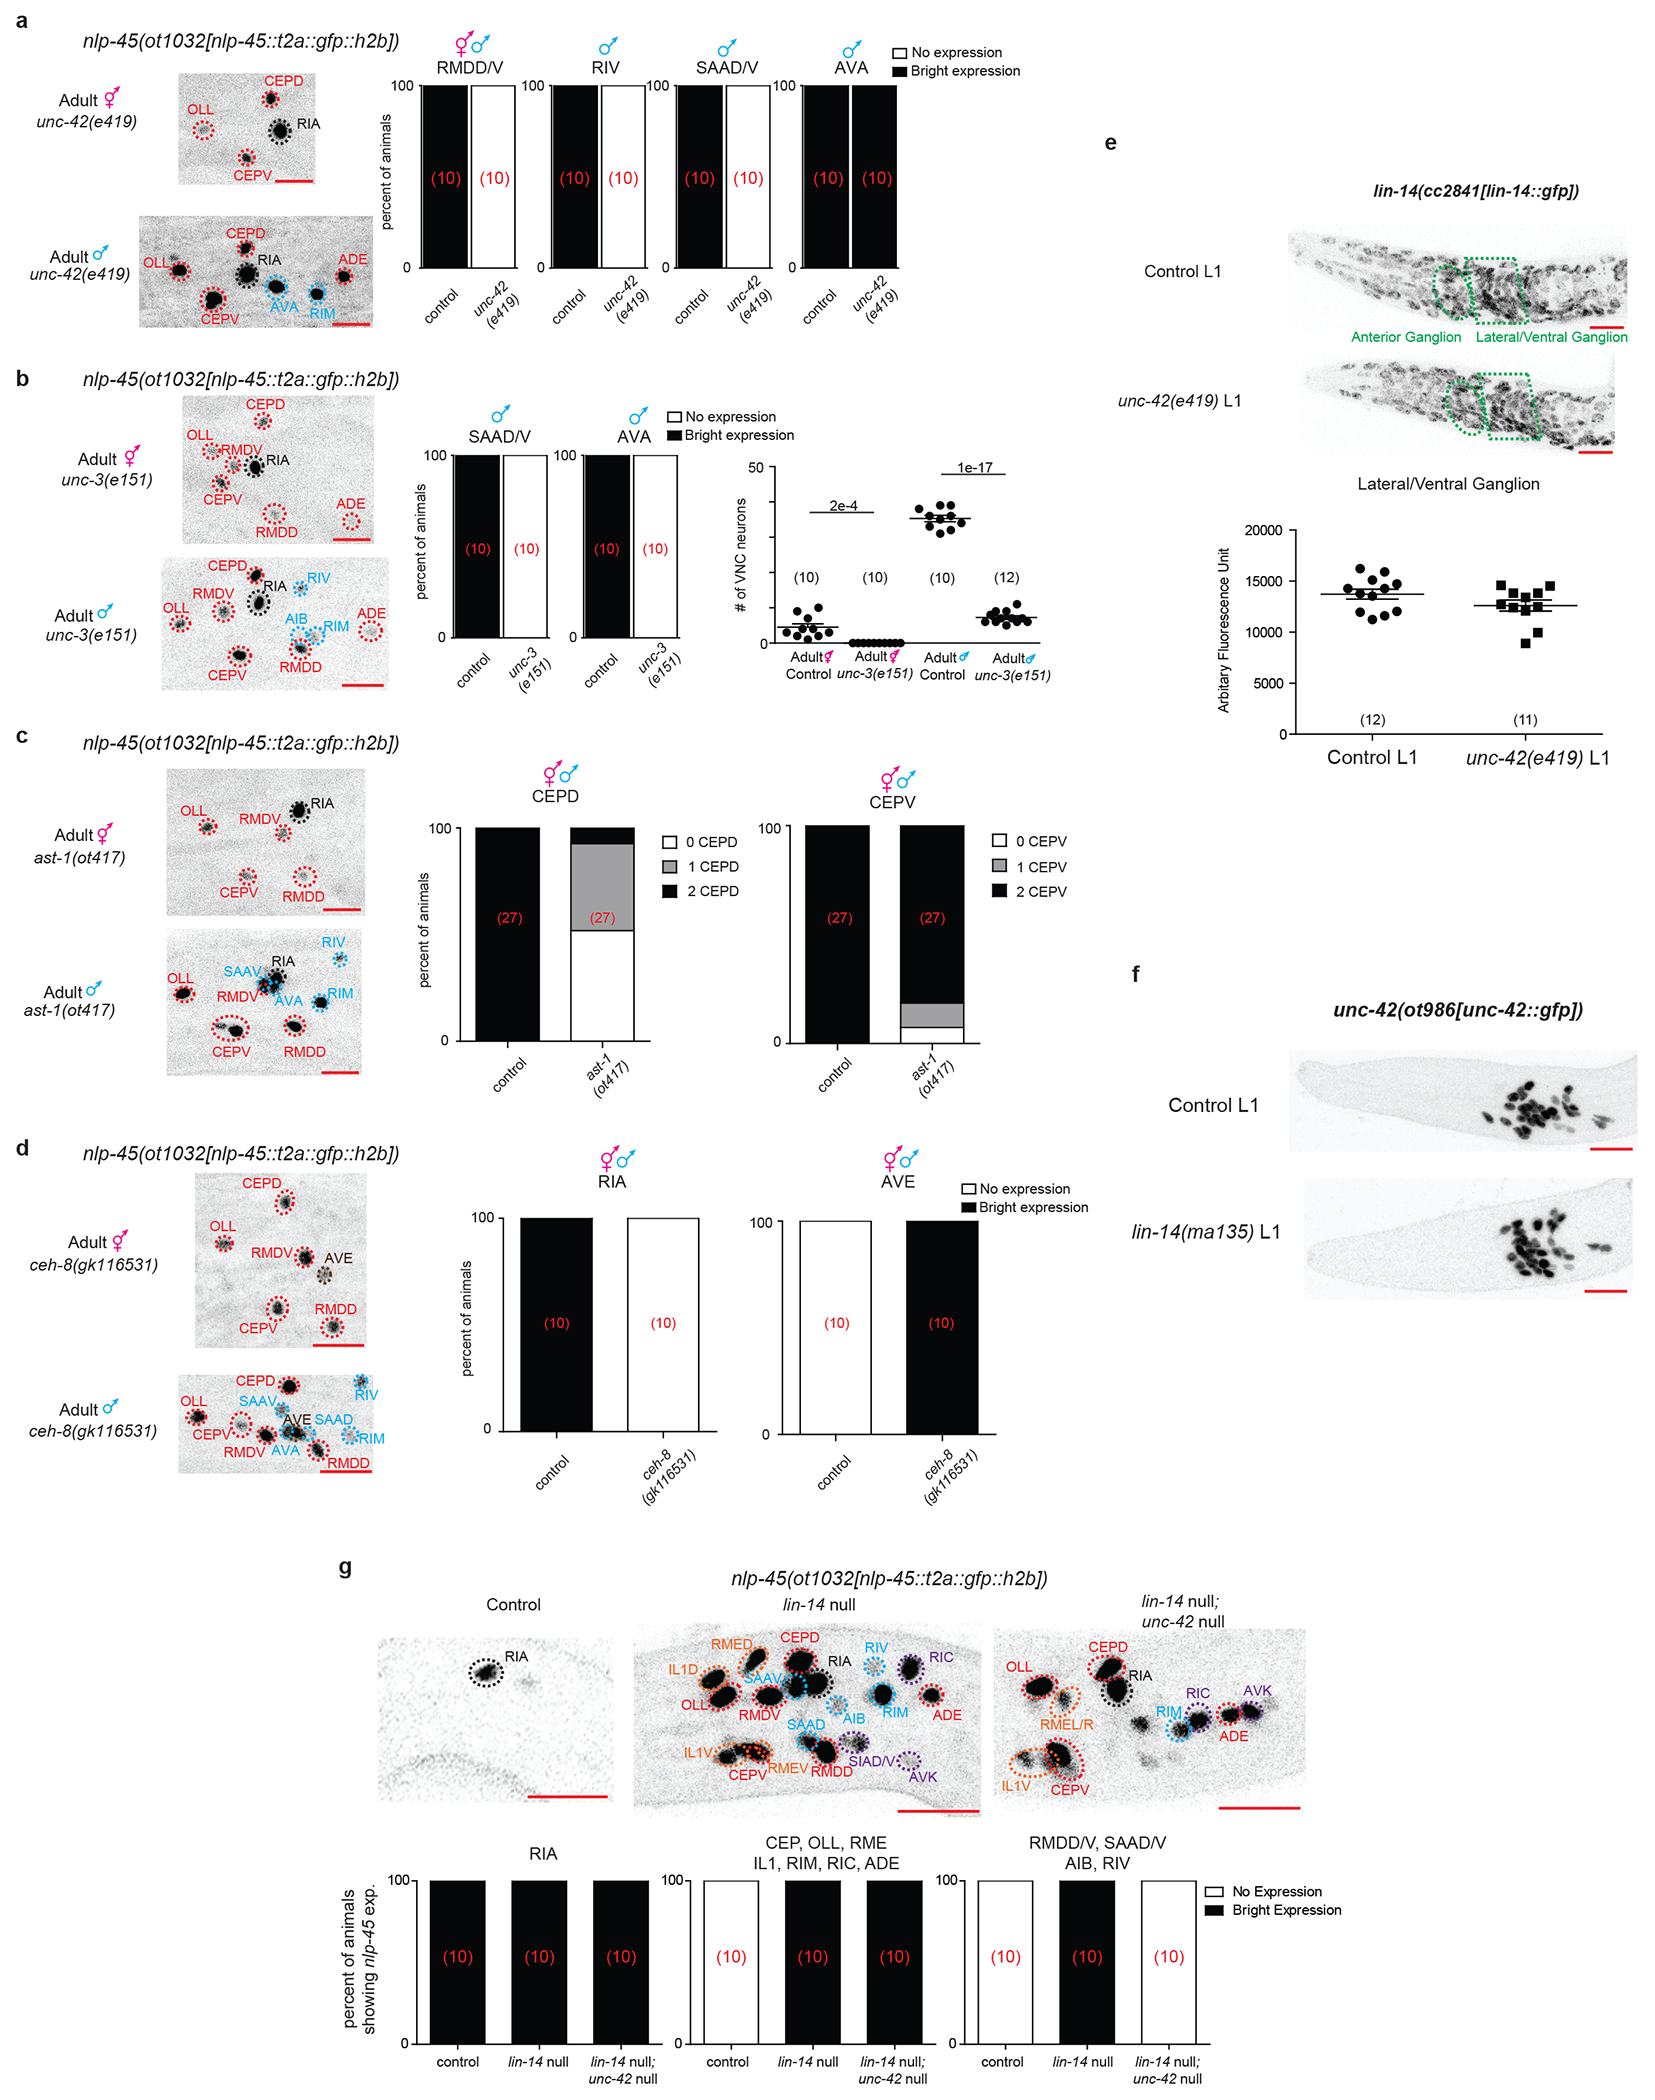
a, Regulation of nlp-45 by cell specific regulator, unc-42. Representative images of adult unc-42(e419) hermaphrodite and male animals are shown on the left while binary quantifications of nlp-45 expression in the RMDD/V, RIV, SAAD/V and AVA neurons are shown on the right (number of animals for each condition is shown in red brackets). nlp-45 expression was lost in all unc-42 expressing neurons with the exception of AVA in unc-42 mutant animals. b, Regulation of nlp-45 by cell specific regulator, unc-3. Representative images of adult unc-3(e151) hermaphrodite and male animals are shown on the left while binary quantifications of nlp-45 expression in the SAAD/V and AVA neurons are shown in the middle (number of animals for each condition is shown in red brackets). The quantification of ventral nerve cord (VNC) motor neurons is shown on the right. n (in bracket) and post-hoc two-sided t-test p values are shown. Each point of the scatter dot plot represents a single animal. nlp-45 expression was lost in unc-3 expressing head neurons (i.e. SAAD/V, AVA) while severely affected in the VNC in unc-3 mutant animals. c, Regulation of nlp-45 by cell specific regulator, ast-1. Representative images of adult ast-1(ot417) hypomorph hermaphrodite and male animals are shown on the left while quantifications of nlp-45 expression in the CEPD and CEPV neurons are shown on the right (number of animals for each condition is shown in red brackets). nlp-45 expression was severely affected in the CEPD neurons and slightly affected in the CEPV neurons in the ast-1 mutant animals. d, Regulation of nlp-45 by cell specific regulator, ceh-8. Representative images of adult ceh-8(gk116531) hermaphrodite and male animals are shown on the left while binary quantifications of nlp-45 expression in the RIA and AVE neurons are shown on the right (number of animals for each condition is shown in red brackets). nlp-45 expression is lost in the RIA neurons and ectopically gained in the AVE neurons in ceh-8 mutant animals. e, Terminal selector (unc-42) does not regulate heterochronic pathway (lin-14). On the left are representative images of L1 lin-14 translational GFP allele worms in control and unc-42(e419) backgrounds. On the right is the quantification of fluorescence intensity in the lateral/ventral ganglion of control vs unc-42(e419) L1 animals. The mean +/− SEM and n (in bracket) are shown for each condition, and each point of the scatter dot plot represents a single animal. f, Heterochronic pathway (lin-14) does not regulate terminal selector (unc-42). Representative images of L1 unc-42 translational GFP allele worms in control and lin-14(ma135) null backgrounds are shown. g, On top are representative images of the nlp-45 expression reporter in control, lin-14(0), and lin-14(0); unc-42(0) L1 animals. On the bottom is are the binary quantifications of nlp-45 expression in different neuronal subtypes in control, lin-14(0), and lin-14(0); unc-42(0) L1 animals (number of animals for each condition is shown in red brackets). nlp-45 showed precocious expression in lin-14, unc-42 double mutants, similar to the lin-14 null mutant alone, except in the neurons (i.e. RMDD/V, SAAD/V) where unc-42 acts as a terminal selector.
Supplementary Material
ACKNOWLEDGMENTS
We thank Qi Chen and Abhishek Bhattacharya for generating transgenic lines, Dylan Rahe for help with INTACT optimization, Alex Romero and Eviatar Yemini for help with worm tracking, Luisa Cochella, Michael P Hart, Isabel Beets and members of the Hobert lab for comments on the manuscript, Wormbase and CGC for providing resources and reagents. This work was funded by the NIH K99 HD098371, National Research Council of Canada (Holmes Award), and by the Howard Hughes Medical Institute. Some strains were provided by the CGC, which is funded by the NIH Office of Research Infrastructure Program (P40 OLD010440).
Footnotes
DECLARATION OF INTERESTS
The authors declare no competing interests.
Supplementary information is available for this paper.
DATA AVAILABILITY
Raw and processed RNA-seq data is available at GEO accession #GSE158274. Raw and processed ChIP-seq data is available at GEO accession #GSE181288.
REFERENCES
- 1.Cadwell CR, Bhaduri A, Mostajo-Radji MA, Keefe MG & Nowakowski TJ Development and Arealization of the Cerebral Cortex. Neuron 103, 980–1004, doi: 10.1016/j.neuron.2019.07.009 (2019). [DOI] [PMC free article] [PubMed] [Google Scholar]
- 2.Gogtay N et al. Dynamic mapping of human cortical development during childhood through early adulthood. Proc Natl Acad Sci U S A 101, 8174–8179, doi: 10.1073/pnas.0402680101 (2004). [DOI] [PMC free article] [PubMed] [Google Scholar]
- 3.Okaty BW, Miller MN, Sugino K, Hempel CM & Nelson SB Transcriptional and electrophysiological maturation of neocortical fast-spiking GABAergic interneurons. J Neurosci 29, 7040–7052, doi: 10.1523/JNEUROSCI.0105-09.2009 (2009). [DOI] [PMC free article] [PubMed] [Google Scholar]
- 4.Bakken TE et al. A comprehensive transcriptional map of primate brain development. Nature 535, 367–375, doi: 10.1038/nature18637 (2016). [DOI] [PMC free article] [PubMed] [Google Scholar]
- 5.Kang HJ et al. Spatio-temporal transcriptome of the human brain. Nature 478, 483–489, doi: 10.1038/nature10523 (2011). [DOI] [PMC free article] [PubMed] [Google Scholar]
- 6.Spitzer NC Electrical activity in early neuronal development. Nature 444, 707–712, doi: 10.1038/nature05300 (2006). [DOI] [PubMed] [Google Scholar]
- 7.Stroud H et al. An Activity-Mediated Transition in Transcription in Early Postnatal Neurons. Neuron 107, 874–890 e878, doi: 10.1016/j.neuron.2020.06.008 (2020). [DOI] [PMC free article] [PubMed] [Google Scholar]
- 8.Cepko CL The roles of intrinsic and extrinsic cues and bHLH genes in the determination of retinal cell fates. Curr Opin Neurobiol 9, 37–46, doi: 10.1016/s0959-4388(99)80005-1 (1999). [DOI] [PubMed] [Google Scholar]
- 9.Holguera I & Desplan C Neuronal specification in space and time. Science 362, 176–180, doi: 10.1126/science.aas9435 (2018). [DOI] [PMC free article] [PubMed] [Google Scholar]
- 10.Miyares RL & Lee T Temporal control of Drosophila central nervous system development. Curr Opin Neurobiol 56, 24–32, doi: 10.1016/j.conb.2018.10.016 (2019). [DOI] [PubMed] [Google Scholar]
- 11.Pearson BJ & Doe CQ Specification of temporal identity in the developing nervous system. Annu Rev Cell Dev Biol 20, 619–647 (2004). [DOI] [PubMed] [Google Scholar]
- 12.Witvliet D et al. Connectomes across development reveal principles of brain maturation. Nature 596, 257–261, doi: 10.1038/s41586-021-03778-8 (2021). [DOI] [PMC free article] [PubMed] [Google Scholar]
- 13.Yemini E, Jucikas T, Grundy LJ, Brown AE & Schafer WR A database of Caenorhabditis elegans behavioral phenotypes. Nat Methods 10, 877–879, doi: 10.1038/nmeth.2560 (2013). [DOI] [PMC free article] [PubMed] [Google Scholar]
- 14.Steiner FA, Talbert PB, Kasinathan S, Deal RB & Henikoff S Cell-type-specific nuclei purification from whole animals for genome-wide expression and chromatin profiling. Genome Res 22, 766–777, doi: 10.1101/gr.131748.111 (2012). [DOI] [PMC free article] [PubMed] [Google Scholar]
- 15.Ambros V & Horvitz HR Heterochronic mutants of the nematode Caenorhabditis elegans. Science 226, 409–416 (1984). [DOI] [PubMed] [Google Scholar]
- 16.Rougvie AE & Moss EG Developmental transitions in C. elegans larval stages. Curr Top Dev Biol 105, 153–180, doi: 10.1016/B978-0-12-396968-2.00006-3 (2013). [DOI] [PubMed] [Google Scholar]
- 17.Feinbaum R & Ambros V The timing of lin-4 RNA accumulation controls the timing of postembryonic developmental events in Caenorhabditis elegans. Dev Biol 210, 87–95, doi: 10.1006/dbio.1999.9272 (1999). [DOI] [PubMed] [Google Scholar]
- 18.Ruvkun G & Giusto J The Caenorhabditis elegans heterochronic gene lin-14 encodes a nuclear protein that forms a temporal developmental switch. Nature 338, 313–319 (1989). [DOI] [PubMed] [Google Scholar]
- 19.Marder E Neuromodulation of neuronal circuits: back to the future. Neuron 76, 1–11, doi: 10.1016/j.neuron.2012.09.010 (2012). [DOI] [PMC free article] [PubMed] [Google Scholar]
- 20.Schoofs L & Beets I Neuropeptides control life-phase transitions. Proc Natl Acad Sci U S A 110, 7973–7974, doi: 10.1073/pnas.1305724110 (2013). [DOI] [PMC free article] [PubMed] [Google Scholar]
- 21.Barrios A, Ghosh R, Fang C, Emmons SW & Barr MM PDF-1 neuropeptide signaling modulates a neural circuit for mate-searching behavior in C. elegans. Nat Neurosci 15, 1675–1682, doi: 10.1038/nn.3253nn.3253nn.3253 [pii] (2012). [DOI] [PMC free article] [PubMed] [Google Scholar]
- 22.Lipton J, Kleemann G, Ghosh R, Lints R & Emmons SW Mate searching in Caenorhabditis elegans: a genetic model for sex drive in a simple invertebrate. J Neurosci 24, 7427–7434, doi: 10.1523/JNEUROSCI.1746-04.2004 (2004). [DOI] [PMC free article] [PubMed] [Google Scholar]
- 23.Berkseth M, Ikegami K, Arur S, Lieb JD & Zarkower D TRA-1 ChIP-seq reveals regulators of sexual differentiation and multilevel feedback in nematode sex determination. Proc Natl Acad Sci U S A 110, 16033–16038, doi: 10.1073/pnas.1312087110 (2013). [DOI] [PMC free article] [PubMed] [Google Scholar]
- 24.Oren-Suissa M, Bayer EA & Hobert O Sex-specific pruning of neuronal synapses in Caenorhabditis elegans. Nature 533, 206–211, doi: 10.1038/nature17977 (2016). [DOI] [PMC free article] [PubMed] [Google Scholar]
- 25.Lee K & Portman DS Neural sex modifies the function of a C. elegans sensory circuit. Curr Biol 17, 1858–1863, doi: 10.1016/j.cub.2007.10.015 (2007). [DOI] [PubMed] [Google Scholar]
- 26.Cassada RC & Russell RL The dauerlarva, a post-embryonic developmental variant of the nematode Caenorhabditis elegans. Dev Biol 46, 326–342, doi:0012-1606(75)90109-8 [pii] (1975). [DOI] [PubMed] [Google Scholar]
- 27.Kumar N et al. Genome-wide endogenous DAF-16/FOXO recruitment dynamics during lowered insulin signalling in C. elegans. Oncotarget 6, 41418–41433, doi: 10.18632/oncotarget.6282 (2015). [DOI] [PMC free article] [PubMed] [Google Scholar]
- 28.Hobert O Terminal Selectors of Neuronal Identity. Curr Top Dev Biol 116, 455–475, doi: 10.1016/bs.ctdb.2015.12.007 (2016). [DOI] [PubMed] [Google Scholar]
- 29.Berghoff EG et al. The Prop1-like homeobox gene unc-42 specifies the identity of synaptically connected neurons. eLife 10, doi: 10.7554/eLife.64903 (2021). [DOI] [PMC free article] [PubMed] [Google Scholar]
REFERENCES FOR METHODS
- 30.Yemini E et al. NeuroPAL: A Multicolor Atlas for Whole-Brain Neuronal Identification in C. elegans. Cell 184, 272–288 e211, doi: 10.1016/j.cell.2020.12.012 (2021). [DOI] [PMC free article] [PubMed] [Google Scholar]
- 31.Tursun B, Cochella L, Carrera I & Hobert O A toolkit and robust pipeline for the generation of fosmid-based reporter genes in C. elegans. PLoS ONE 4, e4625, doi: 10.1371/journal.pone.0004625 (2009). [DOI] [PMC free article] [PubMed] [Google Scholar]
- 32.Dokshin GA, Ghanta KS, Piscopo KM & Mello CC Robust Genome Editing with Short Single-Stranded and Long, Partially Single-Stranded DNA Donors in Caenorhabditis elegans. Genetics 210, 781–787, doi: 10.1534/genetics.118.301532 (2018). [DOI] [PMC free article] [PubMed] [Google Scholar]
- 33.Dickinson DJ, Pani AM, Heppert JK, Higgins CD & Goldstein B Streamlined Genome Engineering with a Self-Excising Drug Selection Cassette. Genetics 200, 1035–1049, doi: 10.1534/genetics.115.178335 (2015). [DOI] [PMC free article] [PubMed] [Google Scholar]
- 34.Ahier A & Jarriault S Simultaneous expression of multiple proteins under a single promoter in Caenorhabditis elegans via a versatile 2A-based toolkit. Genetics 196, 605–613, doi: 10.1534/genetics.113.160846 (2014). [DOI] [PMC free article] [PubMed] [Google Scholar]
- 35.Frokjaer-Jensen C et al. Random and targeted transgene insertion in Caenorhabditis elegans using a modified Mos1 transposon. Nat Methods 11, 529–534, doi: 10.1038/nmeth.2889 (2014). [DOI] [PMC free article] [PubMed] [Google Scholar]
- 36.Zhang F et al. The LIM and POU homeobox genes ttx-3 and unc-86 act as terminal selectors in distinct cholinergic and serotonergic neuron types. Development 141, 422–435, doi: 10.1242/dev.099721 (2014). [DOI] [PMC free article] [PubMed] [Google Scholar]
- 37.Brockie PJ, Madsen DM, Zheng Y, Mellem J & Maricq AV Differential expression of glutamate receptor subunits in the nervous system of Caenorhabditis elegans and their regulation by the homeodomain protein UNC-42. J Neurosci 21, 1510–1522 (2001). [DOI] [PMC free article] [PubMed] [Google Scholar]
- 38.Bhattacharya A, Aghayeva U, Berghoff EG & Hobert O Plasticity of the Electrical Connectome of C. elegans. Cell 176, 1174–1189 e1116, doi: 10.1016/j.cell.2018.12.024 (2019). [DOI] [PMC free article] [PubMed] [Google Scholar]
- 39.Flavell SW et al. Serotonin and the neuropeptide PDF initiate and extend opposing behavioral states in C. elegans. Cell 154, 1023–1035, doi: 10.1016/j.cell.2013.08.001 (2013). [DOI] [PMC free article] [PubMed] [Google Scholar]
- 40.Chalfie M, Horvitz HR & Sulston JE Mutations that lead to reiterations in the cell lineages of C. elegans. Cell 24, 59–69 (1981). [DOI] [PubMed] [Google Scholar]
- 41.Liao Y, Smyth GK & Shi W The R package Rsubread is easier, faster, cheaper and better for alignment and quantification of RNA sequencing reads. Nucleic Acids Res 47, e47, doi: 10.1093/nar/gkz114 (2019). [DOI] [PMC free article] [PubMed] [Google Scholar]
- 42.Love MI, Huber W & Anders S Moderated estimation of fold change and dispersion for RNA-seq data with DESeq2. Genome Biol 15, 550, doi: 10.1186/s13059-014-0550-8 (2014). [DOI] [PMC free article] [PubMed] [Google Scholar]
- 43.Li Y et al. Establishment and maintenance of motor neuron identity via temporal modularity in terminal selector function. Elife 9, doi: 10.7554/eLife.59464 (2020). [DOI] [PMC free article] [PubMed] [Google Scholar]
- 44.Li H & Durbin R Fast and accurate short read alignment with Burrows-Wheeler transform. Bioinformatics 25, 1754–1760, doi: 10.1093/bioinformatics/btp324 (2009). [DOI] [PMC free article] [PubMed] [Google Scholar]
- 45.Li H et al. The Sequence Alignment/Map format and SAMtools. Bioinformatics 25, 2078–2079, doi: 10.1093/bioinformatics/btp352 (2009). [DOI] [PMC free article] [PubMed] [Google Scholar]
- 46.Feng J, Liu T, Qin B, Zhang Y & Liu XS Identifying ChIP-seq enrichment using MACS. Nat Protoc 7, 1728–1740, doi: 10.1038/nprot.2012.101 (2012). [DOI] [PMC free article] [PubMed] [Google Scholar]
- 47.Yu G, Wang LG & He QY ChIPseeker: an R/Bioconductor package for ChIP peak annotation, comparison and visualization. Bioinformatics 31, 2382–2383, doi: 10.1093/bioinformatics/btv145 (2015). [DOI] [PubMed] [Google Scholar]
- 48.Machanick P & Bailey TL MEME-ChIP: motif analysis of large DNA datasets. Bioinformatics 27, 1696–1697, doi: 10.1093/bioinformatics/btr189 (2011). [DOI] [PMC free article] [PubMed] [Google Scholar]
- 49.Ross-Innes CS et al. Differential oestrogen receptor binding is associated with clinical outcome in breast cancer. Nature 481, 389–393, doi: 10.1038/nature10730 (2012). [DOI] [PMC free article] [PubMed] [Google Scholar]
- 50.Zhang L, Ward JD, Cheng Z & Dernburg AF The auxin-inducible degradation (AID) system enables versatile conditional protein depletion in C. elegans. Development 142, 4374–4384, doi: 10.1242/dev.129635 (2015). [DOI] [PMC free article] [PubMed] [Google Scholar]
- 51.Aghayeva U, Bhattacharya A & Hobert O A panel of fluorophore-tagged daf-16 alleles. MicroPubl Biol 2020, doi: 10.17912/micropub.biology.000210 (2020). [DOI] [PMC free article] [PubMed] [Google Scholar]
- 52.Harris DT & Horvitz HR MAB-10/NAB acts with LIN-29/EGR to regulate terminal differentiation and the transition from larva to adult in C. elegans. Development 138, 4051–4062, doi: 10.1242/dev.065417 (2011). [DOI] [PMC free article] [PubMed] [Google Scholar]
- 53.Aeschimann F et al. LIN41 Post-transcriptionally Silences mRNAs by Two Distinct and Position-Dependent Mechanisms. Mol Cell 65, 476–489 e474, doi: 10.1016/j.molcel.2016.12.010 (2017). [DOI] [PubMed] [Google Scholar]
- 54.Ramirez F et al. deepTools2: a next generation web server for deep-sequencing data analysis. Nucleic Acids Res 44, W160–165, doi: 10.1093/nar/gkw257 (2016). [DOI] [PMC free article] [PubMed] [Google Scholar]
- 55.Deal RB & Henikoff S A simple method for gene expression and chromatin profiling of individual cell types within a tissue. Dev Cell 18, 1030–1040, doi: 10.1016/j.devcel.2010.05.013 (2010). [DOI] [PMC free article] [PubMed] [Google Scholar]
Associated Data
This section collects any data citations, data availability statements, or supplementary materials included in this article.
Supplementary Materials
Data Availability Statement
Raw and processed RNA-seq data is available at GEO accession #GSE158274. Raw and processed ChIP-seq data is available at GEO accession #GSE181288.


