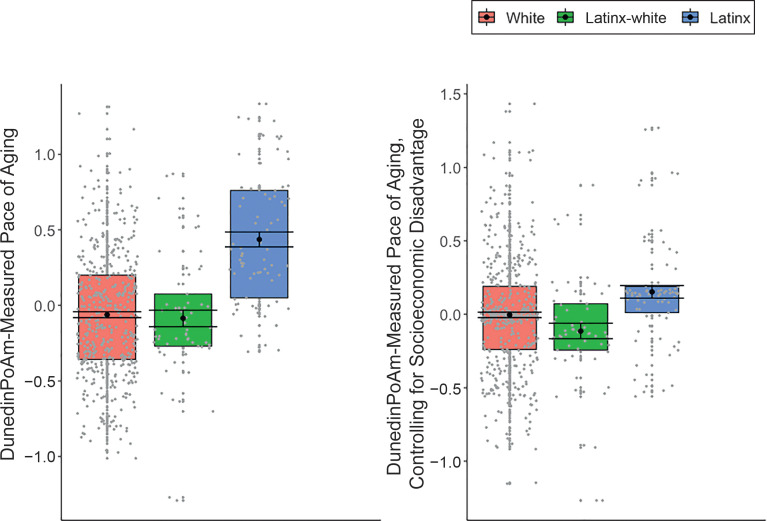
FIGURE 2.
DunedinPoAm-measured pace of aging in children identifying as White, Latinx, and Latinx-White. DunedinPoAm-measured pace of aging values are in SD units. Higher values indicate a methylation profile of faster biological aging. Regression is estimated from linear mixed-effects model that accounts for nesting of children within families. The boxplot reveals group differences in the mean DunedinPoAm-measured pace of aging (black circle), SEs of the mean (error bars), and the first and third quartiles (lower and upper hinges). Group differences were significant at the α = .05 threshold, without adjustment for differences in socioeconomic disadvantage between groups (left panel), but were no longer significantly different from 0 when controlling for family- and neighborhood-level disadvantage (right panel).

