

Abstract
There is an increased adoption of electronic health record systems by a variety of hospitals and medical centers. This provides an opportunity to leverage automated computer systems in assisting healthcare workers. One of the least utilized but rich source of patient information is the unstructured clinical text. In this work, we develop CATAN, a chart-aware temporal attention network for learning patient representations from clinical notes. We introduce a novel representation where each note is considered a single unit, like a sentence, and composed of attention-weighted words. The notes in turn are aggregated into a patient representation using a second weighting unit, note attention. Unlike standard attention computations which focus only on the content of the note, we incorporate the chart-time for each note as a constraint for attention calculation. This allows our model to focus on notes closer to the prediction time. Using the MIMIC-III dataset, we empirically show that our patient representation and attention calculation achieves the best performance in comparison with various state-of-the-art baselines for one-year mortality prediction and 30-day hospital readmission. Moreover, the attention weights can be used to offer transparency into our model’s predictions.
I. Introduction
Electronic health records (EHR) systems are fast becoming an indispensable part of healthcare provision by documenting a large amount of patient information [1]. Even though EHRs are primarily used to archive patient information for billing purposes, they have been adopted for secondary analysis through various clinical informatics applications [2]–[4]. Yet the majority of such analyses use only the structured data. Unstructured clinical notes, a major component of EHR, have richly detailed and nuanced information about clinical conditions, disease progression and the care process [5]. However, the high dimensionality of free-text notes (i.e., a large vocabulary) and difficulty with proper representation of natural language has hindered its widespread use with existing machine learning algorithms [4].
The rapid rise of deep learning and natural language processing (NLP) has spurred adoption of clinical text for machine learning models [6]–[8]. As a result, there is an increasing uptake of clinical text processing tasks including phenotyping [9], mortality prediction [10], medical concept extraction [11], and hospital readmission prediction [12]. From a modeling perspective, convolutional neural networks (CNN) [13], [14], recurrent neural networks (RNN) [15], and transformer-based models [16], [17] are among the most widely used methods for prediction using clinical notes. Although the transformer architecture has shown impressive improvements in many NLP tasks [18], the improvement has not translated well to medical text even when trained on clinical notes [16], [17]. In these models, the de-facto representation of text documents involves merging all the notes as the document representation. This has the downside in terms of interpretability as we can not tell which notes are more important in the outcome. The temporal sequence and information of clinical notes is also discarded.
Attention-based RNNs have been proposed to offer better explainability and transparency of the prediction [19]–[21]. Under the attention mechanism, each word has a nonnegative weight that together sums to 1 and thus can offer relative importance of the words themselves. While there has been some debate as to whether or not attention is explainability [22]–[24], attention can be used as a tool to help better identify which part of the text is relevant [25]. Yet, existing attention-based RNNs can still suffer when there are multiple different sentence structures within the same document as it assumes all sentences are equal.
The hierarchical attention network (HAN) model was proposed to model the hierarchical structure in documents [26]. Individual sentence representations are built from the words in the sentences and then aggregated into document representations. Since the words in the sentences are explicitly modeled, this can attenuate the words and phrases that are specific to a particular sentence. Moreover, the model can learn the contribution of the sentence to the document itself without treating them all as equal. Since a patient’s clinical notes are aggregations of various reports such as nursing notes, and ECG reports, it is natural to take advantage of the HAN architecture. In [27], a three-level HAN model learns the patient representations from longitudinal clinical notes while offering a degree of interpretability. Under their model, notes that occur together within a specific time window are aggregated together into a document. Unfortunately, this can hinder transparency as it is not obvious which individual note is important and assumes notes from different categories can and should be merged together. Furthermore, HAN fails to account for the temporal sequence of clinical notes. In particular, more recent notes may provide more pertinent information than those from the beginning of the admission process.
To address the above limitations, we propose to extend HAN by incorporating the chart-time into the attention computation. By including the time of event occurrence (such as ECG results, Nursing visit notes) in the modeling process, we can improve the patient representation. Our proposed method, chart-aware temporal hierarchical attention network or CATAN, encodes each note as a separate entity and a patient document is the attention-weighted aggregation of all the entities (or notes). CATAN prioritizes the recent notes to further improve the patient representation. In addition, by separately encoding each note, our model can pay particular “attention” (or importance) to different note types hence aiding the attention learning process at the note-level. Moreover, each clinical note in turn is comprised of words which will have different attentions depending on the kind of note they appear in. An example of the patient document is shown in Figure 1, where each note is weighted according to the note attention score to compute the final patient representation.
Fig. 1:

An example aggregation of words into notes and notes into a patient representation. This represents a single patient composed of weighted notes and each note is also an aggregate of weighted word representations. The example attention weights of 0.3, 0.2, and 0.5 at the top indicate the attentions for the nursing note, ECG note, and Radiology note respectively.
The benefit of our representation is two-fold. First, this helps CATAN learn words and phrases specific to the note as the vocabulary used in different notes can vary. For example ‘ECG’ reports uses different languages than in ‘Nutrition’ notes. It was observed in [28] that despite the substantial overlap in vocabulary for each category of clinical notes, the words used within each are remarkably different. Second, separately encoding each note can help with model interpretation to identify which notes are important in the prediction and which of the words in the given note are useful indicators of a condition. For example, in Figure 1, the model suggests that radiology note is more important and highlights the words in the notes responsible for a particular prediction. Previous models apply attention weights to words and sentences regardless of which note they occur in.
To summarize, the primary contributions of this work are:
We introduce a new text representation by encoding each note as a separate entity so that attention can be applied to each note individually.
We propose a new hierarchical attention network which explicitly models the time each note is charted. This allows more recent notes to be highlighted.
The use of the hierarchical representation for patients as a composition of different clinical notes and words within the notes provides improved transparency to the prediction model as the note importance and word importance can be easily computed.
We empirically evaluate the efficacy and suitability of our architecture using the MIMIC-III dataset [29] on two clinical prediction tasks: 30-day hospital readmission and 1-year mortality prediction. Our results show that CATAN outperforms existing models on the prediction tasks. In addition, we provide a qualitative evaluation of the transparency of our models. The results showcase that our model offers a better patient representation and can be used as an appropriate representation of unstructured text.
II. Related Work
Various traditional machine learning and deep learning approaches have been explored to predict events from EHR free-text data. The validity of clinical text extraction in complementing a clinical predictive task is explored in [14], [30]. In both works, the authors jointly train time series signals and unstructured clinical text representations to predict the in-hospital mortality risk for ICU patients. For this work, we focus predominantly on prediction using the unstructured free-text notes. We can broadly categorize these approaches into two groups: traditional machine learning methods (i.e., logistic regression, decision tree, support vector machines) and deep learning-based methods.
Traditional models.
Several studies have extracted numeric features from text data and then passed these features to popular algorithms such as logistic regression, decision tree, support vector machine. In [31], the authors examined the use of Latent Dirichlet Allocation with bag-of-words to decompose free-text hospital notes into latent variables and evaluated the predictive power of these topics for patient mortality. Similarly, [32] predicted preterm births from patient medication and procedure history by extracting 2000 word features from free text findings documented by physicians in addition to 762 structured features. [33] used binary representation (i.e., presence of the word), term frequency, and term frequency-inverse document frequency to predict bed demands in the emergency department
Deep learning models.
Recently, [34] evaluated bag-of-words (BoW) representation, word embeddings, and long short-term memory (LSTM) networks using clinical notes on various classification tasks like in-hospital mortality, ethnicity, gender, and age prediction. The authors found that the LSTM model outperformed the BoW model on clinical reasoning tasks. As a result, deep learning models have gained popularity for modeling clinical text. Deep EHR is a framework for disease onset prediction that combines both free-text medical notes and structured information [35]. In this work, the authors compare the performance of common deep learning architectures such as CNN and LSTM for disease onset prediction. An ensemble, multi-modal model that combines CNN, RNN, and decision trees was developed to predict ICD-10 diagnostic codes in [36] using unstructured text data, semi-structured, and structured tabular data. Adoption of BERT-based models for clinical text have been proposed [16], [17], with the contextual word embeddings made publicly available in [16]. While the BERT-based models offer state of the art performance, the improvement in prediction has not been as impressive as for traditional NLP tasks.
One limitation to the above approaches is the lack of transparency in the prediction. To date, there have been several attention-based models to introduce interpretability into the prediction. An attention-based CNN that predicts medical codes from clinical text was proposed [37]. The attention mechanism is used to select the most relevant segments for each of the thousands of possible codes which describe the diagnosis and treatment. The significance of incorporating attention mechanisms into RNN-based text encoders in predictive models is empirically investigated in [22]. The authors weigh the performance benefits gained using attention mechanisms against the ‘loss’ in explainability of such models in comparison to linear BoW model. Noteably, a three-level HAN was proposed to explicitly learn patient representations from longitudinal clinical notes while offering a degree of interpretability [27]. These discussed works treat patient data as one homogeneous document instead of separate notes of different categories documented at various phases of patient care. Moreover, these existing works fail to incorporate the time of the note as a component in their models. A time-aware LSTM network (T-LSTM) was proposed for structured data where the time decay between events were used to discount the memory content of an LSTM cell and showed that temporal information can be used to improve predictive performance [38]. However, T-LSTM lacks transparency in the prediction. We posit that this information can be used to improve the patient document representation and outcome prediction.
III. CATAN: Chart-aware temporal attention network
We propose CATAN, an extension of the HAN model, to identify the important words and phrases specific to a note and also identify temporally-relevant notes. Our model represents each patient using a hierarchical structure of their notes – each note is represented using the various words and all the patient’s notes together form the patient’s representation. This involves modeling the interactions of the words, not just their presence in isolation to determine the relevant sections of the note. In addition, to account for the temporal nature of the notes, we introduce a new regularization loss to model when the note is documented. Intuitively, notes further away in the patient charting chronology should have less importance compared to most recent notes which are likely to contain the latest disease prognosis and medication. Our model offers better transparency of the prediction by identifying sections of a note that are important as well as specific notes that are useful indicators of a condition. Moreover, CATAN obtains a better text representation by incorporating the temporal and hierarchical nature of the clinical documents.
In this section, we discuss HAN before introducing CATAN. Finally, we provide details of how to train the model.
A. Hierarchical Attention Network
HAN was proposed to incorporate knowledge of the document structure in the model architecture [26]. The authors observed that text documents are hierarchical in nature; words form sentences and sentences form documents. Thus the need for a hierarchical model architecture where the words in the sentence are modeled using a word encoder and the sentences in a document are modeled using a sentence encoder. As a result, HAN captures the interactions of the words and not just their presence in isolation to determine the relevant sections of the document. Moreover, both the word encoder and sentence encoder have attention layers to extract important word and sentence contexts for the final document representation.
HAN is well-suited for clinical note representation as each patient is composed of a collection of notes which in turn. are formed from words. Si and Roberts proposed a three-level HAN to learn patient representations from clinical text using a word encoder, a sentence encoder, and a document encoder [27]. At the sentence level, the model identifies crucial words with higher attention weights and aggregates them to construct sentence representations. Under their model, the sentences from the notes are combined into documents or segments using a greedy segmentation as notes generally come in “bursts”. Lastly, the model combines the segments to construct the final patient representation. However, there are two limitations of the HAN model with greedy segmentation as well as the standard HAN model. The temporal nature of the notes are lost, which can contain some additional information. Second, the type of notes is not modeled which can offer improved transparency to the prediction. Thus, we propose a two-level HAN model with chart-time aware attention to address these deficiencies.
B. Temporal Attention Network
Since each note is independently charted at a different time of patient care, we hypothesize that the time the note is written should have an impact on the weighting of the note. Intuitively, notes further away in the patient charting chronology should have lesser importance compared to most recent notes which contain latest disease prognosis and medication. A medical condition mentioned more recently is likely to be more informative of the patients status than old mentions. Therefore, we propose a temporal regularization to capture this idea and focus the network on placing more “attention” on the more recent notes. CATAN thus consists of three parts: a word encoder and word attention layer; a note encoder and note attention layer; and a chart-time aware weighted loss function. Figure 2 illustrates how the chart time of each note and the words in each note are accounted for in our model.
Fig. 2:
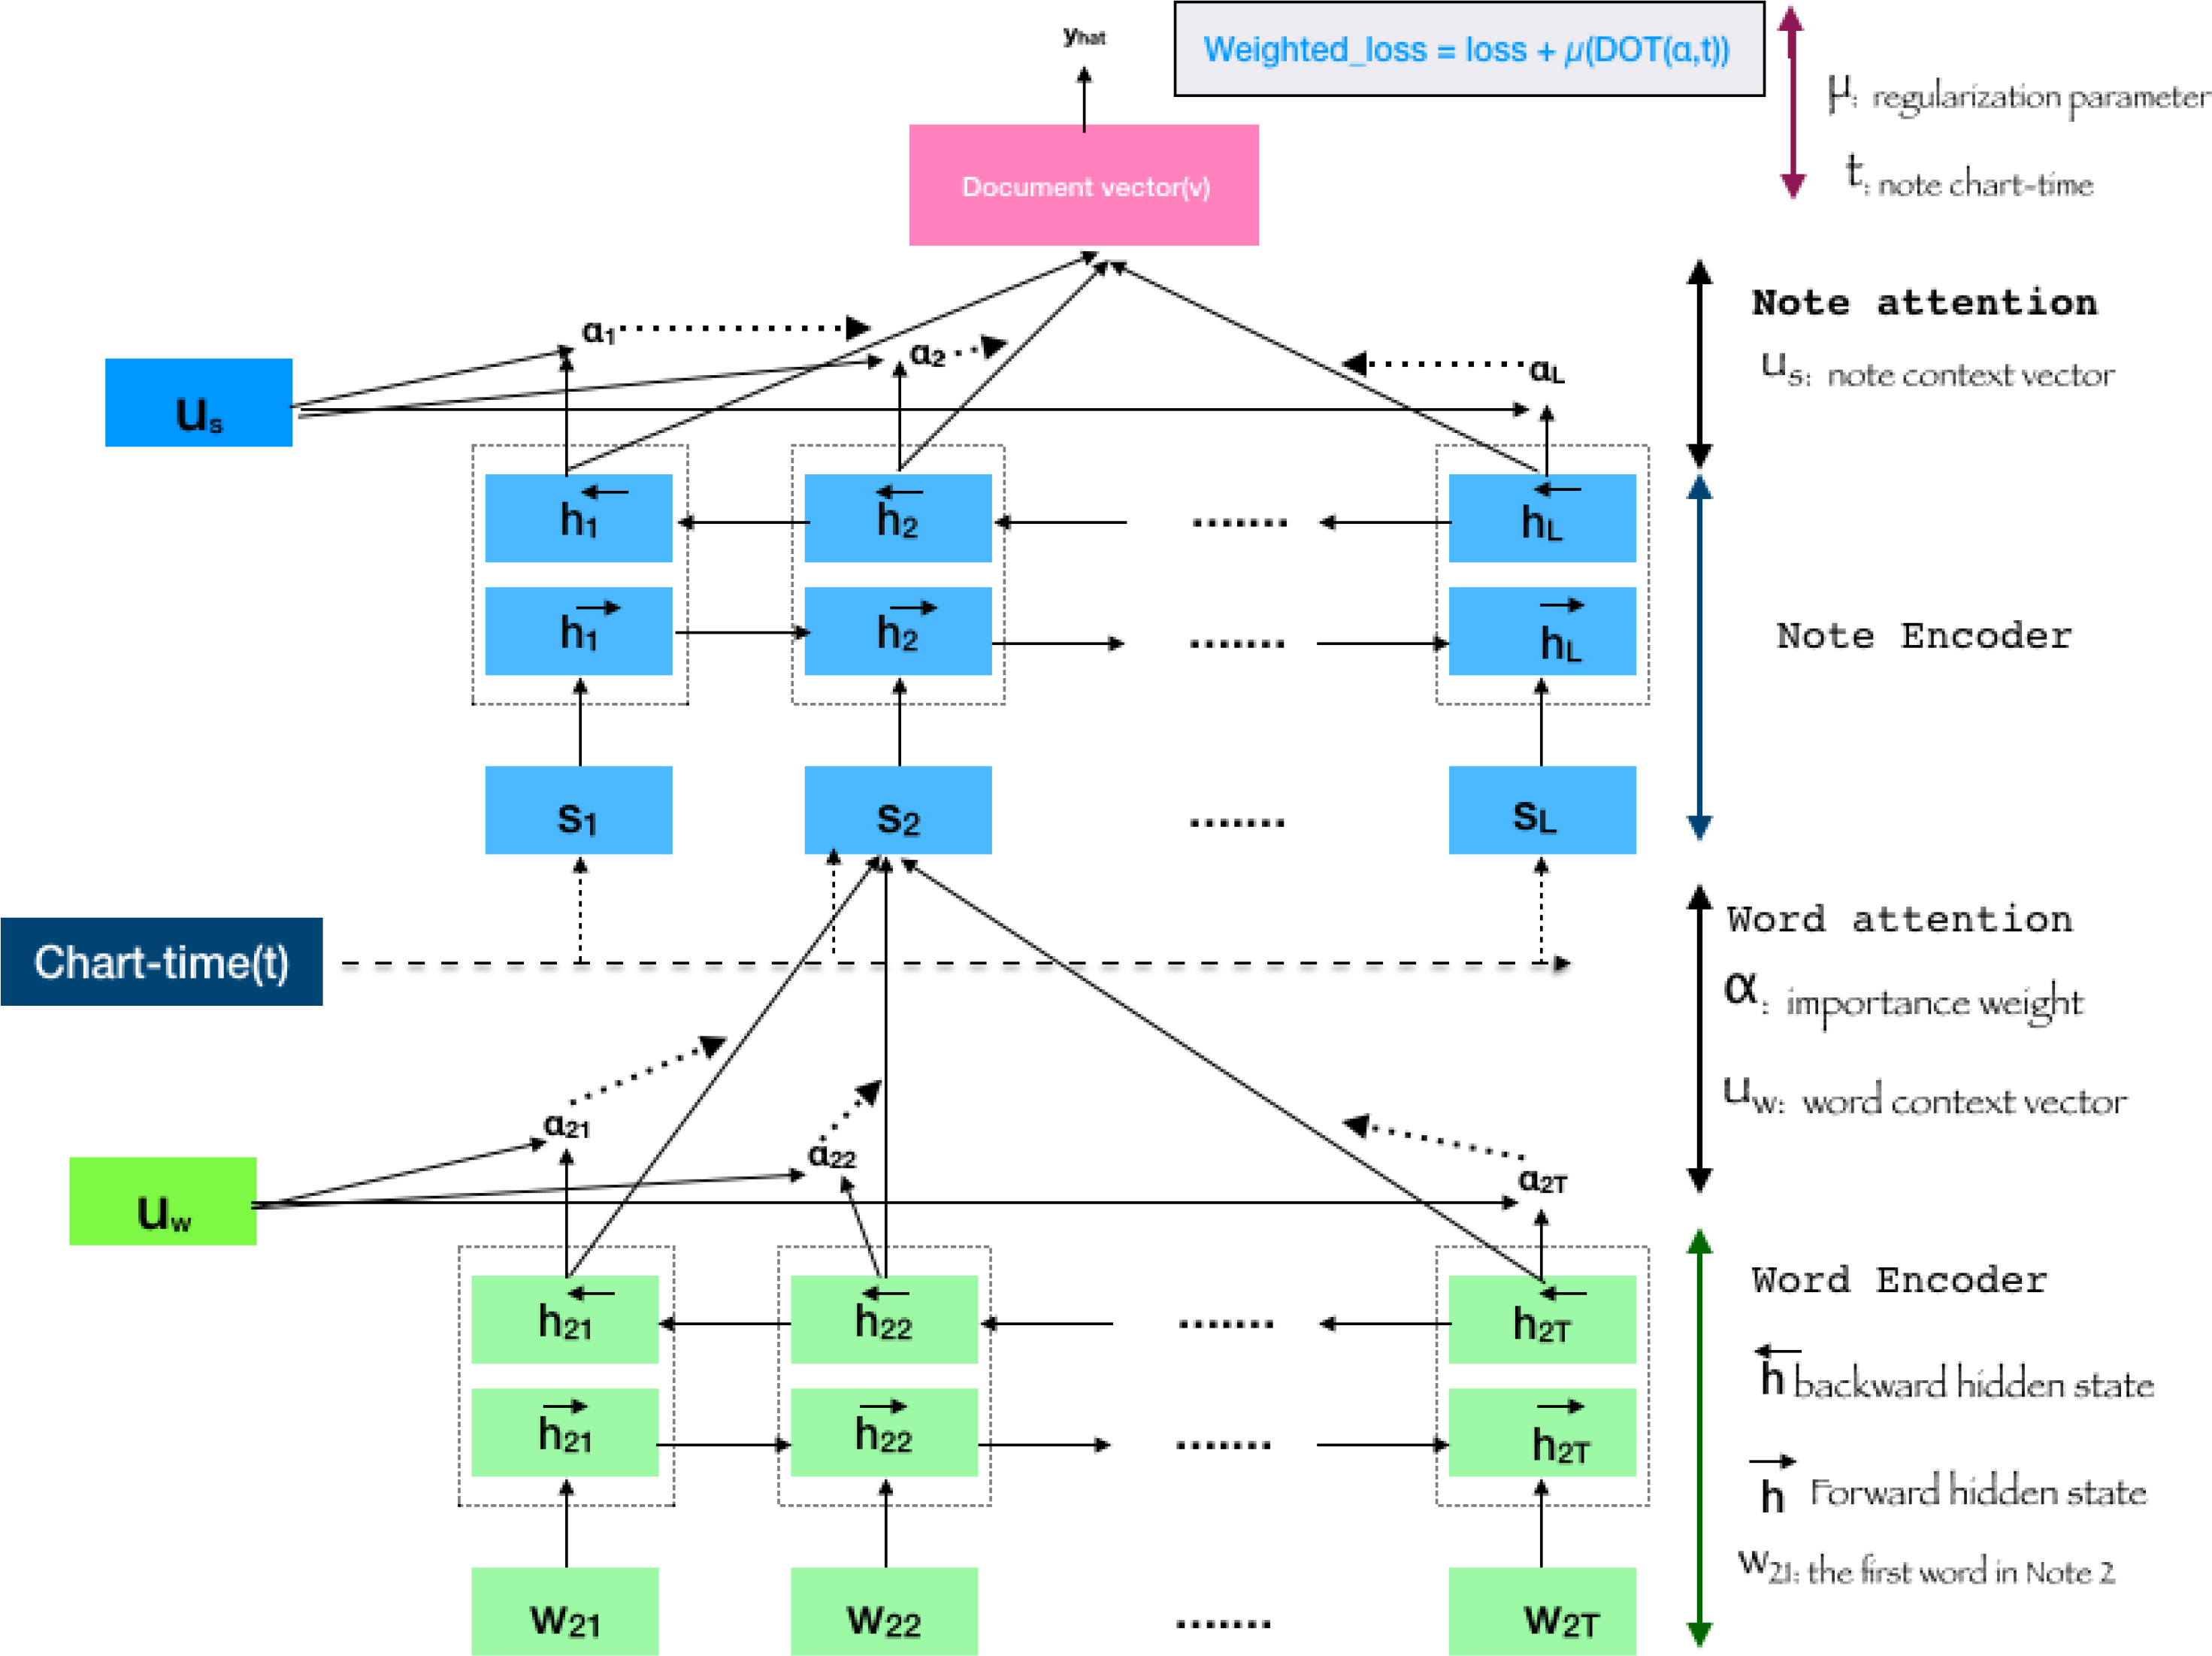
An illustration of CATAN. Word embeddings, xij for each word wij is passed through BiLSTM produce the word encoder unit. The word attention, αij will be applied on the encoded tokens. Similarly, notes will be encoded and pass through attention layer. The loss calculation will be constrained by the cosine similarity of the note attention weights and the chart-time distribution of notes.
Word Representation Layer.
The first part of CATAN is to learn the important words in a note. We denote the jth word in the ith note as wij. Each word, wij is represented using a pre-trained embedding xij. In our experiments, we use a 300-dimension embedding trained on PubMed abstracts. For our model, we assume there are J words in a note. Notes shorter than J words are padded with zeroes while longer ones are truncated from the head to keep the last part.
The vectorized words, xij are the inputs to the word encoder layer. The word encoder layer uses an attention-based bidirectional LSTM (BiLSTM) to encode each vectorized word and extract relevant contexts for each note. The update process of our word representation follows the standard BiLSM process:
| (1) |
| (2) |
The annotation for word wij, hij, is a concatenation of information from the forward and backward passes of the BiLSTM, hij in Equation (1). The word annotation is then fed to a single-layer perceptron to learn a hidden representation, uij. The attention mechanism, αij, then measures the importance of the word as the similarity of the hidden representation with the word-level context vector uw. Finally, the note vector representation, sj, is sum of the product of the context annotations and the importance weights in Equation (2).
Note Representation Layer.
For the representation of all the notes, the architecture is similar to the word representation layer. Each note is encoded using a biLSTM to obtain the note annotation . As the case with the word representation layer, an attention mechanism in the form of a single layer perceptron is applied with randomly initialized trainable weights and biases. The note context vector, ui and note importance weights, αi, are jointly learned from the data are multiplied together and summed across all the weights to produce the patient vector, . The prediction is then made using this patient representation by passing it through a soft-max layer .
Chart-time Aware Weighted Loss Function.
To capture the idea that the network should place more attention on recent notes, we introduce a regularization loss that penalizes whenever older notes are assigned larger note attentions. Let δi(t) denote the difference (in hours) from the time of prediction to the time the note was taken. For example, if a note is taken in the hour of prediction, δi(t) = 0, whereas if a note was taken a day before the prediction, δi(t) = 24. We then normalize δi(t) to lie between 0 and 1 to account for differences in ICU stays. The regularization then is the dot product of the vector of attention weights, α and the vector of change in chart times δ(t). As a result, more recent notes are likely to have higher attention (or importance). Formally, the loss function with the regularization parameter, μ is:
| (3) |
While it is likely that a note’s attention may be mostly attributed to its timing, this will not always be the case as some notes further back in the patient chronology may still contain relevant information to the prediction.
C. Training and Implementation
CATAN is implemented in Keras. The training is done using the Adagrad optimizer with the learning rate of 0.001 and binary-crossentropy loss. A batch size of 64 and maximum epoch number of 300 is used. Early stopping with the best weight and batch normalization are applied. The implementation will be made available upon acceptance.
IV. Experiments
In this section, we describe our experiments on using CATAN to perform two common clinical prediction tasks. We first introduce the dataset used to generate the two tasks and then present the experimental results. Finally we discuss the attention weights of each word and note, and the relative importance of the word and note in explaining the prediction.
A. Dataset
We extract data from the MIMIC-III dataset, a publicly available ICU dataset collected from 2001 to 2012 at Beth Israel Deaconess Medical Center [29]. We focus on two common benchmark prediction tasks used in several studies [39]–[41]
30-day ICU Readmission: A binary classification task to predict whether or not a discharged patient will be readmitted within 30 days.
One-year mortality: A binary classification to determine if a discharged patient will die within the first year of discharge.
Cohort.
We only include adult patients who are 18 years or older and stayed in the ICU for at least 24 hours. Younger patients are excluded since their physiology is different from adult patients. For patients who have multiple admissions to the ICU, we only consider their first admission to avoid any potential data leakage during test. The final cohort contains 20,362 patients with a 30-day readmission rate of 14%, and a one-year mortality rate of 15.5%. For our experiments, we only use the clinical notes for these 20,362 patients. The notes consist of the following types: ‘Discharge summary’, ‘Physician’, ‘Nursing’, ‘General’, ‘Echo’, ‘Radiology’, ‘Nursing/other’, ‘Social Work’, ‘ECG’, ‘Respiratory ‘, ‘Nutrition’, ‘Rehab Services’, and ‘case management’. Table I offers some summary statistics about the dataset used.
TABLE I:
Summary statistics for our dataset.
| Description | Number |
|---|---|
|
| |
| Total patients | 20,362 |
| Total notes in first 72hrs | 330,242 |
| Total notes | 563,465 |
| Unique tokens in first 72hrs | 296,690 |
| Unique tokens | 350,630 |
| Average notes per patient | 27 |
| Average tokens per note | 1308 |
Prediction Window.
For both tasks, the prediction is performed at two different time points. The first window is 72 hours, referred to as ‘72hrs’, which means that only the notes that are available from admission up to 72 hours are used. In particular, this mean notes such as discharge summaries will not be included in this task. The second window is using all the notes collected during the ICU stay including discharge summary, referred to as ‘discharge’.
B. Experimental Section
We use stratified sampling (i.e., maintain the original class imbalance) to split the dataset associated with each task into train-validation-test sets of 70%−15%−15%, respectively. We train on the training split, tune hyperparameters using the validation set and report the comparative results on the test set. The reported results are the average of three runs for each model on different initializations.
Baselines:
We compare CATAN with the following state-of-the-art methods in the domain of clinical prediction.
Logistic regression: Despite the simplistic nature of a linear method, logistic regression still performs comparably well to deep learning methods. Term frequency-inverse document frequency weighted bag of words are used as features.
LSTM with attention: LSTMs are widely regarded as the deep learning standard for text data as they can take advantage of the sequential nature. A three-layer stacked LSTM with node sizes of 32, 64, 128 is used.
ClinicalBERT [16]: A pre-trained BERT model using clinical and biomedical text. BERT models serve as the state-of-the-art in many text processing tasks.
HAN: A standard HAN model with a note encoder and word encoder without the chart-time component. We use the best performing architecture – a word dense layer of 32 nodes and a sentence dense layer of 64 in the BiLSTM.
HAN with segmentation [27]: The authors of [27] adapted a 3-level HAN with greedy segmentation for transfer learning of patient representation. The model merges all patient notes within a one-hour window.
T-LSTM [38]: Time-aware LSTM networks were proposed where the time decay is used to discount the memory content of an LSTM cell during the cell update.
Metrics:
Each model is evaluated on the two classification tasks and two prediction windows using area under the receiver operating characteristic curve (AUROC) and the area under the precision versus recall curve (AUPRC). These metrics are well suited for a binary classification task with imbalanced datasets.
C. Classification Performance
Table II summarizes the results for 30-day readmission and 1-year mortality on the test set. The evaluation metrics are shown for the two prediction windows, using notes from the first 72 hours since admission, and using all the notes available during discharge. From the table, we observe that CATAN achieves the best predictive performance (in terms of AUROC and AUPRC) across both prediction windows for 30-day readmission, including improving the AUROC by up to 0.016 over ClinicalBERT, the current state-of-the-art. Although the improvements are minor (i.e., the results are within the standard deviation bounds of the other models), there are transparency benefits that CATAN offer as compared to the others which are discussed in the subsequent results.
TABLE II:
Predictive performance (mean and standard deviation across three runs) on the two classification task for different models using notes from first 72hrs and all notes including discharge summary.
| Model | Readmission | 1-year Mortality | ||||||
|---|---|---|---|---|---|---|---|---|
| 72 hrs | Discharge | 72 hrs | Discharge | |||||
| AUROC | AUPRC | AUROC | AUPRC | AUROC | AUPRC | AUROC | AUPRC | |
|
| ||||||||
| Logistic regression | 0.651±0.003 | 0.421±0.002 | 0.681±0.005 | 0.424±0.002 | 0.847±0.003 | 0.420±0.001 | 0.880±0.002 | 0.422±0.001 |
| LSTM w/ attention | 0.650±0.008 | 0.421±0.003 | 0.690±0.009 | 0.425±0.003 | 0.794±0.006 | 0.416±0.009 | 0.829±0.007 | 0.420±0.006 |
| ClinicalBERT | 0.667±0.006 | 0.422±0.002 | 0.704±0.007 | 0.425±0.002 | 0.837±0.005 | 0.420±0.001 | 0.899±0.007 | 0.422±0.001 |
| HAN | 0.679±0.005 | 0.424±0.002 | 0.707±0.005 | 0.426±0.003 | 0.849±0.003 | 0.421±0.001 | 0.893±0.005 | 0.422±0.001 |
| HAN w/ seg. | 0.674±0.002 | 0.422±0.002 | 0.708±0.005 | 0.426±0.002 | 0.842±0.002 | 0.422±0.002 | 0.898±0.004 | 0.422±0.001 |
| T-LSTM | 0.669±0.006 | 0.422±0.002 | 0.701±0.005 | 0.425±0.003 | 0.845±0.004 | 0.422±0.002 | 0.893±0.005 | 0.422±0.001 |
| CATAN | 0.683±0.004 | 0.424±0.002 | 0.712±0.005 | 0.428±0.002 | 0.853±0.003 | 0.422±0.001 | 0.902±0.004 | 0.422±0.001 |
The readmission results in Table II also suggest that the hierarchical nature of the clinical documents can be utilized to obtain better text representations since the other two HAN-based models, HAN and HAN with segmentation, achieve a better performance than ClinicalBERT. When comparing HAN with segmentation and HAN, we note that the two-level HAN (where each note is a sentence and a patient is a document) achieves a comparable performance to the three-level HAN with greedy segmentation proposed in [27]. This suggests that simplifying the architecture can be done without sacrificing performance and also allows the flexibility to model each note separately. It can also be observed across all the models that using all the notes including discharge improves the predictive performance significantly.
From Table II, we observe that the results for 1-year mortality is similar to the readmission task. CATAN achieves the best score and improves the AUROC by up to 0.016 over ClinicalBERT, the current state-of-the-art. From the results, we observe that HAN outperforms ClinicalBERT using just 72 hours of data, while it performs slightly worse in terms of AUROC than ClinicalBERT using all the data. Similarly, we notice that HAN and HAN with segmentation offer comparable performance. Across the two prediction tasks, incorporating the chart-time is crucial to improving the prediction performance as can be demonstrated by comparing HAN with CATAN. The results also suggest that the hierarchical nature of the HAN model is necessary, as T-LSTM fails to outperform the HAN model even though it can model the time decay.
D. Interpretability of Individual Words
It is imperative that model predictions be transparent especially in medical settings. As shown in Figure 1, CATAN generates importance weights, αij, for each word in the note used in the prediction task. This can help the healthcare provider better understand the relative importance of specific words in a particular note. As noted in the introduction, there has been considerable debate as to whether or not attention is equivalent to explainability [22]–[24]. Thus it is important to highlight that attention distributions should not serve as the single true faithful interpretation of the model. However, attention can be used as a tool to help better identify which part of the text is relevant [25]. Therefore, to highlight the transparency of CATAN from this perspective, we provide a case study of a sample text from a nursing note in Figure 3 for the one-year mortality task.
Fig. 3:

A nursing note with more important words shaded darker from a positive mortality class.
Figure 3 illustrates an important note (i.e., high αi) that is associated with a patient that is predicted to be positive in the one-year mortality task. Each word is shaded according to their attention weights with darker shades denoting higher importance (i.e., higher attention weights). As examples, ‘chf’ (chronic heart failure), ‘sob’ (shortness of breath), ‘dialysis’, ‘hcp’ (hereditary coproporphyria), ‘esrd’ (end stage renal disease) are a few of the most important words. Based on the selected words and the text itself, the patient is suffering from several chronic illnesses and is quite sick. The identification of such words helps to understand the prediction of a positive one-year mortality.
Thus, the identification of words from the notes can help provide better transparency to our model.
E. Interpretability of Notes
CATAN also provides transparency to the individual notes themselves. The individual note attentions (αi) can provide insight as to which notes are relevant to the prediction. An example of this is shown in Figure 4. This patient has five notes, two radiology, one ECG, and two nursing/other notes. The final Nursing/other note has much higher attention weight, while the previous 4 notes earlier in the patient timeline have less focus. In fact, the ECG note at admission has the smallest weight. From the last nursing note, we observe that a lot of words are shaded darker to indicate the importance. These words include ‘bleeding’, ‘spinal’, ‘diverticulosis’, ‘stable’, ‘hct’ (haematocrit) and ‘endo’. Notes from earlier in the admission time line do not have as many important words.
Fig. 4:

Average importance of each note category.
In addition to accounting for the temporal nature of the individual notes, the note attention weights can provide the relative average importance of each note category. To better understand the impact of the note categories on the prediction, we calculate the average importance of each note type by averaging the attention weights (αi) across all the patients. The average importance of each note type in predicting a one-year mortality is shown in Figure 4. Unsurprisingly, Discharge summary is the most important note type by a large margin. This is expected as the discharge summary contains an abundance of information including the discharge diagnosis, medication, and the future course of action. Echo, or echocardiography, which provides information on cardiac function and hemodynamics, is the second most important note. This is an essential note for assessment and management of patients with chest pain, ventricular systolic and diastolic functions, myocardial and coronary perfusion commonly administered for patients with coronary artery disease and myocardial infraction [42]. On the contrary, ECG, also used to measure the electrical activity of the heart, is not found to be as important in predicting patient mortality. This might be explained by the fact that ECG is a static picture which may not reflect severe underlying heart problems, and may not be very specific about the conditions the patient is experiencing.
The impact of the words within the note types can also be analyzed under CATAN. For each note type, we can identify the words that are more likely to be associated with a positive prediction and a negative prediction. As noted in [28], there are different uses of the same words across the various categories of notes. Table III summarizes the top 5 words among the positive and negative readmission classes. From the results, we can observe that there are limited overlap in the words between the different note types, illustrating the benefit of modeling each note type separately. Moreover, these words can offer some insight as to what the prediction model has learned.
TABLE III:
The top 5 words for positive readmission and negative readmission classes from various note types.
| Note type | Positive Class | Negative Class |
|---|---|---|
| Nursing | fingerstick Paced vomiting nippv colostomy |
mode psv trials ventilator RR |
| ECG | dysfunction narrow variable RSR inversion |
multiple failure depressions voltage ischemic |
| Radiology | serial plaques weak resulted eating |
trach amber speaking softly distended |
| Discharge Summary | incidental hydrocephalus lymphadenopathy degree diazepam |
congestion lasix speaking abdominal pac |
F. Effect of each note on the outcome
Once the patient is admitted and has at least a single note, CATAN can start predicting the outcome based on the available notes. Figure 5a shows an example where a patient’s chance of getting readmitted in 30 days if discharged at the given instance. At the beginning, the patient is predicted to have a 43% probability of readmission if discharged at that moment with HD (Hodgkin disease), MSRA (methicillin-resistant staphylococcus aureus), and SOB (shortness of breath) the most important words. The addition of more notes increases the probability of readmission, suggesting that the patient should not be discharged. For example, at time point 2 with the addition of nursing, Echo, and ECG notes, the probability increases to 0.71. At the last time point, we notice that the two nursing notes have different words that are important and that the radiology and nursing note have similar words that are important (e.g., PICC (peripherally inserted central catheter) and SOB (shortness of breath)).
Fig. 5:

An example progression of a single patient’s notes through the ICU stay using CATAN and HAN with segmentation. At a given time, the most important notes as indicated by the attention weights are shown. As more notes are added, the probability of the patient becoming a 30-readmission patient increases. The increase in the probabilities implies the patient is likely to be classified as a positive readmission if discharged at that the given time instance. Under the HAN with segmentation model, notes charted within one hour of each other are aggregated together, as denoted by Segment 1 and Segment 2. Segments with high weights are shown at each time point.
The output of CATAN can be contrasted with the HAN with segmentation model proposed in [27]. Figure 5b shows the same patient data passed through the HAN with segmentation model. Under their model, notes are merged together if they are charted within an hour of each other. The downside with this method is that we can not identify which notes are responsible for the prediction. Note that time point 2 has the original nursing note plus the first segment which combines the nursing, Echo, and ECG notes. Using this segment as a document, the model identifies ‘undetermined’,’NIPPV (noninvasive positive pressure ventilation)’ and ‘dialysis’ as the most important words from ‘Segment1’. However, which notes contributing these words are not explicitly known. This could hinder transparency as some words can have different meanings depending on the type of note they appear in. It is also worth noting that by segmenting these notes together, the probability of readmission decreases from 0.71 to 0.69. Thus, not only does CATAN have a better representation by modeling the chart-time, it also offers a better degree of transparency of the individual notes.
V. Discussion
This paper proposes the use of hierarchical attention networks for utilizing clinical notes for prediction tasks. These networks are structurally well-suited as each patient usually have multiple notes taken by a variety of healthcare providers including physicians, nurses, and radiologists. Each of these notes are independently charted and contain terms specialized for the specific domain. By representing each note as a separate entity, the learning of term importance related to each note category is facilitated. Moreover, merging all notes of a patient as a single document, the standard text representation, can cause loss of the context of the words used.
Since patient data is also chronologically collected, notes that are taken during the patient stay potentially improves the overall understanding of the patient condition. Moreover, notes charted later are usually more informative of the updated patient condition than earlier notes. By utilizing the chart time information in CATAN, we can learn better attention weights associated with the individual notes. Furthermore, by separately learning to represent each note and incorporating the chart-time of notes as an explicit weighting factor, CATAN can outperform ClinicalBERT, a state-of-the-art clinical text model.
There are several limitations of CATAN. First, the effectiveness of CATAN is tested on two predictive tasks but the dataset for both tasks is the same (MIMIC- III). It is unclear how this would generalize to other populations. Therefore, it would be interesting to experiment with other datasets to better understand the performance of our architecture. Another dimension for future work is the maximum number of words used in each note. Our hierarchical architecture uses a maximum of 500 words per note and 30 notes per patient. In MIMIC-III, there are notes with over 1000 words, which had to be truncated for computational efficiency. Increasing these settings can potentially improve the performance. Finally, CATAN is based on the notation that attention weights can offer transparency of the model and not necessarily faithful explanations of the model. Future research is necessary to better understand whether attention is truly explanation or not.
Acknowledgements
This work is supported by funding from the National Institute of Health awards #5K01LM012924 and #1R01LM013323.
Contributor Information
Zelalem Gero, Department of Computer Science, Emory University, Atlanta, USA.
Joyce C. Ho, Department of Computer Science, Emory University, Atlanta, USA
References
- [1].Adler-Milstein J, DesRoches CM, Kralovec P, Foster G, Worzala C, Charles D, Searcy T, and Jha AK, “Electronic health record adoption in us hospitals: progress continues, but challenges persist,” Health affairs, vol. 34, no. 12, pp. 2174–2180, 2015. [DOI] [PubMed] [Google Scholar]
- [2].Abul-Husn N and Kenny E, “Personalized medicine and the power of electronic health records,” Cell, vol. 177, pp. 58–69, 2019. [DOI] [PMC free article] [PubMed] [Google Scholar]
- [3].Miotto R, Li L, Kidd B, and Dudley J, “Deep patient: An unsupervised representation to predict the future of patients from the electronic health records,” Scientific Reports, vol. 6, 2016. [DOI] [PMC free article] [PubMed] [Google Scholar]
- [4].Goldstein BA, Navar AM, Pencina MJ, and Ioannidis J, “Opportunities and challenges in developing risk prediction models with electronic health records data: a systematic review,” Journal of the American Medical Informatics Association, vol. 24, no. 1, pp. 198–208, 2017. [DOI] [PMC free article] [PubMed] [Google Scholar]
- [5].Assale M, Dui LG, Cina A, Seveso A, and Cabitza F, “The revival of the notes field: leveraging the unstructured content in electronic health records,” Frontiers in medicine, vol. 6, 2019. [DOI] [PMC free article] [PubMed] [Google Scholar]
- [6].Esteva A, Robicquet A, Ramsundar B, Kuleshov V, DePristo M, Chou K, Cui C, Corrado G, Thrun S, and Dean J, “A guide to deep learning in healthcare,” Nature medicine, vol. 25, no. 1, pp. 24–29, 2019. [DOI] [PubMed] [Google Scholar]
- [7].Friedman C, Rindflesch TC, and Corn M, “Natural language processing: state of the art and prospects for significant progress, a workshop sponsored by the national library of medicine,” Journal of biomedical informatics, vol. 46, no. 5, pp. 765–773, 2013. [DOI] [PubMed] [Google Scholar]
- [8].Gehrmann S, Dernoncourt F, Li Y, Carlson ET, Wu JT, Welt J, Foote J Jr, Moseley ET, Grant DW, Tyler PD et al. , “Comparing deep learning and concept extraction based methods for patient phenotyping from clinical narratives,” PloS one, vol. 13, no. 2, 2018. [DOI] [PMC free article] [PubMed] [Google Scholar]
- [9].Richesson RL, Sun J, Pathak J, Kho AN, and Denny JC, “Clinical phenotyping in selected national networks: demonstrating the need for high-throughput, portable, and computational methods,” Artificial intelligence in medicine, vol. 71, pp. 57–61, 2016. [DOI] [PMC free article] [PubMed] [Google Scholar]
- [10].Ghassemi M, Pimentel MAF, Naumann T, Brennan T, Clifton DA, Szolovits P, and Feng M, “A multivariate timeseries modeling approach to severity of illness assessment and forecasting in ICU with sparse, heterogeneous clinical data,” in Proc. of AAAI, Bonet B and Koenig S, Eds. AAAI Press, 2015, pp. 446–453. [Online]. Available: http://www.aaai.org/ocs/index.php/AAAI/AAAI15/paper/view/9393 [PMC free article] [PubMed] [Google Scholar]
- [11].Meystre SM, Savova GK, Kipper-Schuler KC, and Hurdle JF, “Extracting information from textual documents in the electronic health record: a review of recent research,” Yearbook of medical informatics, vol. 17, no. 01, pp. 128–144, 2008. [PubMed] [Google Scholar]
- [12].Agarwal A, Baechle C, Behara R, and Zhu X, “A natural language processing framework for assessing hospital readmissions for patients with copd,” IEEE journal of biomedical and health informatics, vol. 22, no. 2, pp. 588–596, 2017. [DOI] [PubMed] [Google Scholar]
- [13].Hughes M, Li I, Kotoulas S, and Suzumura T, “Medical text classification using convolutional neural networks,” Stud Health Technol Inform, vol. 235, pp. 246–50, 2017. [PubMed] [Google Scholar]
- [14].Khadanga S, Aggarwal K, Joty S, and Srivastava J, “Using clinical notes with time series data for {ICU} management,” in Proceedings of the 2019 Conference on Empirical Methods in Natural Language Processing and the 9th International Joint Conference on Natural Language Processing (EMNLP-IJCNLP). Hong Kong, China: Association for Computational Linguistics, 2019, pp. 6432–6437. [Online]. Available: https://www.aclweb.org/anthology/D19-1678 [Google Scholar]
- [15].Liu Z, Yang M, Wang X, Chen Q, Tang B, Wang Z, and Xu H, “Entity recognition from clinical texts via recurrent neural network,” BMC medical informatics and decision making, vol. 17, no. 2, p. 67, 2017. [DOI] [PMC free article] [PubMed] [Google Scholar]
- [16].Alsentzer E, Murphy J, Boag W, Weng W-H, Jindi D, Naumann T, and McDermott M, “Publicly available clinical BERT embeddings,” in Proceedings of the 2nd Clinical Natural Language Processing Workshop. Minneapolis, Minnesota, USA: Association for Computational Linguistics, 2019, pp. 72–78. [Online]. Available: https://www.aclweb.org/anthology/W19-1909 [Google Scholar]
- [17].Huang K, Altosaar J, and Ranganath R, “Clinicalbert: Modeling clinical notes and predicting hospital readmission,” arXiv preprint arXiv:1904.05342, 2019. [Google Scholar]
- [18].Devlin J, Chang M-W, Lee K, and Toutanova K, “BERT: Pretraining of deep bidirectional transformers for language understanding,” in Proc. of NAACL-HLT. Minneapolis, Minnesota: Association for Computational Linguistics, 2019, pp. 4171–4186. [Online]. Available: https://www.aclweb.org/anthology/N19-1423 [Google Scholar]
- [19].Wang Y, Huang M, Zhu X, and Zhao L, “Attention-based {LSTM} for Aspect-level Sentiment Classification,” in Proceedings of the 2016 Conference on Empirical Methods in Natural Language Processing. Austin, Texas: Association for Computational Linguistics, 2016, pp. 606–615. [Online]. Available: https://www.aclweb.org/anthology/D16-1058 [Google Scholar]
- [20].Lee J, Shin J-H, and Kim J-S, “Interactive Visualization and Manipulation of Attention-based Neural Machine Translation,” in Proceedings of the 2017 Conference on Empirical Methods in Natural Language Processing: System Demonstrations. Association for Computational Linguistics, 2017, pp. 121–126. [Online]. Available: https://www.aclweb.org/anthology/D17-2021 [Google Scholar]
- [21].Ghaeini R, Fern X, and Tadepalli P, “Interpreting Recurrent and Attention-Based Neural Models: a Case Study on Natural Language Inference,” in Proceedings of the 2018 Conference on Empirical Methods in Natural Language Processing. Brussels, Belgium: Association for Computational Linguistics, 2018, pp. 4952–4957. [Online]. Available: https://www.aclweb.org/anthology/D18-1537 [Google Scholar]
- [22].Jain S, Mohammadi R, and Wallace BC, “An analysis of attention over clinical notes for predictive tasks,” in Proceedings of the 2nd Clinical Natural Language Processing Workshop. Minneapolis, Minnesota, USA: Association for Computational Linguistics, 2019, pp. 15–21. [Online]. Available: https://www.aclweb.org/anthology/W19-1902 [Google Scholar]
- [23].Serrano S and Smith NA, “Is attention interpretable?” in Proceedings of the 57th Annual Meeting of the Association for Computational Linguistics. Florence, Italy: Association for Computational Linguistics, 2019, pp. 2931–2951. [Online]. Available: https://www.aclweb.org/anthology/P19-1282 [Google Scholar]
- [24].Jain S and Wallace BC, “Attention is not explanation,” in Proceedings of the 2019 Conference of the North American Chapter of the Association for Computational Linguistics, 2019, pp. 3543–3556. [Online]. Available: https://www.aclweb.org/anthology/N19-1357 [Google Scholar]
- [25].Wiegreffe S and Pinter Y, “Attention is not not Explanation,” in Proceedings of the 2019 Conference on Empirical Methods in Natural Language Processing and the 9th International Joint Conference on Natural Language Processing, 2019, pp. 11–20. [Online]. Available: https://www.aclweb.org/anthology/D19-1002 [Google Scholar]
- [26].Yang Z, Yang D, Dyer C, He X, Smola A, and Hovy E, “Hierarchical attention networks for document classification,” in Proc. of NAACL-HLT. San Diego, California: Association for Computational Linguistics, 2016, pp. 1480–1489. [Online]. Available: https://www.aclweb.org/anthology/N16-1174 [Google Scholar]
- [27].Si Y and Roberts K, “Patient representation transfer learning from clinical notes based on hierarchical attention network.” AMIA Joint Summits on Translational Science proceedings. AMIA Joint Summits on Translational Science, vol. 2020, pp. 597–606, 2020. [PMC free article] [PubMed] [Google Scholar]
- [28].Feldman K, Hazekamp N, and Chawla NV, “Mining the clinical narrative: all text are not equal,” in 2016 IEEE international conference on healthcare informatics (ICHI). IEEE, 2016, pp. 271–280. [Google Scholar]
- [29].Johnson AE, Pollard TJ, Shen L, Li-wei HL, Feng M, Ghassemi M, Moody B, Szolovits P, Celi LA, and Mark RG, “Mimic-iii, a freely accessible critical care database,” Scientific data, vol. 3, p. 160035, 2016. [DOI] [PMC free article] [PubMed] [Google Scholar]
- [30].Jin M, Bahadori MT, Colak A, Bhatia P, Celikkaya B, Bhakta R, Senthivel S, Khalilia M, Navarro D, Zhang B et al. , “Improving hospital mortality prediction with medical named entities and multimodal learning,” arXiv preprint arXiv:1811.12276, 2018. [Google Scholar]
- [31].Ghassemi M, Naumann T, Doshi-Velez F, Brimmer N, Joshi R, Rumshisky A, and Szolovits P, “Unfolding physiological state: mortality modelling in intensive care units,” in Proc. of KDD, Macskassy SA, Perlich C, Leskovec J, Wang W, and Ghani R, Eds. ACM, 2014, pp. 75–84. [Online]. Available: 10.1145/2623330.2623742 [DOI] [PMC free article] [PubMed] [Google Scholar]
- [32].Tran T, Luo W, Phung D, Morris J, Rickard K, and Venkatesh S, “Preterm birth prediction: Deriving stable and interpretable rules from high dimensional data,” in Conference on machine learning in healthcare, LA, USA, 2016. [Google Scholar]
- [33].Lucini FR, Fogliatto FS, da Silveira GJ, Neyeloff JL, Anzanello MJ, Kuchenbecker RS, and Schaan BD, “Text mining approach to predict hospital admissions using early medical records from the emergency department,” International journal of medical informatics, vol. 100, pp. 1–8, 2017. [DOI] [PubMed] [Google Scholar]
- [34].Boag W, Doss D, Naumann T, and Szolovits P, “What’s in a note? unpacking predictive value in clinical note representations,” AMIA Summits on Translational Science Proceedings, vol. 2018, p. 26, 2018. [PMC free article] [PubMed] [Google Scholar]
- [35].Liu J, Zhang Z, and Razavian N, “Deep ehr: Chronic disease prediction using medical notes,” arXiv preprint arXiv:1808.04928, 2018. [Google Scholar]
- [36].Xu K, Lam M, Pang J, Gao X, Band C, Xie P, and Xing E, “Multimodal machine learning for automated icd coding,” arXiv preprint arXiv:1810.13348, 2018. [Google Scholar]
- [37].Mullenbach J, Wiegreffe S, Duke J, Sun J, and Eisenstein J, “Explainable prediction of medical codes from clinical text,” in Proc. of NAACL-HLT. New Orleans, Louisiana: Association for Computational Linguistics, 2018, pp. 1101–1111. [Online]. Available: https://www.aclweb.org/anthology/N18-1100 [Google Scholar]
- [38].Baytas IM, Xiao C, Zhang X, Wang F, Jain AK, and Zhou J, “Patient subtyping via time-aware LSTM networks,” in Proceedings of the 23rd ACM SIGKDD International Conference on Knowledge Discovery and Data Mining, Halifax, NS, Canada, August 13 – 17, 2017. ACM, 2017, pp. 65–74. [Online]. Available: 10.1145/3097983.3097997 [DOI] [Google Scholar]
- [39].Wang S, McDermott M, Chauhan G, Hughes MC, Naumann T, and Ghassemi M, “Mimic-extract: A data extraction, preprocessing, and representation pipeline for mimic-iii,” arXiv preprint arXiv:1907.08322, 2019. [Google Scholar]
- [40].Purushotham S, Meng C, Che Z, and Liu Y, “Benchmark of deep learning models on large healthcare mimic datasets,” arXiv preprint arXiv:1710.08531, 2017. [Google Scholar]
- [41].Harutyunyan H, Khachatrian H, Kale DC, Steeg GV, and Galstyan A, “Multitask learning and benchmarking with clinical time series data,” arXiv preprint arXiv:1703.07771, 2017. [DOI] [PMC free article] [PubMed] [Google Scholar]
- [42].Tomoaia R, Beyer RS, Simu G, Serban AM, and Pop D, “Understanding the role of echocardiography in remodeling after acute myocardial infarction and development of heart failure with preserved ejection fraction,” Medical ultrasonography, vol. 21, no. 1, pp. 69–76, 2019. [DOI] [PubMed] [Google Scholar]