Abstract
Dispersion-based inversion has been proposed as a viable direction for materials characterization of arteries, allowing clinicians to better study cardiovascular conditions using shear wave elastography. However, these methods rely on a priori knowledge of the vibrational modes dominating the propagating waves induced by acoustic radiation force excitation: differences between anticipated and real modal content are known to yield errors in the inversion. We seek to improve the accuracy of this process by modeling the artery as a fluid-immersed cylindrical waveguide and building an analytical framework to prescribe radiation force excitations that will selectively excite certain waveguide modes using ultrasound acoustic radiation force. We show that all even-numbered waveguide modes can be eliminated from the arterial response to perturbation, and confirm the efficacy of this approach with in silico tests that show that odd modes are preferentially excited. Finally, by analyzing data from phantom tests, we find a set of ultrasound focal parameters that demonstrate the viability of inducing the desired odd-mode response in experiments.
1. Introduction
Changes in arterial structure play a critical role in the pathology of myriad health conditions, from coronary artery disease to atherosclerosis [1–6]. Quantifying structural changes through shear wave elastography, using an initial ultrasound pushing beam to apply acoustic radiation force followed by ultrasound tracking of the resultant wave motion, allows clinicians and scientists to assess these conditions and prescribe appropriate interventions [7–9].
Using shear wave elastography to evaluate properties like the elastic modulus requires the solution of an inverse problem. To reduce the complexity of the inversion, many simplifications and assumptions are made throughout the literature, beginning with the geometry: the artery is commonly treated as a cylinder with constant radius and wall thickness [10–16]. This simplified geometry can be leveraged to treat the artery as a cylindrical waveguide and decompose its motion into combinations of characteristic vibrational modes, allowing for inversion through study of wave dispersion [17–20]. In their paper validating such a dispersion-based method, Roy et. al. note that, although most authors treat the arterial motion as being dominated by a single mode, significant contributions from multiple modes are present [20, 21]. They find that failing to correctly account for this multimodal nature reduces the accuracy of material property estimates, posing additional challenges for inversion [21].
We propose to mitigate this source of inaccuracy and increase the robustness of arterial elastography procedures by prescribing a way to perform ultrasound shear wave elastography experiments such that the induced waveguide modes can be preferentially controlled without a priori knowledge of the arterial properties. Our approach is developed in two stages: an analytical stage, in which we link the forcing applied by the ultrasound pushing beam to the arterial walls to the resultant motion; and a testing stage consisting of a simulation, in which the force applied to the artery is made to match the analytical model exactly, and an analysis of experimental data collected from an arterial phantom.
The foundation of the analytical stage of our process is the study of the characteristics of waves induced during shear wave elastography experiments. We make use of the complete description of arterial motion afforded by the cylindrical waveguide model to determine which external and geometric factors will help us control the possible responses to perturbation. In doing this, we keep cases for which the cylindrical waveguide assumptions are most accurate, such as the study of the carotid artery, at the forefront of our consideration [17, 22]. To proceed, we link the forces applied to the artery walls and the waveguide modes that combine to represent the induced motion. This approach was pioneered by Ditri and Rose, who developed a mathematical approach to compute the amplitude of any given mode at any point along the length of a cylindrical waveguide in response to loading [23–25]. We expand the scope of their work and tailor it specifically to clinical ultrasound applications by introducing a model of the artery as a fluid-immersed structure rather than a free cylinder, and by modeling the load as an acoustic radiation force applied uni-directionally from an external transducer. This expanded model allows us to derive an abstract loading parameter, related to ultrasound focal properties and the balance of forces on the opposite walls of the artery, that indicates the degree to which we can cancel out a large subset of possible modes. We find that, for specific values of this parameter, it should be possible to eliminate all even-numbered circumferential waveguide modes from the arterial response regardless of material properties.
To the best of our knowledge, no other study has examined controlling arterial motion by tuning focal parameters to cancel out specific sets of waveguide modes. Thus, we perform a series of simulations and phantom experiments to test our prescription for simplifying the arterial motion. First, we perform finite element simulations to quantify the degree to which different modes participate in the arterial response under conditions that conform exactly to the analytical study. Next, we conduct experimental studies with the goal of finding ultrasound focal parameters that can be used as proxies for the abstract loading parameter we determined analytically, and to infer the best way to translate our methods to in vivo testing.
The remainder of this paper is organized as follows: in Section 2, we develop the theoretical frameworks for the waveguide formulation and our experimental model; Section 3 discusses the setup and results of our simulations and arterial phantom experiments; finally, we conclude and summarize our findings in Section 4.
2. Theory
2.1. Arterial Model
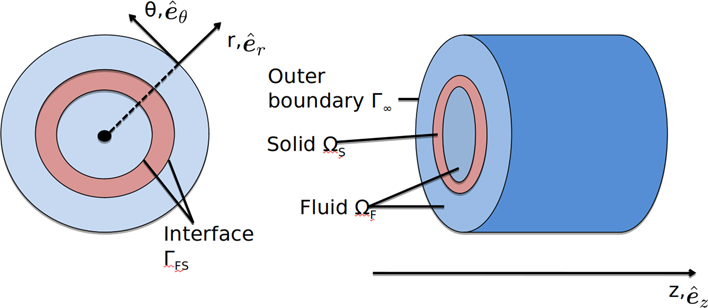
Our goals in this section are to build the simplified arterial model we will use to perform our analysis, present the acoustic and elastodynamic equations that govern it, and develop an expression for the amplitudes of waveguide modes. We begin by defining the artery as a cylindrical, fluid-immersed waveguide, as shown in Fig. 1. This approach was developed during our previous work with Astaneh et al. on modeling shear wave elastography (SWE), detailed in [20].
Figure 1:
Simplified geometry of a segment of artery, colored pink, immersed in fluid, colored blue. The cylindrical coordinate system (r, θ, z) with unit vectors , , , is shown in cross-section (left) and from the side (right). We assume the artery extends infinitely in the longitudinal z direction.
Elastodynamic and acoustic equations govern the solid and fluid domains ΩS and ΩF, respectively. In the solid domain, we work in cylindrical coordinates and wish to relate the vector displacement u(r, θ, z, ω), the stress tensor σ(r, θ, z, ω), and the scalar pressure p(r, θ, z). Dropping all dependencies and writing u, σ, and p henceforth for simplicity, we write the equations governing ΩS as
| (1a) |
| (1b) |
where Eqn. (1a) represents conservation of momentum and relates the divergence of σ to u, modified by the frequency ω and the density of the solid ρS, which is taken to be uniform. Boundary equation (1b) ensures equilibrium on the inner boundaries by balancing σ against p, applied along the normal nS to the fluid-solid interface ΓFS. We treat the material as homogeneous, isotropic, and nearly incompressible, and define the constitutive equation to be a linearelastic stress-strain relation, as in
| (2) |
where : denotes the double scalar product and is the isotropic fourth-order elasticity tensor. The second-order strain tensor ϵ, assumed to be small in magnitude throughout the waveguide, is given by
| (3) |
The assumption of small strain is justified by the typical displacement induced by radiation force, which we have found to be small compared to the characteristic length scale of the arterial wall [20]. Moving to the fluid domain ΩF, we write the acoustic governing equations, assuming no body forces, as
| (4a) |
| (4b) |
| (4c) |
where ∇2 denotes the Laplacian operator, k is the frequency-dependent wave number, and represents the partial derivative with respect to the fluid surface normal nF. Eqn. (4b) describes a non-reflecting boundary condition applied to the outer fluid boundary, Γ∞, using constants g1 and g2 calibrated for the domain geometry [26]. Finally, Eqn. (4c) couples the fluid and solid equations, invoking a uniform fluid density ρF.
According to waveguide theory and normal mode expansion, u, σ, and the velocity v(r, θ, z, ω) can be written as infinite sums of the orthogonal modal fields ηm(r, θ), ξm(r, θ), and ϕm(r, θ), respectively [18]. Here, is an index differentiating circumferential modal fields referred to as the mode number. Note that we consider circumferential modes only: we have found that these modes dominate the arterial motion in our frequency range of interest, 200 Hz to 1000 Hz, with the exception of the first longitudinal mode. However, we find later in our derivation that this mode can be eliminated from the arterial response, and so we limit our consideration to circumferential modes throughout for simplicity. While a similar expression can be derived for p, we are focused solely on quantities used within the solid. Suppressing all variable dependencies and assuming we are working at a single, arbitrary frequency ω0, we can write the expansions for u, v, and σ as
| (5a) |
| (5b) |
| (5c) |
where the constants αm, βm, γm are scalar weights associated with each mode. The wavenumber k, which is already understood to be dependent upon frequency, is now written km to reflect an additional dependence on the mode number. Furthermore, the modal fields ηm, ϕm, and ξm are all defined over a cross-section of the cylindrical waveguide. The modal displacement can be written explicitly as [18]. To illustrate the cross-sectional shapes produced by ηm, we plot the displacement field along the outer circumference of the waveguide cross-section for m = 1, 2, 3 in Fig. 2:.
Figure 2:
Displacement vector fields, plotted at points uniformly sampled around the outer-wall circumference of an arbitrary cylindrical cross-section, illustrating the cross-sectional shapes for circumferential modes m = 1, 2, 3 (a) - (c). It can be seen that odd modes produce antisymmetric fields, whereas even modes produce symmetric displacements.
We are interested in finding the relative amplitudes of these modal fields in order to determine their degrees of contribution to the total response. Because ultrasound experiments typically measure particle velocity rather than particle displacement, we work with the modal velocities ϕ and combine the scalar weight and z-dependent exponential in Eqn. (5b) into a general amplitude Am, writing
| (6) |
where is the amplitude of the m-th mode for a cylindrical cross-section located at longitudinal position z and at time t. For the sake of simplicity and clarity, we will suppress the use of the e−iωt factor in future equations; it is assumed that all waveguide modes will propagate in this way in time. This modal amplitude expansion mirrors the steps taken by Ditri and Rose [23], and allows us to continue to follow their process for developing an equation for Am in terms of ϕm and σ. The next step is to relate two arbitrary modal states, denoted 1 and 2, characterized by the field pairs v1, σ1 and v2, σ2, using the reciprocity relation
| (7) |
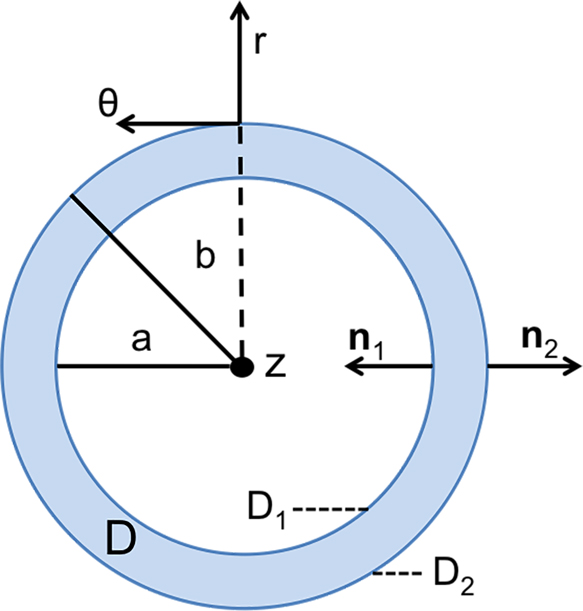
where an over-bar, as in , indicates the complex conjugate transpose. To employ this particular reciprocity relation, we have assumed that the only sources of excitation in the entire solid-fluid domain can be treated as originating on, or being applied directly to, the surface of the solid [27]. This restriction to cross-sections of the solid waveguide makes a more granular description of the arterial cross-section useful, as shown in Fig. 3 where D is the cross-sectional area, a and b are inner and outer radii, and ∂D1 and ∂D2 are the inner and outer boundaries, respectively. Using this representation of the domain, we substitute Eqn. (6) into Eqn. (7), integrating and applying the divergence theorem to produce a formula for Am; this derivation can be found in full detail in [23]. The result, relating the stresses and velocities to the modal amplitude, is given by
| (8) |
Here, the factor Pmm represents an abstract measure of the power transferred to mode m, serving to normalize the numerator of the expression and render Am unitless; its form is given explicitly in [23]. The limits of integration in z include an arbitrary starting point c, somewhere along the infinite length of the waveguide. Note that the line integrals on the edges of the cross-section depend on and , which can be interpreted as tractions and . Explicit definition of these tractions yields an opportunity to develop a model for ultrasonic SWE linking the experimental parameters governing τ1 and τ2 to the amplitudes of each potential mode m.
Figure 3:
Detailed arterial cross section specifying inner and outer surfaces D1 and D2 along with their accompanying normal vectors, used to define the bounds of the modal amplitude equation, Eqn. 8. The entire cross-sectional area is denoted as D.
2.2. Variable Ultrasound Beam Parameterization
In this section we show that a simple, one-parameter experimental model yields a method for driving the amplitudes of all even-numbered modes to zero. By explicitly defining the form of the tractions applied to the waveguide, we can build a model for ultrasonic SWE that links experimental parameters to the modal amplitudes Am given by Eqn. 8.
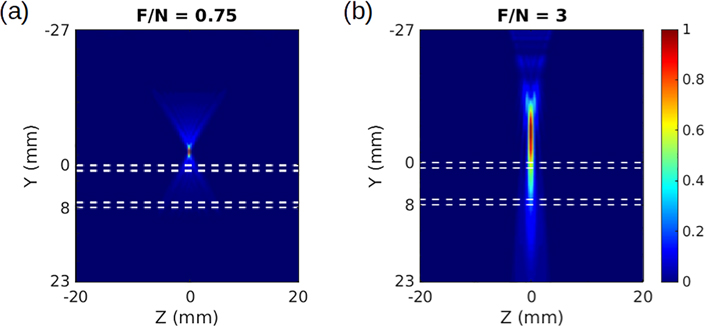
We begin to investigate ARF-induced tractions by considering two beam intensity profiles from ultrasound propagation simulations in the Field II software, shown in Fig. 4 [28]. The intensity is simulated for a L7–4 linear array transducer (Philips Healthcare, Andover, MA) with focal numbers (F/N) of 0.75 and 3 (F/N = focal depth/aperture width). A lower focal number corresponds to a more focused beam.
Figure 4:
Ultrasound beams simulated in Field II and seen in profile, passing through a tube with 1 mm thick walls outlined by white dashed lines. The face of the ultrasound transducer is positioned at Y = −27 mm. Different focusing leads to rapidly diminishing beam intensity with depth in (a), and a beam that strongly pushes both top and bottom walls in (b). The intensities have been normalized to range from 0 to 1, according to the color bar on the right.
An apparent difference between the two beams in Fig. 4 is the degree to which they penetrate the artery and maintain intensity and pushing force on the bottom wall. This motivates us to investigate the influence of differing tractions on the arterial walls. We treat the ultrasound beam as applying its force directly to the outer surface of the upper and lower walls (confined to D2, as shown in Fig. 3) and assume that its spatial footprint does not change appreciably as it travels. Though we could achieve the same results using an arbitrary symmetrical footprint, we consider the area of the beam to be rectangular for the sake of simplicity; this assumption is justified by the fact that an ultrasound beams typically has a cigar-shaped footprint. Furthermore, we make use of a simple separable traction to simplify our mathematical treatment and to enforce notions of the finite extent of the ultrasound transducer [23]. We write a general traction τ(θ, z), applied to the solid outer surface D2, as a product of purely longitudinal and circumferential factors τz(z) and τθ(θ), given by
| (9) |
Where
| (10a) |
| (10b) |
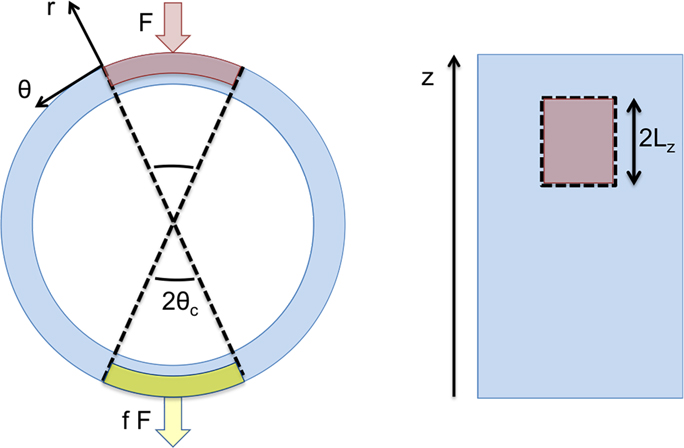
In these equations, F denotes the amplitude of the force applied to the upper surface, while θc and Lz are constants defining the circumferential and axial extent of the beam’s area, respectively; this setup is shown in Fig. 5 below. To increase readability in future expressions, we will suppress the θ and z dependencies for the tractions. Finally, f ∈ [0, 1] is a parameter we name the beam penetration coefficient, which describes how efficiently the intensity of the beam is maintained as it travels through the upper arterial wall, crosses the lumen, and impinges upon the lower arterial wall; in other words, f represents the balance of forces between the artery walls. In a highly-focused case like the one in Fig. 4a, we would assume f ≈ 0, whereas an intermediate value like f ≈ 0.75 would be appropriate for the less-focused beam in Fig. 4b. Though there is no simple experimental indicator for f, one can intuit that changing focal parameters will change the balance of forces on the arterial walls, and thus impact f.
Figure 5:
Cross-sectional (left) and top (right) views of artery segment with the areas of influence for the variable beam bounded by dotted lines. In the cross-section, the forces applied to the top and bottom, acting over red and yellow patches, respectively, are shown. The magnitude of the force on the lower surface is scaled by penetration coefficient f, ranging from 0 to 1.
It should be noted that the application of a load to the arterial walls modifies the boundary condition balancing forces on the fluid-solid boundary, expressed in Eqn. (1b), by the addition of τ. In order to determine a relationship between f and Am, we substitute the traction given in Eqn. (9) into the amplitude formula, Eqn. (8), in place of τ2 since we are only applying traction to the outer surface. This yields
| (11a) |
| (11b) |
We collect the factors in Eqn. 11b into three terms
| (12a) |
| (12b) |
| (12c) |
representing a modal power factor Pm, a modal longitudinal factor Zm, and a modal cross-sectional shape factor Sm, respectively. Rewriting Eqn. (11b) in terms of these factors yields a simplified expression for the amplitude Am
| (13) |
Evidently, Am is proportional to each of the modal factors of Eqn. (12). Focusing solely on Sm, we substitute τθ from Eqn. (10) into Eqn. (12c) and derive an expression in terms of experimental parameter f as
| (14) |
The derivation of Eqn. 14, along with a discussion of the longitudinal modes in the motion, can be found in Appendix A. The significance of this result becomes apparent if we consider the forms of Sm for odd m and even m; we absorb everything beyond f into multiplicative constants and consider only the proportionality of Sm to the resulting f terms, given by
| (15a) |
| (15b) |
We see that for even modes, as f approaches 1 the shape term Sm vanishes. For a perfectly penetrating beam that applies equal loading to both walls, f = 1 and the proportionality relation in Eqn. (15b) implies that the amplitudes of all even modes will be zero. Thus, we can assert control over the induced modes in a real experiment by getting as close as possible to an ideal penetrating beam, thereby eliminating even modes from the arterial response.
3. Numerical and Experimental Studies
The analysis of the previous section left us with a prescription for producing simplified arterial responses to ARF: use an ultrasound beam that completely penetrates the artery, with f close to 1. We test this prescription by analyzing the wall particle velocity data generated by beams with varying degrees of penetration and evaluating a measure of modal participation, confirming the presence or absence of even and odd modes.
In the remainder of this section we describe two sets of tests, including the measures for determining modal participation that accompany them and their results: first, we use a finite element approach to simulate an experimental response to ultrasound excitation and quantify the modal response using a modal participation factor (MPF), developed by exploiting modal orthogonality; second, we create a correlative metric for modal response that allows us to bridge the gap between simulated and experimental data, and analyze data from an ARF experiment using a water-immersed artery-mimicking phantom. It is important to note the limitations of these studies: in the finite element model we simulate ARF solely by use of tractions on the artery walls in order to exactly match the analytical model, rather than modeling the propagation of a wave from an ultrasound source and through the domain; in the experiments, we cannot recover the parameter f directly, leading to some degree of uncertainty in our comparison with the theoretical model. Additionally, we lack sufficient knowledge of the material properties of the phantoms to perform inversions and quantify the accuracy of our results, leading us to rely on the correlation metric. However, in light of the clear implications of our analytical model and our means for analyzing the motion of real and simulated arteries, we do not believe that these limitations prevent us from drawing valuable conclusions about the viability of controlling the response to ARF excitation.
3.1. ARF Simulation
We develop our simulation of an ARF experiment by translating the solid and fluid equations, Eqn. (1) and Eqn. (4), into the finite element framework. We derive appropriate weak formulations and implement them in the SIERRA finite element analysis suite, as shown in [26, 29]. A tube geometry is created, with a total length of 120 mm in z with an inner radius of 3 mm and thickness of 1 mm, and properties matching a stiff rubber with average shear and loss moduli of 550 kPa and 75 kPa over the 1 – 1000 Hz frequency range. These material properties were chosen based on the rubber used in an artery-mimicking phantom, evaluated with a Rheospectris C500+ (Rheolution, Inc., Montreal, Quebec, Canada) [30]. The finite element model itself used approximately 900,000 elements for the entire solid-fluid domain, and the element sizes were chosen by performing a convergence study. It should be noted that our analytical formulation is independent of the material properties and particular geometry of the solid, so long as it approximates a cylindrical waveguide. Because we are able to apply loads exactly matching those specified by our formulation, we expect no significant deviations in modal response for different tubes; thus, we perform simulations using only one geometry and set of material properties. Extending our modeling capability to use loading informed by the Field II simulations is a goal for future work.
Moving from the solid to the fluid domain, we add water, defined by ρF = 1000 kg/m3 and wave speed c = 1500 m/s, within and outside the cylinder; the outer cylinder of fluid is given a thickness of 3 mm. Furthermore, we designate two vertically-aligned patches on the top and bottom arterial walls at one end of the tube (as in Fig. 5), measuring 2 mm × 1 mm in correspondence with simulations of the ultrasound beam footprint, for the force application. On the circular cross section at the end of the tube where this load is applied, we use a symmetric boundary condition. On the opposite end of the tube and at the outer fluid boundary, we use a non-reflecting condition to prevent reflected waves from traveling back through the domain and corrupting the natural response. The load itself is applied as a pulse that ramps from zero to full amplitude linearly over 100 microseconds, and is then maintained for an additional 900 microseconds before an immediate shutoff. This pulse duration is approximately twice as long as the pulse used experimentally; this is necessitated by differences in the simulated and real loading, and our need to estimate the ultrasound force. Thereafter, all three components of the resultant velocities and displacements are recorded at all nodes throughout the domain at 0.5 millisecond intervals over a span of 50 milliseconds. This sampling rate was chosen to minimize data overhead and simulation size, and produces the necessary resolution in the frequency domain for our analysis. Two simulations are performed using these parameters: one in which the loading is applied with equal magnitude to the top and bottom loading patches, corresponding to the fully penetrating beam case; and one in which only the top of the cylinder is loaded, intended to produce a response containing all waveguide modes.
3.1.1. Modal Participation Factor (MPF)
To assess which modes are present in the simulated velocity field, we make use of the fact that the modes which sum up to make v, as in Eqn. (6), are mutually orthogonal. Thus, for mode m and arbitrary frequency ωj, we can express the MPF ψmj using an inner product to project the mode shape onto the measured velocity, writing
| (16a) |
| (16b) |
where is the normalized simulated velocity field represented in the frequency domain, defined as with ‖·‖ denoting the L2 norm and vj designating the component of the Fourier-transformed velocity at frequency ωj. The , as defined in Eqn. 5b, is already taken to be a normalized vector field, and so the MPF will produce a value between 0 and 1; a 1 indicates that, at that frequency, mode m is the only mode participating. In practice, we approximate the integral given in Eqn. (16b) using finite elements.
3.1.2. ARF Simulation Results
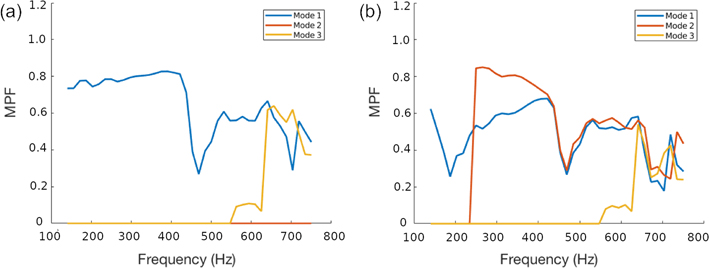
We extract particle velocity fields from the ARF simulations described in the preceding subsections and analyze the MPF for modes 1, 2, and 3 in each. Fig. 6 compares these MPFs for the penetrating and single-surface loading cases ( f = 1 and f = 0, respectively). In the single-surface case, we see that all modes make significant contributions to the signal above 600 Hz, with mode 2 beginning to participate at relatively low frequencies. In the penetrating beam case, on the other hand, mode 2 makes a negligible contribution throughout the entire observed frequency range.
Figure 6:
MPF values computed using data from finite element simulations of a penetrating beam with f = 1 (a), showing that the odd modes dominate and mode 2 is absent, and for a beam focused only on the top arterial surface with f = 0 (b), where a mixed-mode response is generated. All three components of particle velocity were used in the computation, and the bounds in frequency were chosen to minimize numerical errors associated with the size of the mesh elements.
However, we note several deviations from perfect modal participation. This is expected because the applied load does not exactly conform to any of the harmonics; there are contributions to all the odd modes for the penetrating beam case, and all odd and even modes for the excitation at the top surface. Consistent with this, the participation of mode 2 is negligible for the entire frequency range for the first case, while it is non-zero for the single-surface case. Interestingly however, for the penetrating beam case, the participation of mode 3 is minimal until around 550 Hz; this is attributable to the fact that mode 3 is evanescent at lower frequencies, decaying rapidly outside the immediate footprint of the applied force and yielding a negligible participation factor.
Similar observations are made for the case in which only the top surface is excited. In this case mode 2 makes negligible contributions below 250 Hz, where that mode is expected to be evanescent. Again we see this evanescence affect mode 3, which does not contribute below 550 Hz. Finally, we note that the participation factors are affected by the non-physical effects of numerical artifacts from discretization, leakage, and spurious boundary reflections. Notwithstanding these limitations, our results in Fig. 6 confirm that odd modes are strongly emphasized and mode 2 is diminished for the penetrating beam case.
3.1.3. Correlation Factors for Modal Participation
By using all three components of particle velocity to compute modal participation throughout our subvolume of interest, we are assured that the modal fields display orthogonality and that MPF values between zero and one are indicative of the relative contribution of a given mode to the response. However, in experiments and clinical applications, one cannot obtain such complete data. In these cases, we recover only vy, the component of velocity parallel to the ultrasound beam, and the region observed is limited to two lines of points: one running lengthwise down the artery and averaged throught the thickness top wall (the line of points closest to the transducer), and another directly opposite, averaged through the thickness of the lower wall. This data is insufficient to guarantee modal orthogonality, so we develop another metric to quantify modal participation.
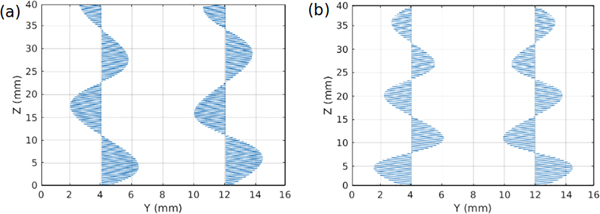
We look to the modal particle velocity fields, and observe the one-dimensional (1D) fields along the two lines of measured points for both mode 1 and mode 2 at a particular frequency, shown in Fig. 7.
Figure 7:
Example particle velocity fields in 1D, displaying the radial component, sampled along the outer surfaces of the front and back arterial walls, at θ = 90° and θ = 270°, for mode 1 (a) and mode 2 (b), demonstrating asymmetry across the artery’s central axis for mode 1 and symmetry for mode 2.
We see that, at any given point on the line, the particle velocities for mode 1 are antisymmetric across the centerline of the artery, and those for mode 2 are symmetric. Therefore, we would expect that, for a signal dominated by mode 1 and other odd modes, most pairs of points on the front and back walls would be moving in the same direction, while they would move in opposite directions for mode 2 and signals dominated by even modes. From this observation we develop Ct, a measure of the degree of correlation of the point pairs along the length of the artery at any arbitrary time, given by
| (17) |
where vf(zj, ti) and vb(zj, ti) represent the radial components of velocity at the j-the point zj along the arterial length and at time ti on the front wall and back wall, respectively. This correlation takes a value of 1 for perfectly antisymmetric data, indicating odd modes, and a value of −1 for symmetric data, indicating even modes. Values near zero are indeterminate; the motion is neither symmetric nor antisymmetric.
3.1.4. Correlation Factors for ARF
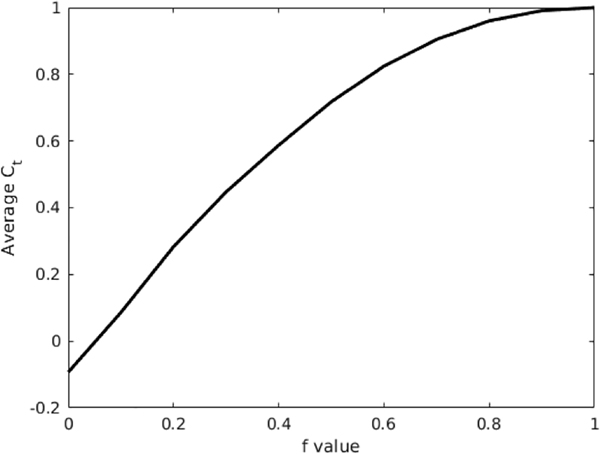
We compute Ct for the penetrating and single-surface loading cases in our simulated data, and perform additional tests with a series of intermediate f values to show how Ct changes with the degree of beam penetration. The time correlation proves less sensitive to the numerical discrepancies shown by the MPF: we see a value of 1, indicating odd-mode behavior, for the penetrating case, and an oscillatory intermediate value for the single-surface case, as expected. Looking closer at the transition from one case to the other, we plot the average Ct values for varying f in Fig. 8; we see here that the value of Ct approaches 1 as f approaches 1, as expected [31].
Figure 8:
The Ct values averaged over time for finite element simulations using f values ranging from 0 to 1 in increments of 0.1. This illustrates that Ct, and thus the correlation of the velocity with odd modes and antisymmetric motion, increases with f.
3.2. Arterial Phantom Experiments
3.2.1. Experimental Design
We analyzed data from a series of ultrasound tests conducted on an arterial phantom immersed in water, in order to determine which combination of two experimental parameters, focal number and focal depth, produces a response most closely correlated, through Ct, with a penetration coeffciient f near 1, odd modes, and antisymmetric motion. This dataset was chosen because a phantom study was a natural intermediate step before designing in vivo experiments, and because the parameters varied clearly serve to imbalance the forces on the front and back walls, producing cases similar to those seen in Fig. 4 and allowing us to draw parallels with our analytical model.
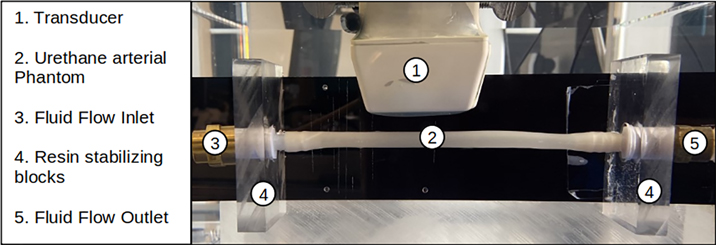
The experiments (setup shown in Fig. 9) were conducted on a urethane rubber tube (VytaFlex™ 30, SmoothOn, Inc., Macungie, PA), which is used as an artery mimicking phantom. Urethane rubber has been shown to exhibit elastic properties similar to ex vivo and in vivo arteries, with an elastic modulus between 400 kPa and 600 kPa [12, 32–35]. The phantom was immersed in a de-gassed water tank (AIMS III Scanning Tank, Onda Corporation, Sunnyvale, CA). The ARF push and detection sequence was executed using a Verasonics ultrasound research system (V1, Verasonics, Inc., Kirkland, WA) and a linear array transducer (L7–4, Philips Healthcare, Andover, MA). The push duration was 200 μs and the F/N was set to 0.75 and 3. The field-of-view of 40 × 40 mm with pixel sizes of 0.154 × 0.154 mm was reconstructed. The temporal duration of the measurement was 15 ms. Imaging was performed using plane wave compounding (PWC) with three plane waves at −4°, 0°, +4° [36]. The pulse repetition period was 85 μs, corresponding to a pulse repetition frequency (PRF) of 11.765 kHz. Since three angles are used to reconstruct one frame with PWC, the effective pulse repetition frequency (PRFe) is 3.922 kHz. The in-phase/quadrature (IQ) data from each acquired plane wave transmission was saved and was processed offline with a moving average PWC algorithm to allow for the recovery of motion with full frame rate while taking advantage of signal-to-noise ratio improvements with PWC [37]. The motion was estimated using 2D autocorrelation over the entire field-of-view, using spatial and temporal averaging windows with sizes of 3 and 2 pixels, respectively [38]. The spatial window length was 0.462 mm and the temporal window length was 510 ms. The particle velocity was extracted for the front and bottom walls of the tube phantom, and averaged through the thickness of the walls.
Figure 9:
Experimental setup, with an ultrasound transducer positioned over an arterial phantom immersed in water. There are approximately 20 mm of separation between the transducer head and the top wall of the artery, and the transducer is used both to perturb the artery and to make measurements.
3.2.2. Results
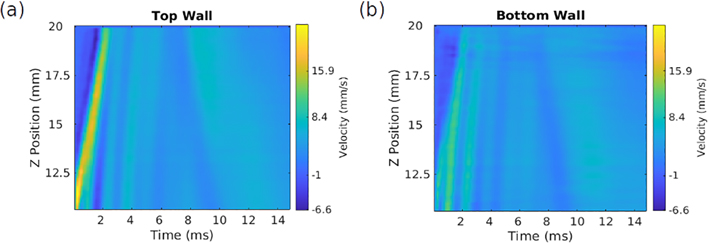
Having shown that using f = 1 emphasizes odd over even modes in simulations, we set out to show, using Ct rather than the MPF, that the same holds in experiments approximating the simulated conditions. To do this, we must determine appropriate which focal depths and beam widths yield a Ct value near 1 for the duration of the measurement, indicating a penetrating beam. From Fig. 4, we expect that a widely-focused beam, using a focal number (F/N) near 3 and focused at or below the tube midline will best reproduce our theoretical conditions: a beam with equally-sized footprints on the top and bottom walls, applying approximately equal force to each. The study used two F/N values, 3 and 0.75, and varied the focal depth for each. A representative sample from this data is shown in Fig. 10, illustrating the velocity profile over time on the top wall of the phantom.
Figure 10:
Particle velocity (m/s) data illustrating a wave propagating along the top wall (a) and bottom wall (b) of the arterial phantom for F/N = 3, with the ultrasound beam focused just below the bottom wall at a depth of 10 mm. It can be seen that the initial behavior persists for approximately 5 ms, after which the character of the wave changes.
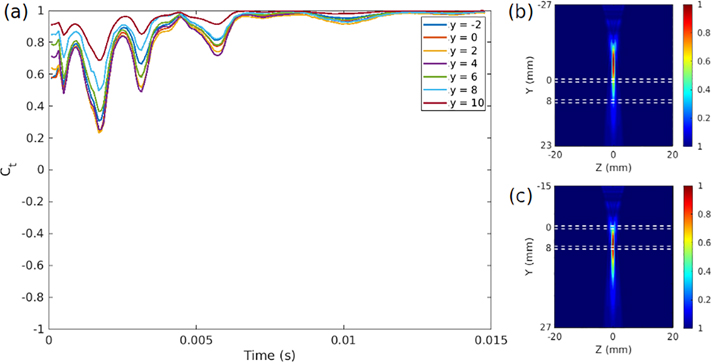
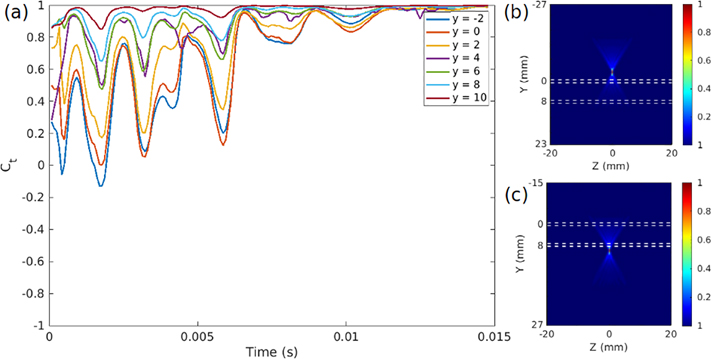
It can be seen in Fig. 10 that a single wavefront propagates outward along the artery for the first 5 milliseconds of the signal, after which the velocity pattern changes; this holds generally for all of the data. The results of a correlation analysis of these velocities, in Figs. 11 and 12, imply that as the focal depth increases and eventually drops below the lower arterial wall, the response becomes dominated by odd modes for greater and greater portions of the propagation time.
Figure 11:
(a) Front wall/back wall velocity correlation at every point in time for data collected with varying focal depths for a beam with F/N = 3 focal characteristics, denoting a “widely focused” beam like the one seen in Fig. 4b. As the depth increases, and as the focus moves below the bottom wall of the artery, the correlation approaches 1 at all times, indicating an aysmmetric mode of motion that strongly correlates with odd waveguide modes. On the right side are intensity plots of the ultrasound wave propagation at the highest (b) and lowest (c) focal depths, showing that the lower focal depths produce beam distributions that we would expect to influence both the top and bottom walls to similar degrees.
Figure 12:
(a) Front wall/back wall velocity correlation at every point in time for data collected with varying focal depths for a beam with F/N = 0.75 focal characteristics, denoting a “narrowly focused” beam like the one seen in Fig. 4a. As the depth increases, and as the focus moves below the bottom wall of the artery, the correlation approaches 1 at all times, indicating an aysmmetric mode of motion that strongly correlates with odd waveguide modes. On the right side are intensity plots of the ultrasound wave propagation at the highest (b) and lowest (c) focal depths, illustrating a surprising result: low focal depths, at or below the lower arterial boundary, produce motion correlated with odd modes, while this is not true for beams focused at or above the upper boundary.
The ultrasound intensity plots for varying focal depths show that the beams producing the highest correlation values are those that act on both walls of the artery. For the focal number 3, shown in Fig. 11, the wide beam seems to produce a relatively high degree of penetration at all focal depths, but with notable improvement when the foci are at or below the lower wall. For the focal number 0.75, shown in Fig. 12, the narrow focus yields intermediate Ct values until the beam is focused at or below the lower wall. The success of this case is notable because our analytical formulation uses beam footrpints of equal size on both arterial walls, which is clearly not the case for a highly focused beam. This seems to indicate that the critical factor is simply the relative forces on both walls: the tightly focused beam successfully pushes both surfaces when focused appropriately. These results corroborate our analytical supposition that a penetrating beam minimizes even-numbered symmetric modes and produces a response that is dominated by odd modes, and further show that focal depth is the most important proxy for the penetration coefficient f.
The strength of these results is that we see a clear link between the predictions of our analytical model and the behavior of a real, artery-mimicking structure. We now know that focusing acoustic radiation force excitation on the lower wall of the artery is critical for amplifying odd waveguide modes in phantoms, but the implications of our work for in vivo applications require further discussion. We will address the material surrounding the artery, modeling of the ultrasound beam and ultrasound attenuation, limitations of the phantom study, and logical next steps for future research.
Our first consideration for in vivo work is the tissue that surrounds the artery. Our model and phantom experiments both use water inside and outside the artery, creating a homogeneous medium that will have different shear properties than heterogeneous tissue. One consequence of this difference may be increased attenuation of some waveguide modes, resulting from changes in the restoring force applied to the walls. However, this is not expected to significantly alter the behavior of the artery as a cylindrical waveguide; previous investigations into the use of water in arterial phantom tests have shown that, in order to do dispersion analysis in vivo, numerical corrections can be made during data processing to account for the differences in shear modulus between the artery wall and the surrounding tissue [12]. This suggests that the presence of tissue does not preclude mode control, but extra processing and measurement of the properties of the surrounding tissue will be needed to perform complete validation in future experiments.
Next, the mechanics of ultrasound will change our approach to in vivo tests. The theoretical model does not explicitly account for the propagation of ultrasound to produce the acoustic radiation force, and is purely concerned with the balance of forces between the arterial walls. One consequence of this is that it also neglects any discussion of ultrasound attenuation: whatever magnitude of force is applied by the beam once it impinges on the artery is used to compare the upper and lower walls, and the in-tissue depth of the artery is inconsequential. Practically speaking, problems can arise if the artery is deep enough, or the focal number is large enough, that transferring sufficient power to excite one or both artery walls is difficult. Additionally, variations in arterial depth and properties can can lead to differences in the quality of data acquired from the upper and lower arterial walls, with increased noise for the lower wall measurements. Our analysis of the phantom experiments suggest that these limitations can be overcome for arteries near the surface of the skin; additional tests are needed to study the impact of attenuation for deep-seated arteries. However, the experimental results also show that the relative position of the ultrasound focus and the lower arterial wall is crucial for achieving mode control; in clinical studies, this will likely make manual re-focusing of the ultrasound system necessary on a patient-to-patient basis.
The phantom study gives us confidence in pursuing mode control in vivo, but the information we can glean from our current data has several limitations. Our inability to accurately assess the material properties makes quantitative analysis of the accuracy of inversion for tests with and without mode control impossible, and the use of water as a medium and the above-mentioned additional numerical steps that will be needed for in vivo tests complicate such an assessment of accuracy before it even begins. Furthermore, while we know the urethane phantoms have similar elastic moduli to human arteries, their homogeneity and potential differences in viscoelasticity can produce differences in the response to acoustic radiation force. One possible consequence of these differences is a shift in the frequency ranges over which certain odd and even waveguide modes appear and become dominant, which will affect setup of inversion procedures. These ranges will also change with material properties over the course of the cardiac cycle in patients. Because our measurements are practically instantaneous with regard to the cardiac cycle we do not have to account for pulsation of the artery or its surroundings, but complete characterization should be done with multiple measurements throughout the cycle. Finally, the use of the correlation Ct gives us a qualitative sense of the degree to which even modes are suppressed in the arterial response. Its simplicity and insensitivity to signal amplitude can help mitigate some of the effects of noise, but may cause misassessment of wave characteristics in cases where many higher-order odd modes contribute to the signal. This is an unlikely problem for most in vivo studies given the rapid dissipation of higher order modes in tissue, but it still limits the amount precise information about the present modes that can be gained by computing Ct. Taking these factors into account and designing a study to evaluate the impact of mode control on the inversion process is a goal for our future work.
In light of these considerations, we believe that mode control can be achieved in vivo. However, the viability of our current, simple prescription (focusing the ultrasound beam at or below the lower wall of the artery) is in question for deeply embedded arteries; in these cases, sufficient excitation of both arterial walls may become difficult due to ultrasound attenuation. More systematic studies of the inverted modulus and relevant ultrasound beam parameters should be conducted in future by studying an artery near the surface of the skin, such as the carotid artery.
4. Conclusions
We have provided a theoretical foundation for a method of controlling the arterial response to acoustic radiation force by suppressing all even-numbered waveguide modes, relying on no prior knowledge of the elastic properties of the artery. Doing so requires focusing the ultrasound pushing beam at or below the lower wall of the artery, yielding balanced forces on the upper and lower walls. Finite element simulations verify that this approach can be implemented for a fluid-immersed, fluid-filled cylinder, and correlation between these simulations and a set of experimental results using urethane arterial phantoms suggest that mode control is viable for in vitro and in vivo experiments. The time correlation metric we have applied can be used an initial check to see whether or not experiments have been performed in accordance with our model. To ensure viability in vivo we can study arteries that are relatively close to the surface of the skin and conform well to idealized models of arterial geometry, like the carotid. This gives us a clear path forward for future experiments to determine the impact of other ultrasound beam parameters and quantify the effects of arterial depth and ultrasound attenuation on the efficacy of this approach. Upon in vivo validation, these methods can be used in shear wave elastography experiments to effect more accurate dispersion-based inversions for arterial material properties.
A. Acknowledgements
This research was supported in part by grant 5R01HL145268–03 from The National Heart, Lung, and Blood Institute (NHLBI). The content is solely the responsibility of the authors and does not necessarily represent the official views of the National Heart, Lung, and Blood Institute or the National Institutes of Health.
Appendix A. Derivation of Cross-Sectional Shape Factor Sm
We wish to derive an explicit expression for the shape factor Sm, one of three factors multiplied together to express the amplitude of the circumferential waveguide mode m.
| (A.1) |
This derivation relies on the definitions of the circumferential factor in the traction, τtheta, as well as the velocity mode shape ϕm, which are given as follows:
| (A.2a) |
| (A.2b) |
Here F is the force applied to the upper wall of the artery, f is the penetration coefficient scaling the force applied to the lower arterial wall, θc represents one-half of the circumferential extent of the applied forcing along the outer arterial surface, and b is the radius of the outer arterial wall. In order to begin our derivation of Sm, we consider the dot product of τθ and ϕm
| (A.3) |
By substituting Eqn. A.3 into Eqn. A.1 and suppressing the arbitrary factor b, we get a sum of two integrals defined over the circumferential regions where the ultrasound beam is applied
| (A.4) |
We solve and simplify this integral
| (A.5a) |
| (A.5b) |
| (A.5c) |
Resulting in Eqn. A.5c, which is the relation between the shape factor Sm and penetration coefficient f given in section 2 of this paper, as Eqn. 14. Critical in this simplification is the use of the sum and difference formulas for sine and cosine, which are needed to reach the form given in Eqn. A.5b. Finally, we note that this expression holds for the circumferential modes, but not necessarily all longitudinal modes. However, the only longitudinal mode present in the frequencies of interest to us is the lowest-order mode. This mode, referred to as the breathing mode, is a displacement that is directed radially at all angles [18, 39]. For mode control, we prescribe f = 1, yielding forces equal in magnitude and opposite in radial direction on opposing sides of the cylinder; this precludes the appearance of the breathing mode, and ensures that only odd circumferential modes will appear.
References
- [1].Cecelja Marina and Chowienczyk Phil. “Role of arterial stiffness in cardiovascular disease”. In: JRSM cardiovascular disease 1.4 (2012), pp. 1–10. [DOI] [PMC free article] [PubMed] [Google Scholar]
- [2].Van Popele Nicole M, Grobbee Diederick E, Bots Michiel L, Roland Asmar, Topouchian Jirar, Reneman Robert S, Hoeks Arnold PG, van der Kuip Deidre AM, Hofman Albert, and Witteman Jacqueline CM. “Association between arterial stiffness and atherosclerosis: the Rotterdam Study”. In: Stroke 32.2 (2001), pp. 454–460. [DOI] [PubMed] [Google Scholar]
- [3].Hirai Tadakazu, Sasayama Shigetake, Kawasaki Takeshi, and Yagi S. “Stiffness of systemic arteries in patients with myocardial infarction. A noninvasive method to predict severity of coronary atherosclerosis.” In: Circulation 80.1 (1989), pp. 78–86. [DOI] [PubMed] [Google Scholar]
- [4].Arcaro Guido, Laurent Stéphane, Jondeau Guillaume, Hoeks Arnold P, and Safar Michel E. “Stiffness of the common carotid artery in treated hypertensive patients”. In: Journal of hypertension 9.10 (1991), pp. 947–954. [PubMed] [Google Scholar]
- [5].O’Rourke Michael F and Nichols Wilmer W. “Aortic diameter, aortic stiffness, and wave reflection increase with age and isolated systolic hypertension”. In: Hypertension 45.4 (2005), pp. 652–658. [DOI] [PubMed] [Google Scholar]
- [6].Learoyd Brian M and Taylor Michael G. “Alterations with age in the viscoelastic properties of human arterial walls”. In: Circulation research 18.3 (1966), pp. 278–292. [DOI] [PubMed] [Google Scholar]
- [7].Urban Matthew W, Shigao Chen, and Fatemi Mostafa. “A review of shear-wave dispersion ultrasound vibrometry (SDUV) and its applications”. In: Current Medical Imaging 8.1 (2012), pp. 27–36. [DOI] [PMC free article] [PubMed] [Google Scholar]
- [8].Jang Jun-keun, Kondo Kengo, Namita Takeshi, Yamakawa Makoto, and Shiina Tsuyoshi. “Comparison of techniques for estimating shear-wave velocity in arterial wall using shear-wave elastography-FEM and phantom study”. In: 2015 IEEE International Ultrasonics Symposium (IUS). IEEE. 2015, pp. 1–4. [Google Scholar]
- [9].Widman Erik, Maksuti Elira, Amador Carolina, Urban Matthew W, Caidahl Kenneth, and Larsson Matilda. “Shear wave elastography quantifies stiffness in ex vivo porcine artery with stiffened arterial region”. In: Ultrasound in medicine & biology 42.10 (2016), pp. 2423–2435. [DOI] [PubMed] [Google Scholar]
- [10].Bernal Miguel, Urban Matthew W, Nenadic Ivan, and Greenleaf James F. “Modal analysis of ultrasound radiation force generated shear waves on arteries”. In: 2010 Annual International Conference of the IEEE Engineering in Medicine and Biology. IEEE. 2010, pp. 2585–2588. [DOI] [PubMed] [Google Scholar]
- [11].Banks HT and Luke N. “Modelling of propagating shear waves in biotissue employing an internal variable approach to dissipation”. In: Communication in Computational Physics 3 (2008), pp. 603–640. [Google Scholar]
- [12].Couade Mathieu, Pernot Mathieu, Prada Claire, Messas Emmanuel, Emmerich Joseph, Bruneval Patrick, Criton Aline, Fink Mathias, and Tanter Mickael. “Quantitative assessment of arterial wall biomechanical properties using shear wave imaging”. In: Ultrasound in medicine & biology 36.10 (2010), pp. 1662–1676. [DOI] [PubMed] [Google Scholar]
- [13].Jang Jun-Keung, Kondo Kengo, Yamakawa Makoto, and Shiina Tsuyoshi. “Directional Dependence of Shear Waves in a 3D Blood Vessel Model”. In: Proceedings of Symposium on Ultrasonic Electronics. Vol. 34. 2013. 2013, pp. 539–540. [Google Scholar]
- [14].Alhayani AA, Rodriguez J, and Merodio J. “Competition between radial expansion and axial propagation in bulging of inflated cylinders with application to aneurysms propagation in arterial wall tissue”. In: International Journal of Engineering Science 85 (2014), pp. 74–89. [Google Scholar]
- [15].Takashima Kazuto, Kitou Takayuki, Mori Koji, and Ikeuchi Ken. “Simulation and experimental observation of contact conditions between stents and artery models”. In: Medical engineering & physics 29.3 (2007), pp. 326–335. [DOI] [PubMed] [Google Scholar]
- [16].Muha Boris and Suncica Canić. “Existence of a weak solution to a nonlinear fluid–structure interaction problem modeling the flow of an incompressible, viscous fluid in a cylinder with deformable walls”. In: Archive for rational mechanics and analysis 207.3 (2013), pp. 919–968. [Google Scholar]
- [17].Fung Yuan-cheng. Biomechanics: circulation. Springer Science & Business Media, 2013. [Google Scholar]
- [18].Armenàkas Anthony E, George Herrmann, and Gaszis Denos C. “Free vibrations of circular cylindrical shells”. In: (1969).
- [19].Royer Daniel and Dieulesaint Eugene. Elastic waves in solids I: Free and guided propagation. Springer Science & Business Media, 1999. [Google Scholar]
- [20].Astaneh Ali Vaziri, Urban Matthew W, Wilkins Aquino, Greenleaf James F, and Guddati Murthy N. “Arterial waveguide model for shear wave elastography: implementation and in vitro validation”. In: Physics in Medicine & Biology 62.13 (2017), p. 5473. [DOI] [PubMed] [Google Scholar]
- [21].Roy Tuhin, Urban Matthew, Xu Yingzheng, Greenleaf James, and Guddati Murthy N. “Multimodal guided wave inversion for arterial stiffness: methodology and validation in phantoms”. In: Physics in Medicine & Biology 66.11 (2021), p. 115020. [DOI] [PMC free article] [PubMed] [Google Scholar]
- [22].Daniela Valdez-Jasso, Daniel Bia, Zócalo Yanina, Armentano Ricardo L, Haider Mansoor A, and Olufsen Mette S. “Linear and nonlinear viscoelastic modeling of aorta and carotid pressure–area dynamics under in vivo and ex vivo conditions”. In: Annals of biomedical engineering 39.5 (2011), pp. 1438–1456. [DOI] [PMC free article] [PubMed] [Google Scholar]
- [23].Ditri John J and Rose Joseph L. “Excitation of guided elastic wave modes in hollow cylinders by applied surface tractions”. In: Journal of applied physics 72.7 (1992), pp. 2589–2597. [Google Scholar]
- [24].Ditri John J, Rose Joseph L, and Aleksander Pilarski. “Generation of guided waves in hollow cylinders by wedge and comb type transducers”. In: Review of progress in quantitative nondestructive evaluation. Springer, 1993, pp. 211–218. [Google Scholar]
- [25].Ditri JJ and Rose Joseph Lawrence. “Excitation of guided waves in generally anisotropic layers using finite sources”. In: (1994).
- [26].Warner James E, Diaz Manuel I, Wilkins Aquino, and Bonnet Marc. “Inverse material identification in coupled acoustic-structure interaction using a modified error in constitutive equation functional”. In: Computational mechanics 54.3 (2014), pp. 645–659. [DOI] [PMC free article] [PubMed] [Google Scholar]
- [27].Achenbach Jan D. “Reciprocity and related topics in elastodynamics”. In: (2006).
- [28].Jensen Jørgen Arendtand Svendsen Niels Bruun. “Calculation of pressure fields from arbitrarily shaped, apodized, and excited ultrasound transducers”. In: IEEE transactions on ultrasonics, ferroelectrics, and frequency control 39.2 (1992), pp. 262–267. [DOI] [PubMed] [Google Scholar]
- [29].Walsh Timothy, Aquino Wilkins, and Ross Michael. “Source Identification in Acoustics and Structural Mechanics using SIERRA/SD”. In: Sandia National Laboratories SAND Report (2013). [Google Scholar]
- [30].Henni Anis Hadj, Cédric Schmitt, Tremblay Marie-Élise, Hamdine Mélina, Heuzey Marie-Claude, Carreau Pierre, and Cloutier Guy. “Hyper-frequency viscoelastic spectroscopy of biomaterials”. In: Journal of the mechanical behavior of biomedical materials 4.7 (2011), pp. 1115–1122. [DOI] [PubMed] [Google Scholar]
- [31].Shin Hyeon Jaeand Rose Joseph L. “Guided waves by axisymmetric and non-axisymmetric surface loading on hollow cylinders”. In: Ultrasonics 37.5 (1999), pp. 355–363. [DOI] [PubMed] [Google Scholar]
- [32].Bernal Miguel, Nenadic Ivan, Urban Matthew W, and Greenleaf James F. “Material property estimation for tubes and arteries using ultrasound radiation force and analysis of propagating modes”. In: The Journal of the Acoustical Society of America 129.3 (2011), pp. 1344–1354. [DOI] [PMC free article] [PubMed] [Google Scholar]
- [33].Widman Erik, Maksuti Elira, Larsson David, Urban MW, Anna Bjällmark, and Matilda Larsson. “Shear wave elastography plaque characterization with mechanical testing validation: a phantom study”. In: Physics in Medicine & Biology 60.8 (2015), p. 3151. [DOI] [PubMed] [Google Scholar]
- [34].Marais Louise, Pernot Mathieu, Khettab Hakim, Tanter Michael, Messas Emmanuel, Zidi Mustapha, Laurent Stéphane, and Boutouyrie Pierre. “Changes of Intrinsic Stiffness of the Carotid Arterial Wall During the Cardiac Cycle Measured by Shear Wave Elastography in Hypertensives Compared to Normotensives”. In: Artery Research 20.C (2017), pp. 55–55. [Google Scholar]
- [35].Marais Louise, Pernot Mathieu, Khettab Hakim, Tanter Mickael, Messas Emmanuel, Zidi Mustapha, Laurent Stéphane, and Boutouyrie Pierre. “Arterial stiffness assessment by shear wave elastography and ultrafast pulse wave imaging: comparison with reference techniques in normotensives and hypertensives”. In: Ultrasound in medicine & biology 45.3 (2019), pp. 758–772. [DOI] [PubMed] [Google Scholar]
- [36].Montaldo Gabriel, Tanter Mickaël, Bercoff Jérémy, Benech Nicolas, and Fink Mathias. “Coherent plane-wave compounding for very high frame rate ultrasonography and transient elastography”. In: IEEE transactions on ultrasonics, ferroelectrics, and frequency control 56.3 (2009), pp. 489–506. [DOI] [PubMed] [Google Scholar]
- [37].Capriotti Margherita, Greenleaf James, and Urban Matthew W. “A time-aligned plane wave compounding method for high frame rate shear wave elastography”. In: The Journal of the Acoustical Society of America 148.4 (2020), pp. 2447–2447. [Google Scholar]
- [38].Thanasis Loupas, Peterson RB, and Gill Robert W. “Experimental evaluation of velocity and power estimation for ultrasound blood flow imaging, by means of a two-dimensional autocorrelation approach”. In: IEEE transactions on ultrasonics, ferroelectrics, and frequency control 42.4 (1995), pp. 689–699. [Google Scholar]
- [39].Gazis Denos C. “Three-dimensional investigation of the propagation of waves in hollow circular cylinders. I. Analytical foundation”. In: The journal of the Acoustical Society of America 31.5 (1959), pp. 568–573. [Google Scholar]


