

Abstract
Chemical indicators are used to study calcium signaling events in the context of live cell imaging. Fluo-3 AM, Fluo-4 AM, and Cal-520 AM, are three commonly used fluorescent indicators derived from the calcium chelator BAPTA. Here we describe sample protocols that detail how these indicators are used in in vitro and ex vivo studies to analyze the role of calcium mobilizations in cell-cell communication and coordinated cellular motility in the context of wound healing.
Keywords: ex vivo in situ analysis, confocal imaging, calcium mobilization, cell-cell communication, live-cell imaging, image analysis
Introduction:
What do neurotransmitter release, skeletal muscle contraction, and signal transduction of Gq-type G protein coupled receptors (GPCRs) have in common? These processes all take advantage of changes in the intracellular concentration of calcium ions to cause changes in the cell. In the cytosol the concentration of calcium ions is tightly maintained at 100nM, roughly 20,000–100,000 fold lower than the concentration in the extracellular space [1]. Due to the role of calcium ions in regulating enzyme and protein activity, small alterations in this concentration can cause large changes in gene transcription, protein activity, and cellular function. In muscles, calcium released from the sarcoplasmic reticulum binds to troponin [1,2,3]. This causes a change in its 3D configuration that allows binding sites on actin proteins to become exposed [1,2,3]. Myosin is now able to bind to this site and hydrolyze ATP to cause the sarcomere to contract [1,2,3]. In neurons, activation of voltage-gated Ca channels causes a sudden increase in the calcium concentration at the axon terminal [4]. This change prompts the release of neurotransmitter-filled vesicles into the synaptic cleft, propagating the action potential to an adjacent cell [4]. Signaling through Gq type GPCR’s occurs by cleaving the membrane lipid phosphatidylinositol biphosphate (PIP2) to inositol triphosphate (IP3) and diacylglycerol (DAG) upon ligand binding [1]. IP3 binds to a receptor on the endoplasmic reticulum, causing the release of stored calcium into the cytosol [1]. This calcium binds to and activates many different proteins resulting in changes in transcription and translation. These are just three examples, but there are countless other instances where calcium signaling affects cellular function and cell-cell communication. Given the involvement of calcium signaling in such a diverse range of processes, having a reliable way to monitor and analyze calcium mobilization events is of great interest to researchers in many different fields.
Calcium indicators respond to changes in cytosolic calcium concentration with changes in their fluorescent properties [5]. They can be grouped into two main classes: genetically encoded and chemical [5]. Genetically encoded indicators are often derived from GFP or its variants fused with calmodulin and the M13 domain of myosin light chain kinase [5]. These indicators have the advantage of localization to particular cellular subpopulations and can yield data from in vivo systems such as that following calcium mobilizations in neurons [5]. These indicators have been used to map the role of anesthetics on the response of specific motor neurons in C. elegans [6]. Although useful in many contexts, we do not use genetically encoded calcium indicators in our current work and will not be discussing them further in this chapter.
Like genetically encoded calcium indicators, chemical indicators exhibit substantial changes in fluorescence with increases in cytosolic calcium concentration [5]. However, there are several key differences between the two. Whereas genetically encoded indicators are incorporated into an organism’s genome and allow the organism to produce the fluorescent protein itself, chemical indicators are exogenous substances that are pre-incubated with ex vivo or in vitro samples [5].
The Fura and Indo dyes require UV lasers for excitation and are ratiometric dyes that demonstrate specific changes in maximum excitation or emission wavelengths, respectively, upon changes in intracellular calcium concentration [5,7]. The Fluo series do not require UV lasers and exhibit greater fluorescence between bound and unbound forms but they do lack the shift in emission spectra observed in the other probes so that one must carefully decide which probe to use [7]. The Fluo chemical indicators are based on the non-fluorescent calcium chelator 1,2-bis(o-aminophenoxy)ethane-N,N,N’,N”-tetraacetic acid (BAPTA) [7]. BAPTA itself is structurally similar to the metal ion chelator Ethylenediaminetetraacetic acid (EDTA) [7]. BAPTA itself is structurally similar to the metal ion chelator EDTA but has been modified to yield a higher affinity for Ca2+ ions and a lower affinity for other metal ions such as Fe3+ and Mg2+ [7]. The indicators have been modified to optimize affinity for calcium and yield maximum fluorescence at desired wavelengths [8]. When calcium binds to an indicator it undergoes changes in its 3D structure that greatly enhance its fluorescence, up to 100-fold in the case of Fluo-3 [7]. In this methods discussion we are focusing on three of these chemical indicators: Fluo-3AM, Fluo-4AM, and Cal-520 AM.
Fluo-3 AM and Fluo-4 AM are engineered to fluoresce upon the structural changes induced upon Ca ion binding [5,7,8]. Fluo-4 is a variant of Fluo-3 that has replaced two chlorine atoms with Fluorine [5,7,8]. This results in a higher fluorescent excitation at a wavelength of 488 nm and a higher overall signal [8]. Their maximum excitation/emission spectra are 506/526 and 494/516 respectively [8]. Advantages of Fluo-4 include faster loading and a higher signal at the same concentration [8]. Both Fluo-3 and Fluo-4 are attached to an acetoxymethyl ester group that blocks the carboxy groups on these molecules and facilitates crossing the plasma membrane [5,7,8]. This moiety is cleaved by esterases in the cell, exposing the carboxy groups and preventing diffusion out of the cell [5,7,8]. The indicators are denoted as Fluo-3 AM or Fluo-4 AM if they have this moiety. In addition to Fluo-3 AM and Fluo-4 AM, there are two additional indicators in the Fluo series: Fluo-5 AM and Fluo-8 AM [8]. Fluo-5 AM is structurally similar to Fluo-4 AM but exhibits lesser affinity for calcium ions [7]. This makes Fluo-5 AM suitable for detecting calcium concentrations between 1uM to 1mM, concentrations that would saturate the response of Fluo-3 AM or Fluo-4 AM [7]. Fluo-8 AM was engineered to facilitate loading while maintaining the same useful excitation and emission spectra [9]. Whereas Fluo-3 AM and Fluo-4 AM must be loaded at 37°C, Fluo-8 AM can be loaded at room temperature [9]. Fluo-8 AM is also twice as bright as Fluo-4 AM and four times as bright as Fluo-3 AM [9]. The fluo series are useful for short-term calcium imaging (<1 hour) using a 488nm laser. One drawback is that they can have high noise (background fluorescence that can hide true positive results and generate false signals) [11]. There are two main causes for this. The first is that the bond linking the AM ester to the rest of the molecule can be easily hydrolyzed in the extracellular space [11]. Therefore, significant quantities of the dye cannot enter the cells and remains in the extracellular space where it can still fluoresce [11]. The second cause is poor localization of the dye to the cytosol due to the activity of organic anion transporters [11]. These transporters export the dye into the extracellular space [11]. Initial solutions to this issue involve co-administering the organic anion transporter inhibitor probenecid along with the dye [11]. A disadvantage is that probenecid may have effects on the cell that can alter the results and may cause cytotoxicity [10]. Note that probenocid may also inhibit channel proteins such as pannexin1 [12].
Cal-520 AM is a newer fluorogenic calcium sensitive dye with improved signal and reduced noise relative to the Fluo series of indicators [10,11]. In addition there is increased stability of the AM ester bond that avoids spontaneous hydrolysis in solution, and improves localization and retention in the cytosol [11]. It is relatively unaffected by organic anion transporters, rendering the co-administration of probenecid unnecessary [10,11]. It has a significantly better signal-to-noise ratio compared to Fluo-3 or Fluo-4 [10,11]. The increased retention in the cytosol allows for longer imaging times, of up to 8 hours.
Fluo-3 AM, Fluo-4 AM, and Cal-520 AM are all essential tools for studying the signaling events. In our studies we have examined the calcium mobilizations in conjunction with underlying coordinated cell migration in the context of corneal wound healing. When a cornea is scratched, ATP released from wounded cells causes an initial burst of calcium mobilization that begins at the wound edge and is propagated towards the unwounded epithelia [15]. The release of ATP activates members of the purinergic receptor family [14,15]. The initial mobilization is followed by smaller calcium mobilizations between neighboring cells, which are hypothesized to be important for coordinating migration and motility [16]. Use of these tools are critical components of our experimental design.
In addition to calcium indicators, we use SiR-Actin and CellMask Far Red dyes to monitor changes in cytoarchitecture. SiR-Actin was developed from the actin-binding agent jasplakinolide. It is fluorogenic, cell permeable, and stains endogenous F-actin without necessitating overexpression in cells. SiR-Actin can be used for live cell imaging in both tissue and cell cultures. It is stable for over 18 hours when imaging with confocal microscopy or AIRYScan using a low laser light setting. It has maximum excitation and emission spectra at 652nm and 674 nm respectively, comparable to the spectrum of the far-red fluorescent dye CY5. The CellMask family (Orange, Deep Red and Green) are live stains for the plasma membrane that internalize slowly compared to other plasma membrane stains such as Dil and labelled wheat germ agglutinin. CellMask dyes are amphipathic molecules, containing both a lipophilic moiety that provides excellent membrane loading and a negatively charged hydrophilic dye for “anchoring” of the probe in the plasma membrane. They are stable for up to 4 hours in live cell imaging of corneal tissue and cultured cells. This stain generated from CellMask dyes is maintained after fixation with formaldehyde, but does not remain when a detergent extraction is used. Excitation and emission spectra vary depending on the specific dye used. Options include Green (522nm/535nm), Orange (554nm/567nm), and Deep Red (649nm/666nm).
These amphipathic molecules have a lipophilic moiety that provides excellent membrane loading and a negatively charged hydrophilic dye for “anchoring” of the probe in the plasma membrane. It is stable for up to 4 hours in live cell imaging of corneal tissue and cultured cells. This stain is maintained after fixation with formaldehyde, but it does not remain when a detergent extraction is used.
To understand the distinct roles played by different purinergic receptors in the initial and later bursts of calcium mobilization, and the cell signaling events responsible for propagating these mobilizations between clusters of cells, higher resolution imaging is required. The imaging protocols are described below.
Materials
Prepare all solutions using millique water or phosphate buffered saline (PBS) pH7.2 as appropriate. Prepare all reagents the day of and keep on ice. Reagents such as ATP and UTP are available from Sigma-Aldrich (St. Louis, MO). Fluo-3 or 4AM fluorescent dye, were purchased from Invitrogen (Carlsbad, CA). CellMask™ Deep Red Plasma membrane stain was purchased from ThermoFisher (Waltham, MA) and SiR-Actin Spirochrome probe was purchased from Cytoskeleton Inc. (Denver, CO). Cal-520AM was purchased from ABCAM (USA). Poly(ethylene glycol) diacrylate (PEG-DA), Irgacure 2959 photoinitiator (2-hydroxy-4′-(2-hydroxyethoxy)-2-methylpropiophenone), and 3-(trimethoxysilyl)propyl methacrylate were purchased from Sigma-Aldrich (St. Louis, MO).
Methods:
Preparation of cells for Ca2+ mobilization studies
Culture cells to desired density for experiment on MAT-TEK glass bottom dishes or on tissue culture dishes of different stiffnesses. For flow-through experiments use a Harvard Apparatus to perfuse fluids.
Pre-load cells with 5 μM Fluo-3, 4 AM or 5 μM Cal-520 AM (Invitrogen, Carlsbad, CA), at a final concentration of 1% (v/v) DMSO and 0.02% (w/v) pluronic acid for 30 minutes at 37°C and 5% CO2 -
Wash excess dye and place on stage of microscope in environmental chamber at 35°C and 5% CO2.
Ex vivo in situ preparation of tissue for study of calcium mobilizations
Euthanize rodents according to your institutional IACUC protocol. Remove the eyes by proptosing them and cutting the optic nerve. Pre-incubate the eyes/corneas in Fluo-3 AM, Fluo-4 AM or Cal-520 AM to visualize calcium mobilization for 2 hours at 37°C and 5% CO2. Use the concentrations described in an in vitro set up. Due to the mouse cornea being a multi-cell layered tissue, preincubate with either CellMask™ Deep Red Plasma membrane stain to visualize cell membranes for 1 hour at 37°C and 5% CO2 or SiR-Actin Spirochrome probe (Cytoskeleton Inc., Denver, CO) to visualize F-actin for 2 hours at 37°C and 5% CO2.
Wash the eyes and induce a corneal injury by causing a scratch injury on the epithelium, being careful not to injure the basement membrane of the cornea.
During the preincubation prepare MAT-TEK cover glass bottom wells by cleaning with 70% ethanol and allowing them to air dry. Treat the glass with a solution of 21mM silane (dilute 3-(trimethoxysilyl)propy methacrylate into 100% Ethanol) by pipetting an excess on and leaving it for 3 minutes at room temperature. Rinse the cover glass twice, once with 70% ethanol and once with water, and allow cover slips to air dry at room temperature.
Prepare the polyethylene glycol solution (dilute 15% polyethylene glycol with 0.10% Igracure 2959 photoinitiator (2-hydroxy-4’-(2-hydroxyethoxy)-2-methylpropipheone in water).
Mount corneas on a silanized glass bottom well. Place the cornea epithelial side down and add a drop of polyethylene glycol gel (PEG).
Crosslink the PEG solution in the Strata Crosslinker at 120 mJ for 1 minute. Make small slits in the agar for penetration of media using a fire pulled pipette. Place a cover slip on top of the gel and add 1 ml media to the well to prevent sample desiccation. Place on microscope stage and image in an environmental chamber at 35°C that is humidified.
Imaging
Set filters for imaging on instrument of choice. All of these dyes will work on confocals, SIM, or spinning disks. Fluo-3 AM and Fluo-4 AM have a maximal excitation of 506 and a maximal emission of 526. Cal-520 AM has a maximal excitation of 492 nm and a maximal excitation of 514 nm, SiR-Actin has a maximal excitation of 652 nm and an emission of 674 nm. FarRed CellMask has a maximal excitation of 650 nm and an emission of 670 nm. Examples of the use of these indicators can be seen in Movies 1 and 2.
Collect images at the speed required for your experiment. Users will need to consider the scan speed, the length of time of imaging and the memory of the computer. We use a Zeiss Axiovert LSM 880 confocal microscope and often collect at 3fps for a period of time of up to 4 hours. Faster scan times on this instrument are easily achieved with the FAST module. Higher resolution is achieved with AIRYScan. An example of imaging tissue with Cal-520 AM and CellMask using the FAST module is shown in Movie 2.
Establish baseline values in either control tissue or in cells before stimulation. We suggest 100–200 frames of baseline activity so that they represent the population and can be averaged during analysis. Image continually after establishing baseline values. The AIRYScan increases the resolution and overall image quality compared to traditional confocal microscopy.
Save files as LSM, and export as AVI for analysis. Movies are present for viewing on GitHub.
Movie 1.
Representative videos of corneal epithelial cell calcium mobilizations after scratch wounding. Cells were pre-incubated with SiR-Actin (red) and either a) Fluo-3 AM or b) Cal-520 AM (green) and were imaged as described above. Videos are played at a speed of 30 fps.
Movie 2.
Representative video of live cell imaging of a wounded corneal epithelium. Sample was imaged in situ in the cornea. Tissue was loaded with a Cal-520 AM (green) and CellMask (red) and imaged as described. Video is played at a speed of 30 fps.
Analysis
Grid-based Modeling of Ca2+ mobilizations
Use a customized video processing technique developed to analyze spatiotemporal communication between groups of cells (Matlab, MathWorks, Inc.). Export videos in TIF or AVI format. Divide the image frame within the video into a grid of smaller blocks of equal size with each grid area being approximately equal to 1–2 cells. Assign a number for each block for identification.
Average baseline values and subtract from experimental values.
Minimize background noise, and compute average intensity. The grid defining the block-level division will remain fixed over the entire set of frames within the video, allowing for quantifying inter-block communication and for tracking synchronicity and behavior of a group of adjacent cells over time.
To examine block-level communication over time under different experimental scenarios, examine relationships between different blocks to determine if signaling remains in phase. Compared intensity changes between grid regions and generated a comprehensive heat map to display the relationships between each of the blocks. Determine the average correlation values of the image studies based on the inter-block correlations values for each treatment condition. An example of analysis is found in Figure 1.
Figure 1.
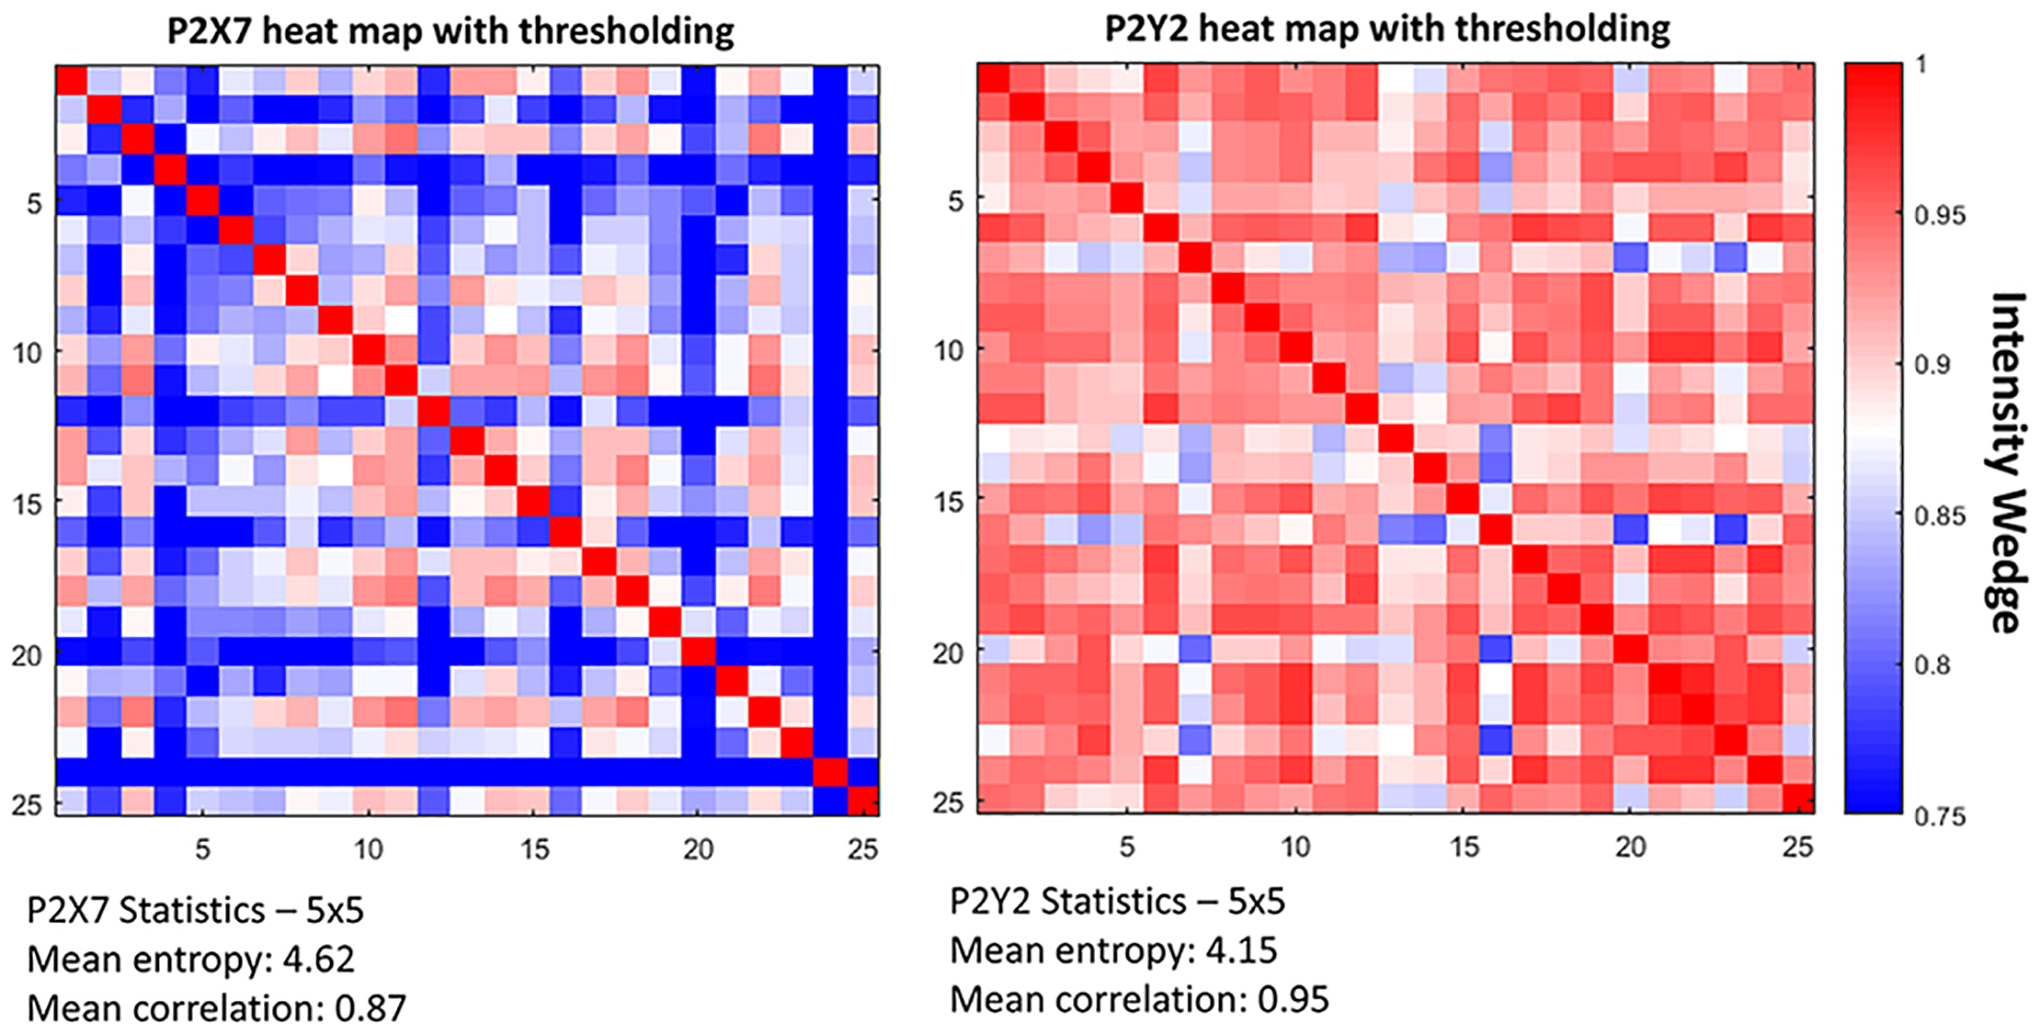
A method of analyzing cell-cell communication is to threshold and generate a heat map to examine events of communication by determining correlation. The average entropy of the cells is also calculated. Cells were loaded with a fluor, stimulated with agonists and exported into MATLAB. The intensity wedge shows red with a higher correlation, blue as lower correlation.
Cell-based Modeling of Ca2+ mobilizations
Perform cell-based method analysis to determine the spatiotemporal communication between groups of cells. Export videos in TIF or AVI format. Use custom MATLAB scripts (MATLAB, MathWorks, Inc.) to analyze Ca2+ responses based on a population of cells.[17]. Mark cell positions automatically using a computer program that calculates the X and Y centroid coordinates of each cell and record them for every registered fluorescent area from the reference frame.
Choose the starting frame. A cell is considered activated when it exhibits a rapid change in intensity due to the influx of Ca2+ into the cell. Threshold signaling events for each trace so that they are greater than a threshold of 50% of the average normalized fluorescent signal. Define a cluster as a group of 2–3 adjacent cells where Ca2+ mobilizations occurred. Using these criteria, determine the percent of activated cells and the number of clusters over time.
Event probability calculation for Ca2+ mobilizations
To examine cell-cell communication we developed a script to identify Ca2+ events and generate an event kymograph. Figure 2 demonstrates event recognition through a representative kymograph and MATLAB detected events. We then calculate the probability of neighboring cells having a correlated Ca2+ event [16]. We defined “event probability” as the probability that a Ca2+ event in any particular cell would trigger a correlated event in any of its neighboring cells.
Figure 2.

Representative figures for a method of analyzing Ca2+events via thresholding of an event kymograph (raw data) to generate MATLAB detected events necessary to calculate event probability.
Perform stabilization script if needed.
Define neighboring cells as cells within < 35 μm of each other.
Define neighboring cells that displayed events within 10 frames (approximately 30 sec) of each other as correlated events. Cell positions were marked as described above. Threshold of detected Ca2+ events is described above.
Analysis of cytoskeletal changes with calcium mobilizations
Analyze calcium mobilizations as described above.
Perform track tracing of cells over time to determine relationship between calcium mobilization and change in cell shape or actin.
Movies 1(a and b) show cellular organization and calcium mobilization using 2 different calcium probes.
Notes
Calcium indicators are light sensitive and should be stored in the dark at −20°C. Excessive exposure to light can result in diminished or no signal. Calcium indicators should not be left on a live sample for longer than denoted in the protocol. In this situation the indicators can be cytotoxic and affect results. Indicators may also give faint readouts, especially during live cell imaging of wounded ex vivo corneas.
The Airy Scan on the Zeiss LSM 880 Confocal Microscope (Carl Zeiss) is used to give a stronger signal when performing imaging experiments on these samples.
For corneal epithelial cells, the lower temperature of 35°C is optimum compared to the typical 37°C.
Acknowledgements
This work was supported by NIH grant RO1 EY06000 (VT-R) and R21 EY029097 (VT-R), NIH EY028001 (YJK Lee), and Massachusetts Lions Eye Research Foundation and New England Corneal Transplant Fund. We acknowledge the extensive support of Celeste Rich and Kyubi Yang for her computer expertise.
Footnotes
Electronic Supplementary Materials
https://github.com/ksegars0417/Calcium-Imaging-Paper-Figures
References
- 1.Clapham D, (2007) Calcium Signaling. Cell 13: 1047–1058 [DOI] [PubMed] [Google Scholar]
- 2.Szent-Györgyi AG, (1975) Calcium regulation of muscle contraction. Biophys J. 15:707–723 [DOI] [PMC free article] [PubMed] [Google Scholar]
- 3.Wakabayashi T, (2015) Mechanism of the calcium-regulation of muscle contraction-In pursuit of its structural basis-. Proc Jpn Acad Ser B Phys Biol Sci. 91:321–350 [DOI] [PMC free article] [PubMed] [Google Scholar]
- 4.Südhof T, (2012) Calcium Control of Neurotransmitter Release. Cold Spring Harb Perspect Biol 4:a011354. [DOI] [PMC free article] [PubMed] [Google Scholar]
- 5.Lock J, Parker I, Smith I, (2015) A comparison of fluorescent Ca2+ indicators for imaging local Ca2+ signals in cultured cells. Cell Calcium 58: 638–648 [DOI] [PMC free article] [PubMed] [Google Scholar]
- 6.Awal MR, Wirak GS, Gabel CV, Connor CW, (2020) Collapse of Global Neuronal States in Caenorhabditis elegans under Isoflurane Anesthesia. Anesthesiology 133:133–144 [DOI] [PMC free article] [PubMed] [Google Scholar]
- 7.Haugland RP, (2010) Handbook of Fluorescent Probes and Research Products. Molecular Probes [Google Scholar]
- 8.Paredes RM, Etzler JC, Watts LT, Zheng W, Lechleiter JD, (2008) Chemical calcium indicators. Methods 46:143–151 [DOI] [PMC free article] [PubMed] [Google Scholar]
- 9.Calcium Indicators. In: AAT Bioquest. AAT Bioquest, INC. https://www.aatbio.com/catalog/calcium-indicators-probes-quantification-kits#toc_6 Accessed 29 July 2020. [Google Scholar]
- 10.Liu M, Liu J, Diwu Z, (2012) A Functional Analysis of GPCR and Calcium Channel Targets using Cal 520 AM Ester. Biophysical Journal 102;309A–310A [Google Scholar]
- 11.A History of Calcium Indicators in Life Sciences. In: Calcium Dyes Past, Present Future. Stratech. https://www.stratech.co.uk/aat-bioquest/a-history-of-calcium-indicators-in-life-science/Accessed 29 July 2020. [Google Scholar]
- 12.Silverman W, Locovei S, Dahl G, (2008) Probenecid, a gout remedy, inhibits pannexin 1 channels. American Journal of Physiology-Cell Physiology 295: C761–C767 [DOI] [PMC free article] [PubMed] [Google Scholar]
- 13.Klepeis V, Cornell-Bell A, Trinkaus-Randall V, (2001) Growth factors but not gap junctions play a role in injury-induced Ca2+ waves in epithelial cells. Journal of Cell Science 114: 4185–4195 [DOI] [PubMed] [Google Scholar]
- 14.Klepeis V, Weinger I, Kaczmarek E, Trinkaus-Randall V, (2004) P2Y receptors play a critical role in epithelial cell communication and migration. J Cell Biochem. 93:1115–1133 [DOI] [PubMed] [Google Scholar]
- 15.Mankus C, Rich C, Minns M, Trinkaus-Randall V, (2011) Corneal Epithelium Expresses a Variant of P2X7 Receptorin Health and Disease. PLoS One 6:e28541. [DOI] [PMC free article] [PubMed] [Google Scholar]
- 16.Lee Y, Kim MT, Rhodes G, Sack K, Son SJ, Rich C, Kolachalama V, Gabel C, Trinkaus-Randall V, (2019) Sustained Ca2_ mobilizations: A quantitative approach to predict their importance in cell-cell communication and wound healing. PLoS One 14: e0213422. [DOI] [PMC free article] [PubMed] [Google Scholar]
- 17.Derricks KE, Trinkaus-Randall V, Nugent MA. (2015) Extracellular matrix stiffness modulates VEGF calcium signaling in endothelial cells: individual cell and population analysis. Integr Biol. 7:1011–25. [DOI] [PMC free article] [PubMed] [Google Scholar]