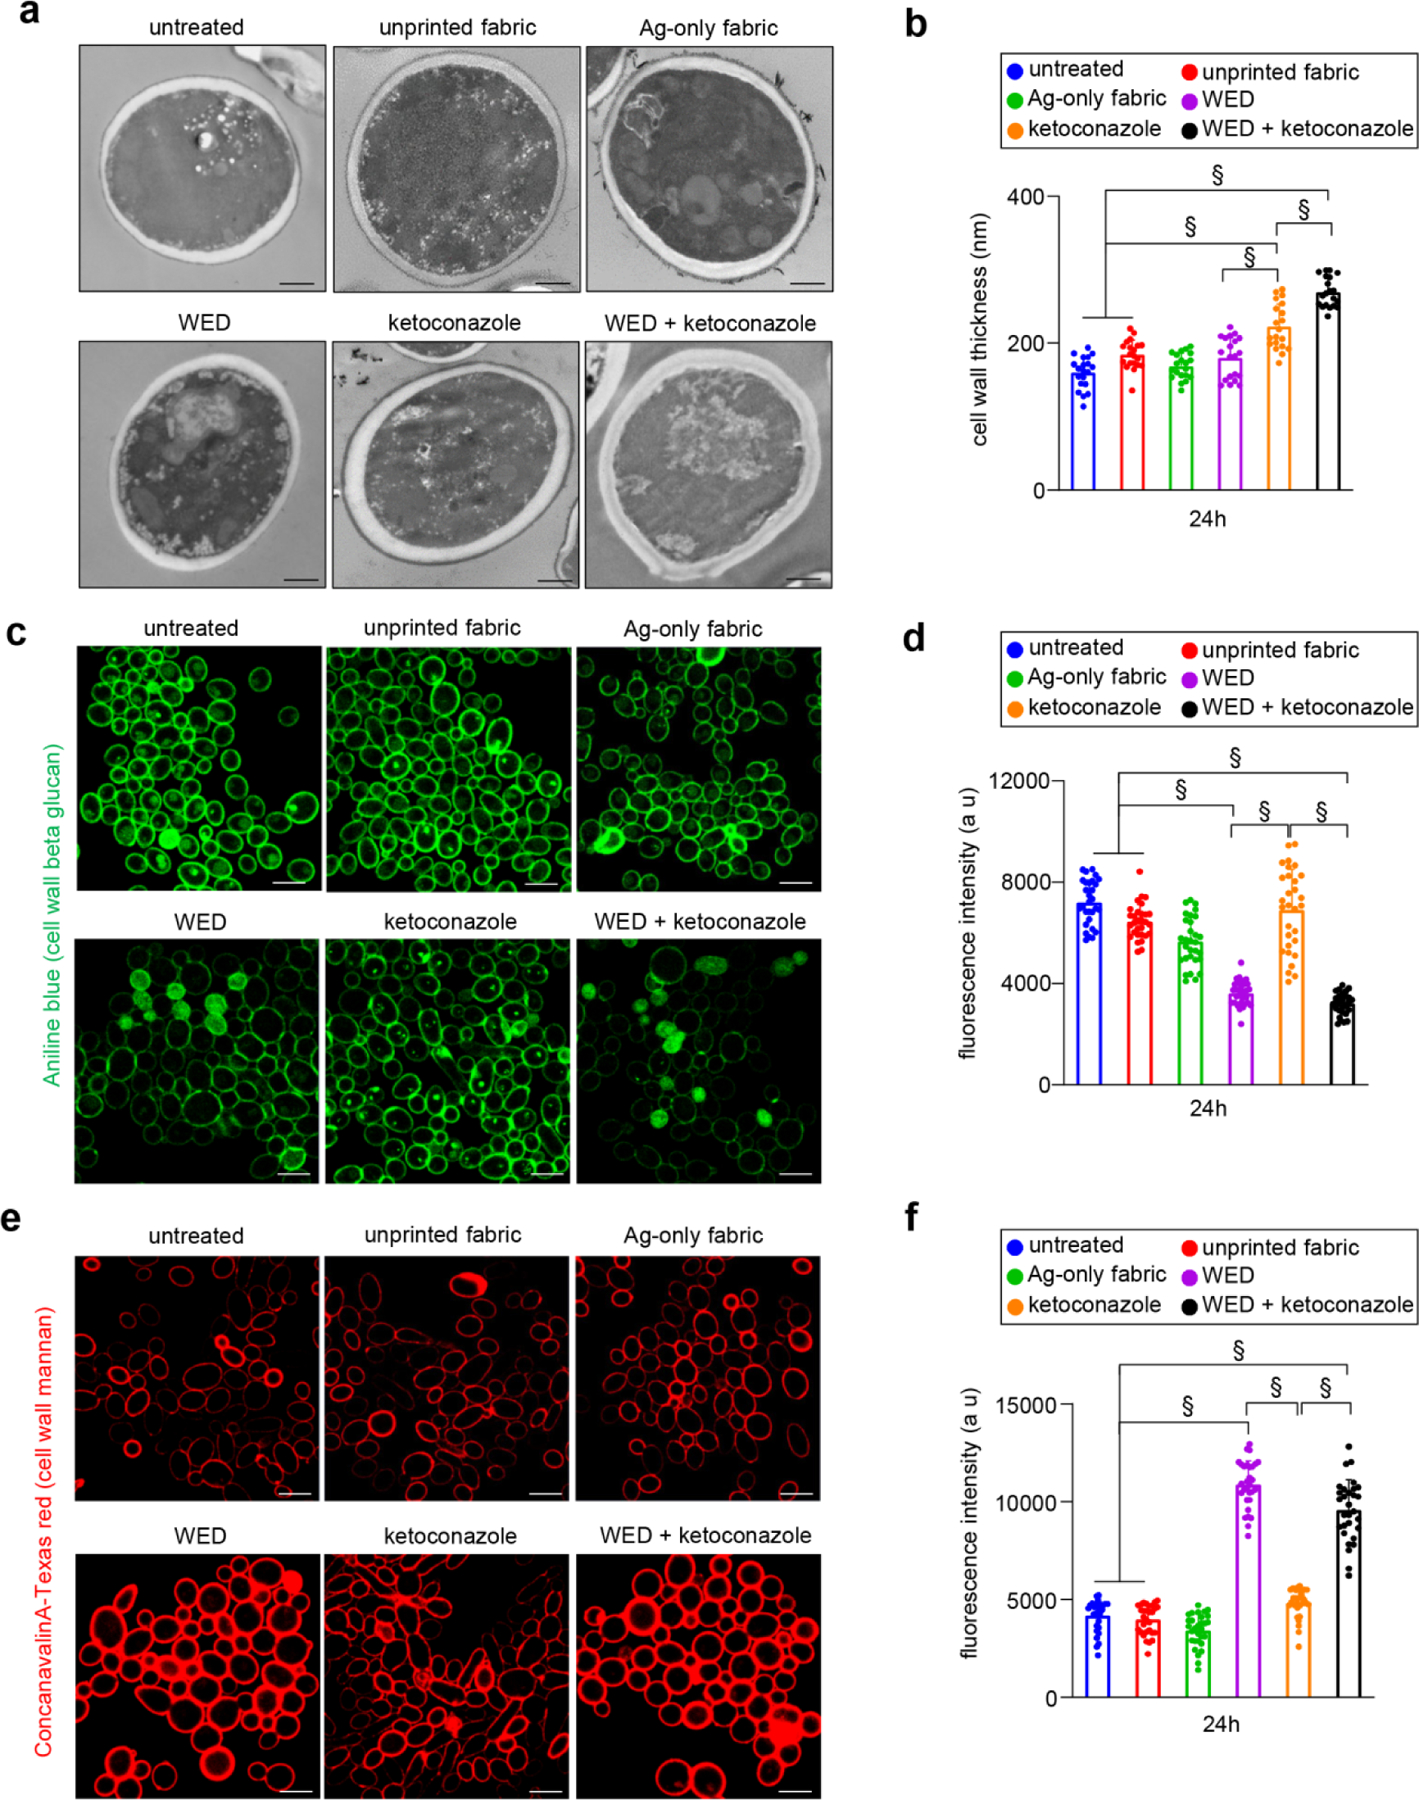
Figure 7: Candida albicans cell wall thickening as observed in response to WED.

(a) Representative images for ultrastructure analysis to assess C albicans cell wall thickness. C albicans cells (untreated or with respective treatments) were cultured in YPD broth. After 24h, cells were pelleted and processed for TEM. Scale bar represents 600 nm. (b) Graphical representation of C albicans cell wall thickness. Cell wall thickness was measured using ImageJ software. n = 20 cells. §P ≤ 0.0001 (One-way ANOVA followed by post-hoc Sidak multiple comparison test). (c) and (e) Representative images for qualitative assessment of cell wall β-glucan and mannan content, respectively. C albicans cells, after 24h of planktonic growth (untreated or with respective treatments) were stained with Aniline blue (for β-glucan) or Conacavalin A conjugated with Texas red (for mannan) and observed at 63X magnification. Scale bar represents 10 µm. Display settings for all images were kept same. (d) and (f) Semi-quantitative assessment of cell wall β-glucan and mannan content, respectively. Microscopic images captured for aforementioned samples were analyzed for fluorescence intensities using Zen Blue software. These values are graphically represented in terms of arbitrary units (a u). n = 31 images. §P ≤ 0.0001 (One-way ANOVA followed by post-hoc Sidak multiple comparison test). Data are represented as the mean ± SD.
