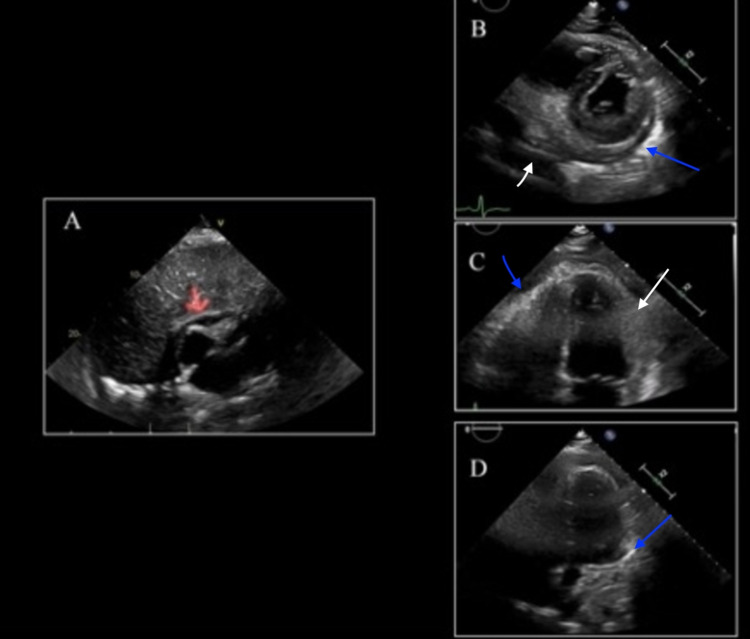
Figure 4. Transthoracic Echocardiogram demonstrating signs of pericarditis.
(A) Subcostal view of prior TTE one month ago demonstrating small pericardial effusion with mild echogenicity of the visceral pericardium (demonstrated by red arrow). (B) Short axis view of current TTE demonstrating persistent pericardial effusion (demonstrated by white arrow) with enhanced echogenicity of the visceral pericardium (demonstrated by the blue arrow). (C, D) Four-chamber view of current TTE further demonstrating circumferential thickening (demonstrated by white arrow) and echogenicity of the visceral pericardium (demonstrated by the blue arrow).

