

Abstract
Viral pathogens are an ongoing threat to public health worldwide. Dissecting their dependence on host biosynthetic pathways could lead to effective antiviral therapies1. Here we integrate proteomic analyses of polysomes with functional genomics and pharmacologic interventions to define how entero- and flaviviruses remodel host polysomes to synthesize viral proteins and disable host protein production. We find that infection with either Polio, Dengue or Zika virus drastically modifies polysome composition, without major changes to core ribosome stoichiometry. These viruses use different strategies to evict a common set of translation initiation and RNA surveillance factors from polysomes while recruiting host machineries specifically required for viral biogenesis. Targeting these specialized viral polysomes may provide a new approach for antiviral interventions. For example, we find that both Zika and Dengue utilize the collagen proline hydroxylation machinery to mediate cotranslational modification of conserved prolines in the viral polyprotein. Genetic or pharmacologic inhibition of proline hydroxylation impairs nascent viral polyprotein folding and induces its aggregation and degradation. Strikingly, such interventions prevent viral polysome remodeling and lower virus production. Our findings delineate the modular nature of polysome specialization at the virus-host interface and establish a powerful strategy to identify targets for selective antiviral interventions.
Keywords: Ribosomes, translation, proteomics, viral infection, Poliovirus, Zika, Dengue, proteostasis, chaperones, protein folding, aggregation
RNA viruses must seize control of host ribosomes to promote viral protein production2. Their genomes alternate between mutually exclusive states that promote translation or replication while evading host RNA surveillance3. Their long open reading frames (ORFs) are translated into multifunctional, multidomain polyproteins that require proteolytic processing and assembly, increasing the risk of misfolding and aggregation4. Furthermore, viral RNA (vRNA) translation must persist while host mRNA translation is suppressed to curtail antiviral responses2. This led to the evolution of non-canonical translation strategies e.g. initiation from internal ribosome entry sites (IRES)5.
To understand how RNA viruses remodel the host translation machinery, we generated a high-resolution atlas of changes in polysome composition during infection with three RNA viruses. Polio, (PV) Zika (ZIKV) and Dengue (DENV) differ in genome features, replication strategies and polyprotein architecture, and use distinct strategies to translate their single-ORF (+)RNA genome. PV, an enterovirus, uses a 5’ IRES and 3’ polyadenylate (poly-A) tail; ZIKV and DENV, both flaviviruses, have short capped 5’ untranslated regions (UTR) and highly structured 3’ UTRs with no poly-A tails (Extended Data Fig. 1a–b). ZIKV and DENV, with ~70% amino-acid homology, have 20 transmembrane domains that are cotranslationally inserted into the ER; PV is exclusively cytoplasmic. Despite these differences, we find all three remodel polysomes along the same principles to modulate similar pathways. The core ribosome composition remains unchanged but many host proteins belonging to defined functional modules are either recruited to or evicted from polysomes upon infection. We observe pan-viral disruption of translation initiation and RNA surveillance, and virus-specific recruitment of non-canonical translation factors, chaperones and modifying enzymes, including collagen prolyl hydroxylases.
Viral infection remodels polysomes
We examined translation in Huh7 cells infected with PV, DENV or ZIKV (Fig. 1a). Global translation was suppressed by these viruses as production of viral proteins increased (Extended Data Fig. 1c). After global translation shutoff, most ribosomes remained idle. However, (+)vRNA was associated with translating polysomes (Fig. 1b, Extended Data Fig. 1d). Thus, vRNA is efficiently translated and cellular mRNAs are not. Viral polysomes are separate from viral replication compartments, as (+)vRNA shifted to lighter fractions upon EDTA treatment (Extended Data Fig. 1e), and viral polymerases and (−)vRNA were absent from polysome fractions (Fig. 1b, Extended Data Fig. 1d).
Figure 1. Polysome modularity is hijacked by RNA viruses.

a, Polysomes were extracted from cells infected with Polio (PV), Zika (ZIKV) or Dengue (DENV) and analyzed by mass-spectrometry (MS). b, Viral genomes are efficiently translated despite shutoff of host translation. Polysome profiles on sucrose gradients combined with qPCR for (+)viral RNA (purple), puromycin nascent chain labeling (pink) and immunoblotting for viral polymerase (black). Representative of 3 biological replicates. c, Principal component analysis of changes in non-ribosomal polysome interactors shows similar remodeling by ZIKV and DENV, distinct from PV. d, Change over time in differentially associated proteins (ANOVA FDR<0.01) in polysome MS (left) and total proteome (right). e, Examples of host polysome interactors. Each line represents one biological replicate of MS timecourse. Dotted gray line, translation shutoff. f, Functional changes in polysomes during infection (ANOVA FDR<0.01). g, Summary of changes in polysomes during infection. eIFs, eukaryotic translation initiation factors; TFs, translation factors.
For each virus, we examined polysome composition before, during and after translation shutoff using liquid chromatography tandem mass-spectrometry (LC-MS/MS) (Supplementary Table 1 and Extended Data Fig. 2a). Over 1,000 host proteins were detected, with ribosomal proteins enriched over input lysates, and cytoskeleton, ER and mitochondrial proteins depleted (Extended Data Fig. 2b). As expected, viral polyproteins were strongly enriched at later timepoints (Extended Data Fig. 2c–d). MS of parallel samples pretreated with puromycin to induce ribosome runoff identified non-polysomal proteins whose sedimentation pattern is similar but refractory to puromycin (predominantly cytoskeletal or exosomal components) (Extended Data Fig. 2e and Supplementary Table 2). Bona-fide proteins interacting with polysomes included translation regulators, chaperones, targeting factors, ribosome quality control components, kinases, nucleases and proteasomal subunits (Extended Data Fig. 2f).
The stoichiometry of core ribosomal proteins was unaffected by infection, although changes in specific peptides (Extended Data Fig. 3, Supplementary Table 3) might indicate virus-induced post-translational modifications. Some viruses can affect specific ribosomal proteins2,6, but PV, ZIKV and DENV primarily modulate polysome association of non-ribosomal proteins (Fig. 1c, Extended Date Fig. 3c–d). Unsupervised hierarchical clustering of differentially associated proteins (ANOVA, FDR<0.01, Supplementary Table 4) revealed specific temporal patterns of polysome recruitment and depletion, not reflected in the total proteome (Fig. 1d, Extended Date Fig. 3e). Despite differences in virus biology and sampling times, many changes in polysome composition were pan-viral (Extended Data Fig. 3f), including recruitment of cytoplasmic Hsp70 (HSPA8) to promote cotranslational folding7 and eviction of G3BP1 to prevent translational silencing of vRNA8 (Fig. 1e). Some changes were similar for ZIKV and DENV but distinct for PV (Fig. 1d). ZIKV and DENV recruited ER Hsp70 (HSPA5/BiP), which binds nascent viral polypeptides in the ER lumen9, and PV recruited PCBP2, an IRES-transactivating factor (ITAF)10 (Fig. 1e).
Gene ontology (Fig. 1f) and volcano plot (Extended Data Fig. 4) analyses show all three viruses evict from polysomes specific factors involved in translation initiation and RNA quality control (Fig. 1h), likely to disable host translation and antiviral responses. They also recruit a subnetwork of cytosolic chaperones to facilitate cotranslational folding. Virus-specific changes reflected their unique biosynthetic requirements. PV, which relies on its IRES for translation, recruited splicing machinery components, consistent with ITAF activity of alternative splicing factors11. Both flaviviruses recruited similar ER-resident factors involved in protein folding, glycosylation and lipid homeostasis—functions mostly evicted by PV. ZIKV and DENV also induced changes in unexpected networks e.g. ER peptidylprolyl-modifying enzymes and the actinomyosin network, although the latter may reflect non-polysomal cytoskeleton rearrangements12 (Extended Data Fig. 2e). These changes are summarized in Fig. 1g.
Host factor eviction from polysomes
We next considered how different viruses evict similar factors from polysomes, such as those involved in translational silencing (e.g. G3BP1/2) and RNA decay (e.g. UPF1, MOV10) (Extended Data Fig. 5a–b). For PV, viral proteases cleave and inactivate host proteins we find evicted from polysomes, such as G3BP113 (Extended Data Fig. 5c and. Fig. 5d). For flaviviruses, capsid protein and subgenomic RNA fragments (sfRNA) generated by incomplete XRN1 digestion (Extended Data Fig. 5g–h) bind antiviral factors14,15. These include many vRNA-interacting proteins16,17 we find evicted from polysomes (Extended Data Fig. 5e–f). Of note, ZIKV genomic vRNA (gRNA) is associated with polysomes while sfRNA and capsid are not (Extended Data Fig. 5i–k) suggesting that flaviviral sfRNA and capsid act as decoys, titrating antiviral host factors from polysomes. This may explain why mutations in ZIKV sfRNA or capsid result in loss of immune evasion18,19. We propose viruses use distinct but convergent strategies, including cleavage by viral protease and sequestration by sfRNA or capsid, to prevent polysome association of antiviral factors that limit their translation (Extended Data Fig. 5l).
Remodeling of translation initiation
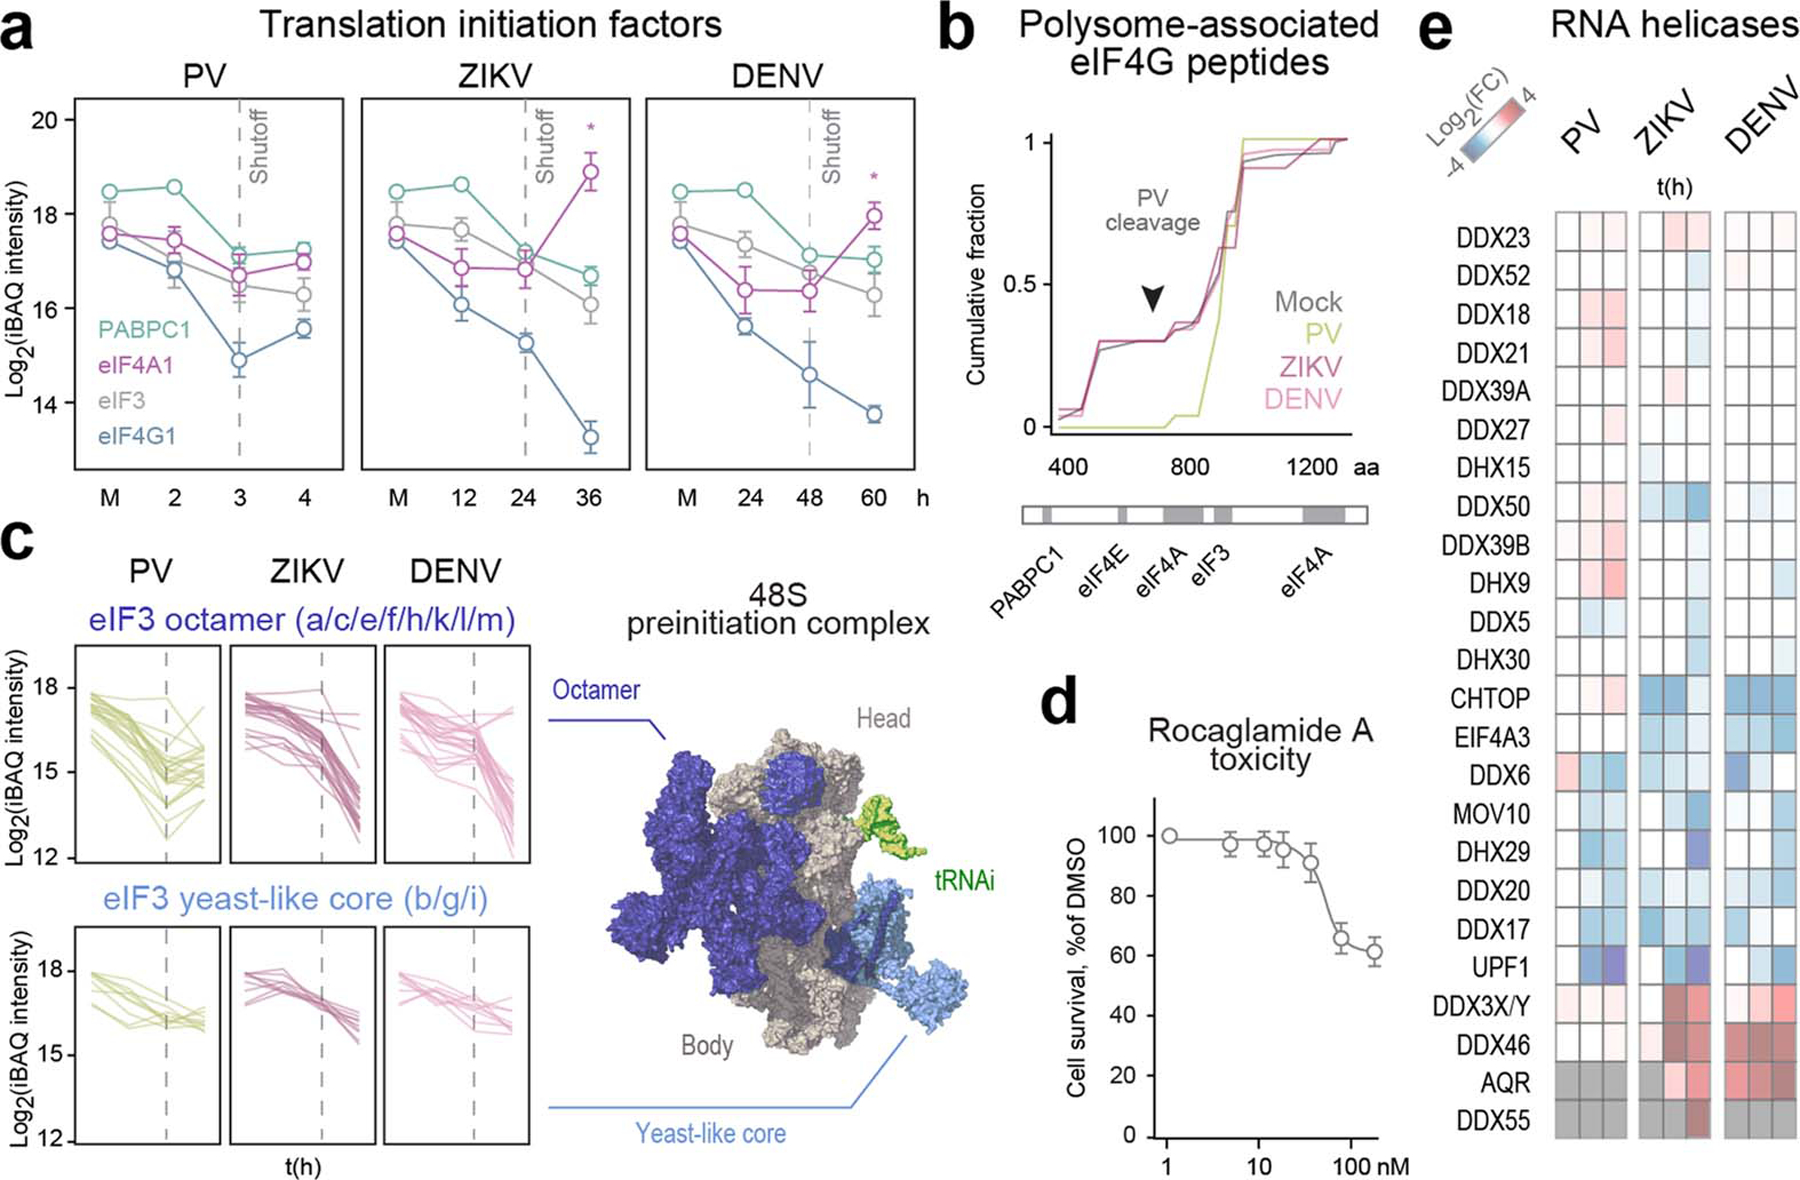
All three viruses reduced polysome association of most translation initiation factors (Fig. 2a), including eIF3, PABPC1 and eIF4G1 (Extended Data Fig. 6a). A C-terminal eIF4G1 cleavage fragment, which inhibits cap-dependent initiation but stimulates PV translation2, remained associated only with PV polysomes (Extended Data Fig. 6b). The two eIF3 modules—the octameric complex and the conserved yeast-like core (YLC)—behaved like separate subcomplexes on all viral polysomes. eIF3-YLC was mildly reduced, but the octamer was depleted by 50-fold (Extended Data Fig. 6c). In picornaviruses, eIF3a and 3b, which bridge the two subcomplexes, are cleaved20. These data suggest eIF3-octamer, but not YLC, is dispensable for translation of enteroviruses and flaviviruses.
Figure 2. Polysome-associated host targets for antiviral intervention.

a, Protein-protein interaction networks for host factors depleted from (blue) or recruited to (pink) polysomes during infection relative to Mock (ANOVA FDR<0.01). Each node is divided to reflect individual changes for each virus. Node size represents relative polysome abundance. b, RocA inhibits ZIKV and DENV but not PV by plaque assays. Means±s.d. of 3 biological replicates. P-value=0.0001 and 0.0007 for ZIKV and DENV at 24 and 36h, respectively. c, Targeting eIF4A1 selectively inhibits translation of ZIKV but not GAPDH RNA. qPCR of sucrose gradient fractions from cells infected with ZIKV (MOI=5) for 24h then treated with 30 nM RocA for 30 min. Inset, polysome profiles for ZIKV-infected cells with (pink) or without (black) RocA. Means±s.d. of 3 biological replicates. d, Cytosolic proteostasis factors required for viral replication. Plaque assays from WT and KD cells infected with PV, ZIKV or DENV (MOI=0.1). Means±s.d. of 3 biological replicates. e, Hsp70 inhibitor induces PV nascent chain aggregation and reduces soluble VP1 capsid proteins. WT cells infected with PV (MOI=5) with or without Hsp70 inhibitors, with puromycin added at 3.5 hpi. Representative of 2 biological replicates. f, ER proteostasis factors required for viral replication. Plaque assays from WT and KD cells infected with ZIKV or DENV (MOI=0.1). Means±s.d. of 3 biological replicates. g, Means±s.d. of plaque assays (top, 3 biological replicates) and immunoblots (representative of 2 biological replicates) from cells infected as in (f) and treated with various drug combinations. α-Gluc, alpha glucosidase inhibitor Acarbose (100 μM); Pdi, protein disulfide isomerase inhibitor 16F16 (2 μM); Calm., calmodulin inhibitor W7 (10 μM); Mttp, microsomal triglyceride transfer protein inhibitor Lomitapide (1 μM); Grp94, ER Hsp90 (HSP90B1) inhibitor PU-WS13 (1 μM).
Viruses also recruited non-canonical translation factors. PV recruited ITAFs (PCBP2, CSDE1-STRAP (Unr-Unrip)21 and glycyl-tRNA synthetase22) and nucleocytoplasmic interactors that may represent novel ITAFs (hnRNPR, SRSF10 and TRA2B; Extended Data Fig. 7). DENV and ZIKV recruited eIF4A1 (Extended Data Fig. 6a), an RNA helicase that unwinds secondary structure in 5’ UTRs of mRNAs23. At the doses tested, eIF4A1 inhibitor Rocaglamide A (RocA) showed antiviral effects against ZIKV and DENV, but not PV (Fig. 2b). RocA was only mildly toxic in both tissue cultures (Extended Data Fig. 6d) and clinical settings24. Its antiviral effect was mediated by specific inhibition of vRNA translation, as it reduced polysome association of ZIKV (+)vRNA but not GAPDH mRNA (Fig. 2c). ZIKV and DENV also recruited other RNA helicases to polysomes (Extended Data Fig. 7e), including DDX3X, which promotes flavivirus translation and replication25, and DDX46, DDX55 and AQR, which may be antiviral drug targets.
Cotranslational chaperone recruitment
All three viruses recruited a selective subnetwork of Hsp70-centered chaperones (Fig. 2a) that facilitate cotranslational protein folding26. ZIKV and DENV, but not PV, evicted from polysomes both subunits of the nascent chain-associated complex (NACA/BTF3; Fig. 2a), perhaps reflecting ER targeting27. Pan-viral cytosolic chaperones included Hsp70 isoforms HSPA8 and HSPA1A/B, and two Hsp70 co-chaperones: J-domain DNAJA2 and nucleotide-exchange factor BAG2. PV uniquely recruited another J-domain co-chaperone, DNAJB1 (Extended Data Fig. 8a). Knockdown of any pan-viral chaperone inhibited production of all three viruses, but that of DNAJB1 only affected PV (Fig. 2d; Extended Data Fig. 8b). Allosteric Hsp70 inhibitors JG40 and JG345 inhibited ZIKV and DENV infection at concentrations nontoxic to the host (Extended Data Fig. 8c–d)28,29, but only JG345 inhibited PV (Extended Data Fig. 8d–e)—causing cotranslational aggregation of nascent viral polypeptides (Fig. 2e).
ZIKV and DENV recruited ER proteostasis factors to polysomes (Fig. 2a, Extended Data Fig. 8f–g). Polysomes of ZIKV and DENV, but not PV, recruited ER Hsp70 HSPA5/BiP and specific co-chaperones: J-domain proteins DNAJB11, DNAJC3 and DNAJC10 and nucleotide exchange cofactor HYOU1. Also recruited were calcium-dependent ER chaperones and enzymes from the calnexin/calreticulin glycosylation-folding cycle, as well as machineries for ER-associated degradation, ER-to-Golgi trafficking and lipid and triglyceride homeostasis. Importantly, knockdown and pharmacological inhibition of these factors confirmed their requirement for virus production (Fig. 2f–g; Extended Data Fig. 8h–i). The cotranslational recruitment of multiple ER systems to ZIKV and DENV polysomes highlights the challenging maturation of the long flavivirus polyprotein into viral complexes.
Cotranslational proline hydroxylation
ZIKV and DENV polysomes recruited ER-resident prolyl hydroxylases that modify collagen prolines30 (P4HA1/2 and P3H1/2) and their structural scaffold protein (Fig. 3a,b). Also recruited were collagen-specific chaperone Hsp47/SERPINH1 and ER-resident prolyl isomerases FKBP10 and 11, all of which cooperate to introduce the hydroxyproline modifications required for collagen folding, secretion and structural integrity31,32. While collagen-specific prolyl hydroxylases and chaperones were enriched on ZIKV and DENV polysomes, collagens and an inducer of collagen translation33 were not (Fig. 3a, Extended Data Fig. 9a).
Figure 3. ZIKV and DENV infection requires collagen prolyl hydroxylases.
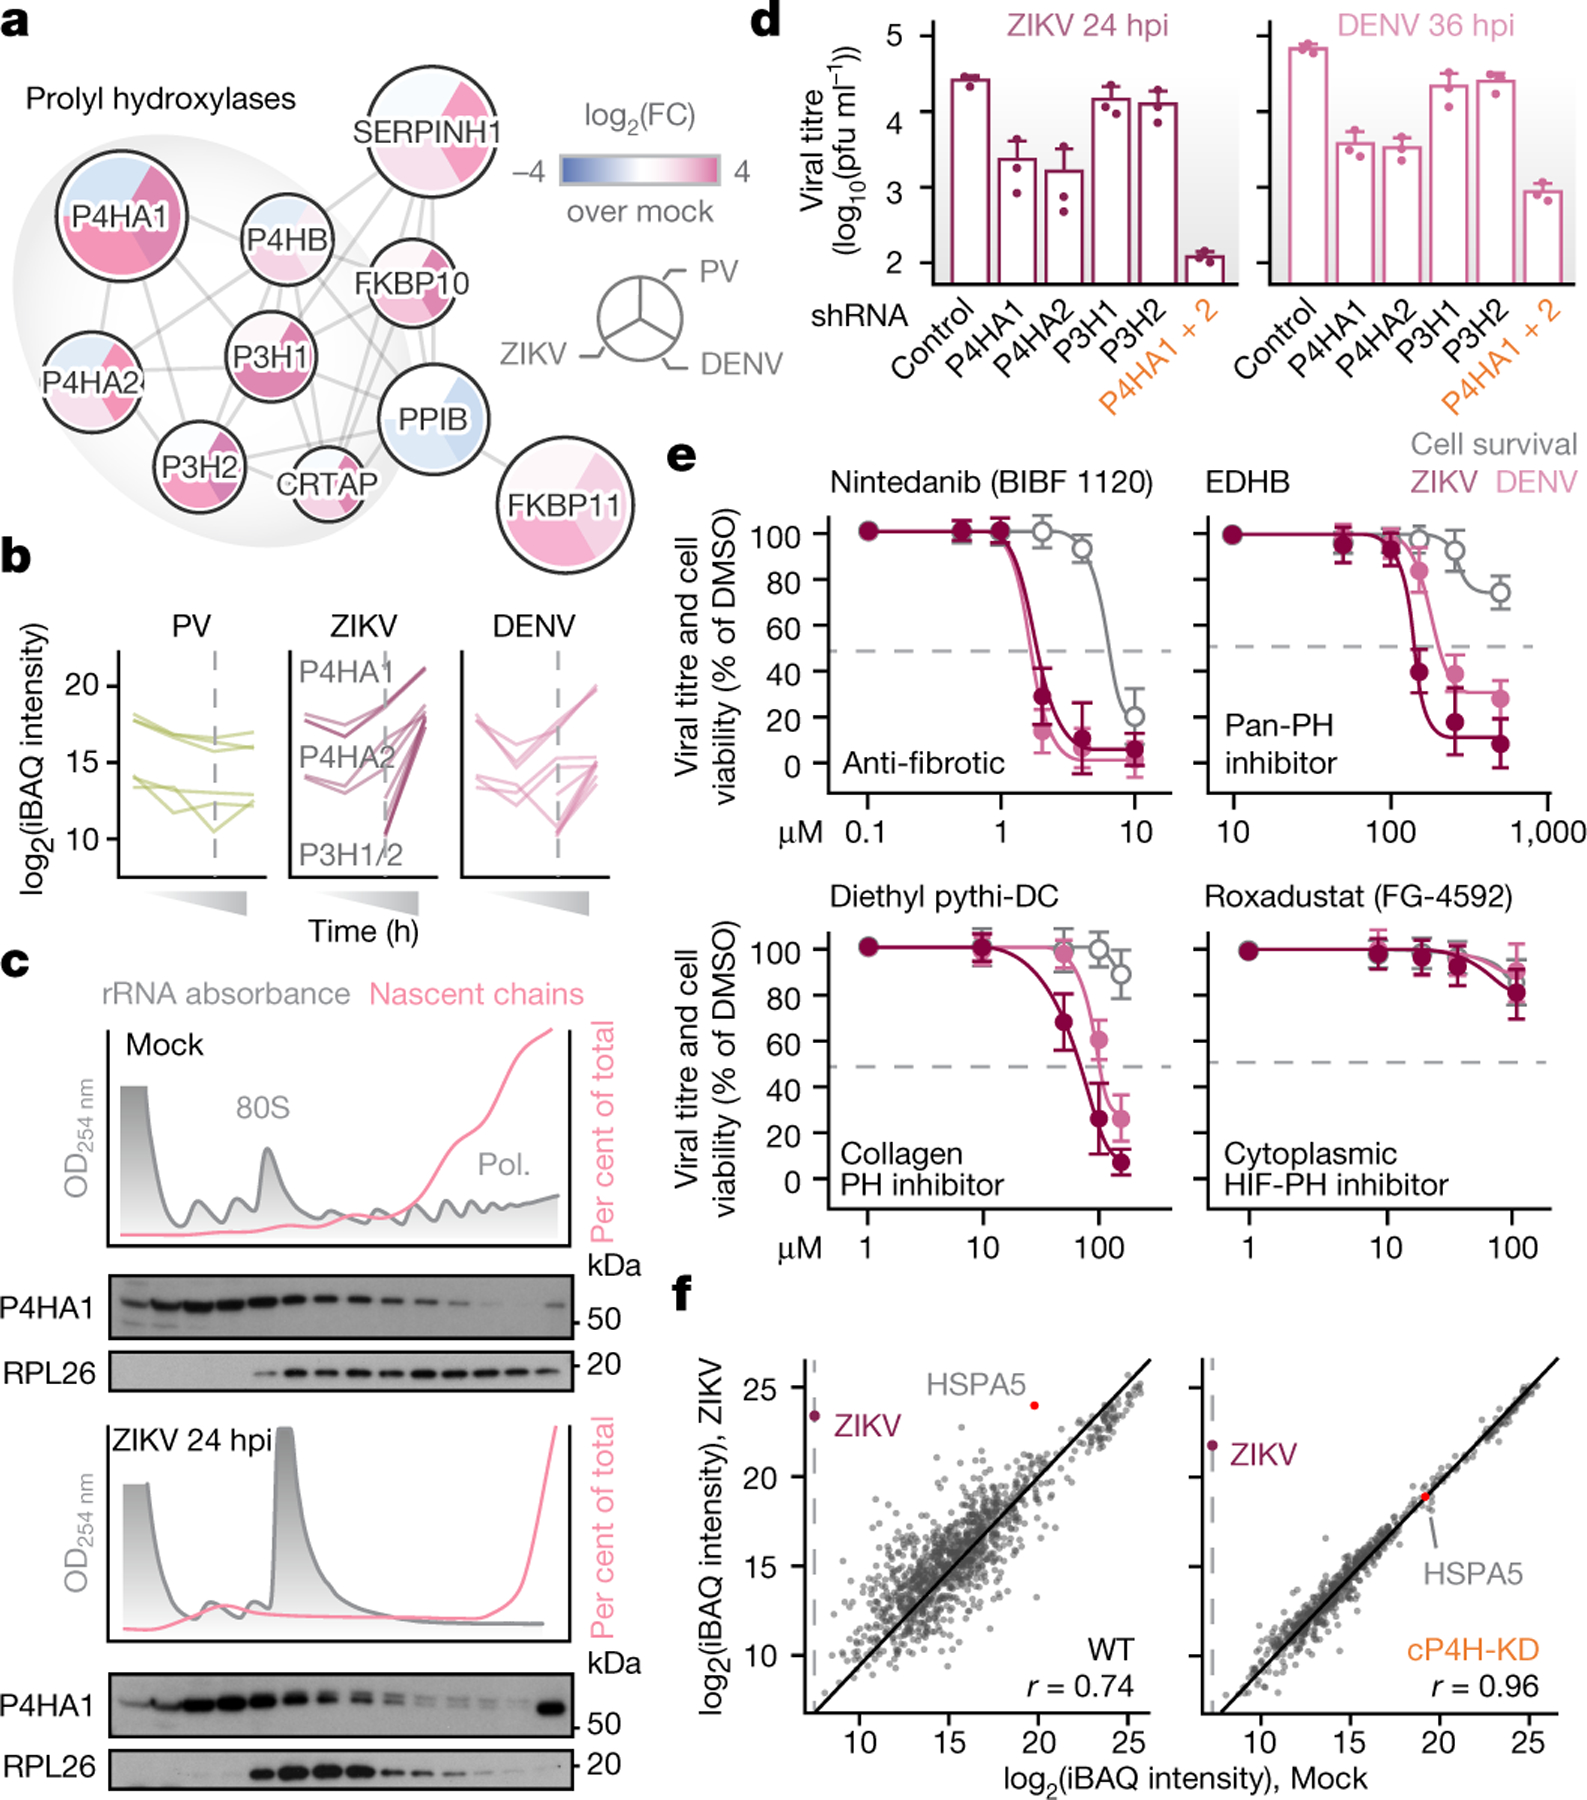
a, Protein-protein interaction network as in Fig. 2a. b, Collagen prolyl hydroxylases P4HA1/2 and P3H1/2 are recruited to polysomes by ZIKV and DENV but not PV. Each line represents one biological replicate of MS timecourse. Dotted gray line, translation shutoff. c, P4HA1 co-sediments with polysomes during ZIKV infection. Cells infected with ZIKV (MOI=5) were subjected to sucrose gradient fractionation and puromycin labeling. rRNA absorbance profiles (gray), puromycin-labeled nascent chains (pink) and immunoblots (bottom). Representative of 3 biological replicates. d, KD of P4HA1/2 reduces ZIKV and DENV titers. Plaque assays from WT and KD cells infected with ZIKV or DENV (MOI=0.1). Means±s.d. of 3 biological replicates. For P4HA1+2 KD, two-tailed Student’s T-test p-value=0.0008 and 0.0009 for ZIKV and DENV, respectively. e, Pharmacologic inhibition of ER collagen prolyl hydroxylases, but not cytoplasmic HIF prolyl hydroxylases, reduces ZIKV and DENV titers. Pink and purple, dose-response curves by plaque assays; gray, cell viability. Means±s.d. of 3 biological replicates. f, Loss of cP4H prevents polysome remodeling by ZIKV. Polysome MS analysis of WT or cP4H-KD cells infected with ZIKV (MOI=5) for 36h. Scatterplot, pairwise comparisons of iBAQ intensities for host and viral proteins upon ZIKV infection. r, Spearman correlation coefficient.
Collagen prolyl hydroxylase P4HA1 co-sedimented with polysomes in cells infected with ZIKV and DENV but not PV (Fig. 3c and Extended Data Fig. 9b). This was sensitive to harringtonine and puromycin treatment (Extended Data Fig. 9c), confirming P4HA1 associates cotranslationally30 with viral polypeptides. Knockdown of P4HA1 or P4HA2 reduced infectivity of ZIKV and DENV without affecting PV (Fig. 3d; Extended Data Fig. 9d–g). Combined P4HA1 and P4HA2 knockdown (cP4H-KD) led to stronger inhibition, with 100–1000-fold reduction in titers at low MOI (Fig. 3d) and somewhat lower reduction at higher MOIs, regardless of the addition of proline hydroxylation cofactor ascorbic acid (Extended Data Fig. 9f–h). Small-molecule inhibitors of collagen production Nintedanib, an FDA-approved anti-fibrotic drug, and EDHB or diethyl Pythi-DC, inhibitors of collagen prolyl hydroxylase, reduced ZIKV and DENV titers in a dose-dependent manner (Fig. 3e). In contrast, an inhibitor of cytoplasmic non-collagen prolyl hydroxylase (Roxadustat) had no effect on viral titers (Fig. 3e).
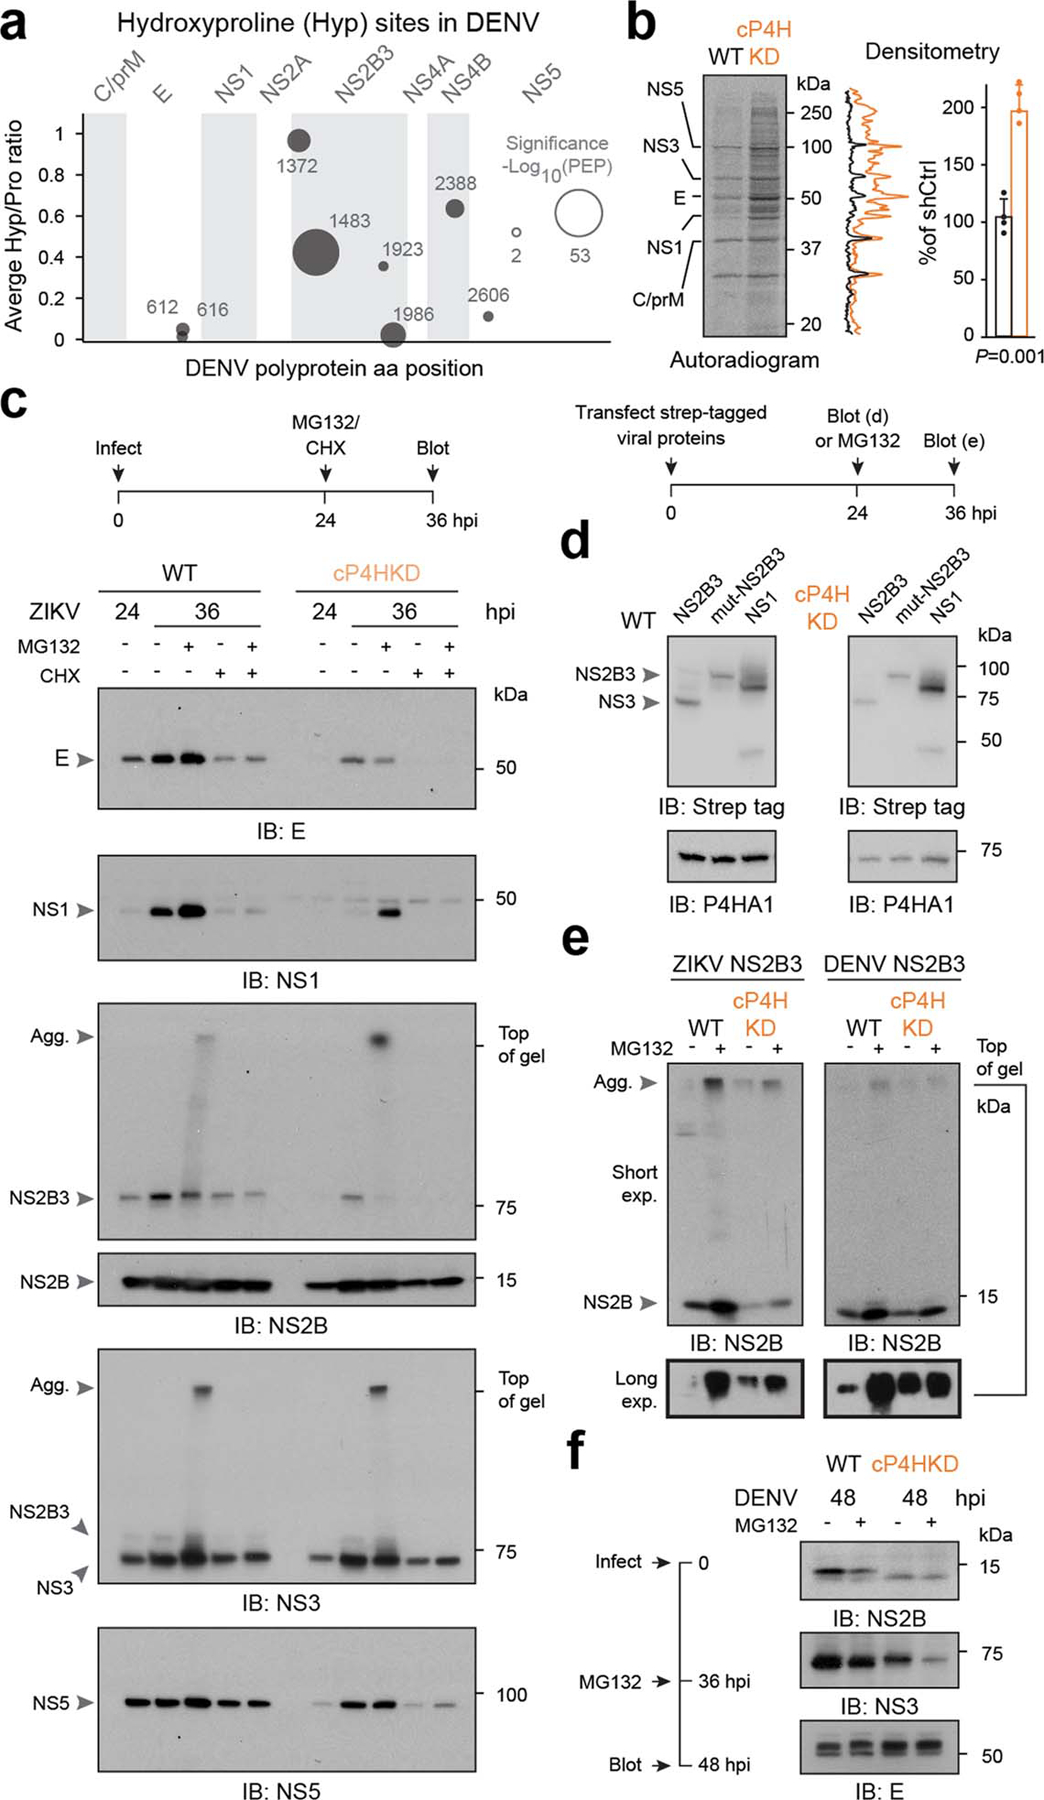
We next performed polysome MS for ZIKV in WT and cP4H-KD cells, at high MOI. Despite similar levels of viral nascent polypeptides, no polysome remodeling occurred in infected cP4H-KD cells, suggesting collagen prolyl hydroxylases are required for ZIKV biogenesis downstream of vRNA translation. Polysome MS revealed multiple sites in nascent chains of ZIKV (Fig. 4a) and DENV (Extended Data Fig. 10a) that are modified with hydroxyproline (supplementary Table 5). These modifications were abrogated in cP4H-KD cells, despite similar abundance of the viral peptide spanning the most modified prolines (Fig. 4b–c). Major hydroxyprolines in ZIKV and DENV map to conserved prolines in NS2B, a transmembrane cofactor of the viral protease (Fig. 4d), suggesting a conserved function.
Figure 4. Cotranslational proline hydroxylation protects ZIKV and DENV proteins from aggregation and degradation.

a, ZIKV prolines are hydroxylated cotranslationally by cP4H. Bubbles show individual hydroxyproline sites detected by polysome MS in WT (black) or cP4H-KD (orange) cells infected with ZIKV for 36h. Bubble size is proportional to posterior error probability (PEP) of hydroxyproline sites detection. b, MS CID spectra of ZIKV peptide spanning amino acids 1373–1395. c, Peptide from (b) is present at similar levels in WT and cP4H-KD cells. Means±s.d. of 3 biological replicates. d, Top, ZIKV polyprotein domains at the ER membrane with cytosolic (green), transmembrane (pink) and ER lumenal (purple) domains. Red arrows indicate hydroxyproline sites in NS2B. Bottom, multiple sequence alignment of flavivirus NS2B shows conservation of modified prolines despite high variability in other positions. e, cP4H stabilizes ZIKV polyprotein N-terminal domains. Cumulative fraction (top) and individual peptides (bottom) of polysome-associated ZIKV proteins from Fig. 3f shows lower N-terminal abundance in infected cP4H-KD (orange) versus WT (black) cells. Bar graph reflects the ratio of N-terminal E protein to C-terminal NS5 protein. Means±s.d. of 3 biological replicates. P, two-tailed Student’s T test p-value. f, cP4H protects ZIKV proteins from aggregation and proteasomal degradation. Immunoblots of WT and cP4H-KD cells infected with ZIKV (MOI=10) and at 24h treated with MG132 for additional 12h. Representative of 3 biological replicates. g, Role of cP4H in ZIKV infection.
Structural models34 suggest the conserved hydroxyprolines locate to short loops connecting NS2B transmembrane domains (Fig. 4d). We hypothesized that proline hydroxylation enables tight turns in these loops to fold and/or stabilize transmembrane domain topology. cP4H-mediated 4R hydroxylation endows the proline pyrrolidine ring with a strong preference for the Cγ-exo conformation, favoring the trans state35. In this setting, even a single proline hydroxylation event can be strongly stabilizing36. We thus compared nascent ZIKV polypeptide biogenesis in WT and cP4H-KD cells. ZIKV is translated as a single polyprotein; each polysome should therefore contain more N- than C-terminal peptides. This was true for WT cells, but peptides from the N-terminal region were strongly depleted in cP4H-KD cells upstream to the major hydroxyproline-1375/6 sites in NS2B (Fig. 4e, top). Individual peptides and the ratio of peptides mapping to N-terminal protein E and C-terminal protein NS5 (Fig. 4e, bubble chart and bar graph) confirmed lower N-terminal abundance of nascent ZIKV polyprotein in cP4H-KD over WT cells. In contrast, nascent peptides downstream of hydroxyproline-1375/6 were detected at similar levels in cP4H-KD and WT cells. Thus, loss of prolyl-hydroxylation in NS2B may have led to misfolding and degradation of N-terminal viral regions.
Metabolic labeling of WT and cP4H-KD cells confirmed that loss of proline hydroxylation did not block viral protein synthesis (Extended Data Fig. 10b). Consistent with the loss of viral polysome remodeling (Fig. 3f), shutoff of host protein synthesis was less efficient in infected cP4H-KD cells (Extended Data Fig. 10b). We next used proteasome inhibitor MG132 to evaluate if loss of proline hydroxylation leads to degradation or aggregation of N-terminal viral proteins. Levels of ZIKV proteins NS5 and NS3, which are C-terminal to NS2B, were similar in WT and cP4H-KD cells regardless of MG132 treatment (Fig. 4f and Extended Data Fig. 10c). In contrast, NS1 and E—which are N-terminal to NS2B—were reduced in cP4HKD cells. Proteasome inhibition partially rescued NS1 but not E levels, suggesting their clearance occurs through different pathways. Strikingly, cP4H-KD caused aggregation of NS2B, leading to decreased NS2B3 levels (Fig. 4f, Extended Data Fig. 10c). NS2B aggregates are found in WT cells only upon proteasome inhibition, suggesting this protein populates aggregation-prone folding intermediates. To probe the effects of proline hydroxylation on viral proteins independently of infection, we expressed strep-tagged viral proteins in WT and cP4H-KD cells. Neither NS1 stability nor NS2B3 processing were affected by cP4H depletion, indicating these processes do not require cP4H (Extended Data Fig. 10e). in contrast, cP4H depletion did increased aggregation of ectopic NS2B (Extended Data Fig. 10f), consistent with a folding defect.
cP4H depletion also affects DENV biogenesis (Extended Data Figure 9g). DENV infection of cP4H-KD cells led to lower NS2B levels and altered gel-migration pattern (Extended Data Fig. 10d), consistent with loss of hydroxylation or hydroxylation-dependent modifications37. Ectopic expression of DENV NS2B in cP4H-KD cells also led to increased aggregation (Extended Data Fig. 10f). cP4H depletion had similar effects on ZIKV and DENV NS2B, and lowered DENV NS3 levels, but did not affect DENV E protein stability (Extended Data Fig. 10d). Perhaps the distal effect of misfolded nascent NS2B on other viral proteins depends on polyprotein topography.
DISCUSSION
Our proteomic strategy to define polysome specialization during RNA virus infection provided a wealth of information on host-virus interactions, not otherwise detected by standard affinity-purification MS. PV, ZIKV and DENV affect polysome association of hundreds of cellular factors, co-opting the translation machinery and disabling antiviral effectors. The power of this approach to identify novel targets for antiviral therapies is highlighted by our discovery of prolyl-hydroxylation as a novel cotranslational modification essential for folding of flavivirus polyproteins.
All three viruses evict from polysomes surveillance factors that trigger RNA sequestration and degradation or induce an innate immune response. We speculate that PV, ZIKV and DENV use distinct but convergent strategies to stop factors from binding to polysome-associated gRNA and suppressing its translation. All three also inhibit host translation initiation. They seem to rely on canonical translation factors early in infection, switching to noncanonical modes once polysomes are remodeled. Their ability to use canonical host mechanism suggests non-canonical initiation is not essential for virus translation but rather a strategy to continue viral synthesis after host shutoff. Our finding that ZIKV polysomes are not remodeled in cP4H-KD cells suggests nascent viral chains contribute to polysome remodeling, challenging the classical view that polysome composition is determined by cis-acting RNA elements. All three viruses recruit multiple RNA helicases, possibly to assist translation of the highly structured vRNA. As eIF4A inhibitor RocA inhibits ZIKV translation, these may be targets for antiviral development.
The three viruses also recruit proteostasis components, including a pan-viral cytoplasmic Hsp70 subnetwork required for virus production. Knockdown or pharmacological Hsp70 inhibition reduces viral infectivity by inducing aggregation of viral nascent chains. This explains why drugs targeting proteostasis components have broad-spectrum activity against viruses in tissue culture and animal models4. Depletion or inhibition of polysome-bound proteostasis factors strongly reduced viral infection. Since many RNA viruses face similar challenges in polyprotein folding, this concept may reveal therapeutic targets for multiple viral pathogens.
Finally, we found an unexpected feature of flavivirus protein biogenesis. ER collagen prolyl-hydroxylases cotranslationally modify multiple sites on ZIKV and DENV nascent chains, including conserved prolines located in the polytopic membrane protein NS2B. Inhibiting prolyl-hydroxylation leads to aggregation of NS2B and degradation of other viral proteins, reducing ZIKV and DENV titers (Fig. 4g). Our findings raise questions about the mechanisms that recruit prolyl-hydroxylases to viral polysomes, their role in polysome remodeling and the cotranslational quality-control pathways that degrade misfolded viral polyproteins. Importantly, prolyl-hydroxylase inhibitors may become a new class of antivirals against flaviviruses.
The surprising convergence in how RNA viruses remodel host translation and recruit machineries for successful infection underscores the ability of our technical and analytical pipeline to uncover, with high confidence, biosynthetic mechanisms and host pathways required for the pathogenesis of diverse viruses.
Methods
Cell Cultures
Huh7 human hepatocellular carcinoma cells were grown in DMEM/F-12 1:1 medium supplemented with 10% fetal bovine serum (FBS, Gibco), 100 units/mL penicillin and 100 mg/mL streptomycin. HEK293T human embryonic kidney cells were grown in DMEM medium supplemented as above. Vero E6 African green monkey kidney cells were grown in Eagle’s MEM medium supplemented as above. All cells were grown at 37°C in a 5% CO2 incubator. All cells were from ATCC and tested negative for mycoplasma contamination before each batch freezing.
Virus strains and virus production
Virus strains used in this study were poliovirus type 1 Mahoney (PV)38, zika virus strain PRVABC59 (ZIKV, gift from S. Weaver & R. Tesh) and dengue virus type 2 strain 16681 (DENV)39. To generate polio and dengue viral RNA, 10 μg prib(+)XpA (PV) or pD2/IC-30P-A (DENV) plasmids was first linearized by incubation with 50 units of EcoRI and XbaI, respectively, for 2 h at 37°C. Linearized DNA was extracted using phenol:chloroform:isoamyl alcohol (25:24:1 v/v, Ambion), followed by in vitro transcription using MEGAscript T7 Transcription Kit (Thermo) with (DENV) or without (PV) m7-GpppA cap analog, according to the manufacturer’s instructions. 10 μg of transcribed viral RNA was electroporated into 4×10⁶ Huh7 cells in 0.4 mL PBS at 270 V/960 μF, using chilled 4 mm electroporation cuvette (Bio-Rad) and a GenePulser (Bio-Rad). Cells were grown until cytopathic effects were visible, at which point culture flasks were subjected to three freeze-thaw cycles (PV only) and supernatant was centrifuged at 2500 × g for 5 min, 4°C, to remove cell debris. Clarified supernatants containing P0 virus were aliquoted and frozen at −80°C. Viruses were passaged once in Huh7 cells to generate P1 virus stock, which was processed and frozen as above. Zika virus stocks were generated by propagation in Huh7 cells.
Viral titration by plaque assays
1×10⁵ Vero cells were seeded in 6-well plates. The following day, 10-fold serial dilutions of virus stocks/samples were prepared in fresh media containing 2% FBS. Cells were washed once with PBS and 0.5 mL inoculum was added for 40 min (PV), 60 min (ZIKV) or 90 min (DENV) at 37°C. To prepare the overlay solution, 2% low melting point agarose (Thermo) was dissolved in water by microwaving and combined 1:1 v/v with 2x media supplemented with 2% FBS just before use. 2 ml overlay solution was added to each well and allowed to gel at room temperature. 2, 4 or 6 days after infection with PV, ZIKV or DENV, respectively, 2 ml 2% formaldehyde (MilliporeSigma) was added to each well and fixation was allowed to proceed for at least 1 h at room temperature. Formaldehyde and overlay were removed and cell were stained with 1 ml 0.1% crystal violet (MilliporeSigma) in 20% ethanol for at least 1 h at room temperature. Plates were disinfected using 1% bleach and plaques were counted.
Infections
For infections, cells were washed once with PBS and viral inoculum was added into fresh media supplemented with 2% FBS (0.5 ml for 6-wells, 5 ml for T-175 flasks) for 40 min (PV), 60 min (ZIKV) or 90 min (DENV) at 37°C. Mock infection was performed similarly with media containing 2% serum. Inoculum was then replaced with fresh media supplemented with 10% FBS. In experiments with inhibitors, DMSO or drugs were added at this step, to eliminate potential effects on virus entry.
Sucrose gradient ultracentrifugation and polysome isolation
A total of 1–5×10⁷ infected or control Huh7 cells were harvested by scraping in ice-cold PBS, centrifuged 1000 × g for 5 min at 4°C, resuspended in PBS and centrifuged again. Cell pellets were flash frozen in liquid nitrogen. On the day of experiment, pellets were thawed on ice and resuspended in 200 μl Polysome buffer (25 mM Tris-HCl pH=7.5, 25 mM KCl, 10 mM MgCl2, 2 mM dithiothreitol (DTT, MilliporeSigma) and Complete EDTA-free protease inhibitor cocktail (Roche). Triton X-100 and Sodium deoxycholate were added to a final concentration of 1% each and the samples were incubated on ice for 20 min, passed 10 times through a 28G needle and centrifuged at 20,000 × g for 10 min at 4°C to remove cell debris. Clarified lysates were loaded on 10–50% sucrose gradients in Polysome buffer and subjected to ultracentrifugation at 36,000 rpm in an SW41.Ti swinging bucket rotor (Beckman Coulter) for 150 min at 4°C. 14 equal volume fractions were collected using Gradient Station (BioComp) with continuous monitoring of rRNA at UV254. For puromycylation and qPCR analyses, each gradient fraction was divided in two and processed in parallel. For subsequent polysome isolations, fractions 12–14 of each gradient were pooled, diluted 1:1 with Polysome buffer, loaded on 1 ml of 66% sucrose and subjected to ultracentrifugation at 50,000 rpm in a 70.1 Ti fixed angle rotor (Beckman Coulter) for 6 h at 4°C. Supernatants was removed and the pellet was washed once by gently dispensing and removing 1 ml of ice-cold Polysome buffer prior to resuspension in 100 μl polysome buffer.
For EDTA control experiments to dissociate polysomes and 80S monosomes into free 40 and 60S subunits (Extended Data Fig. 1e), cells were harvested as above and lysed in polysome buffer without MgCl2, supplemented with 30 mM EDTA. Lysates clarified as above were loaded on 10–50% sucrose gradients in polysome buffer without MgCl2, supplemented with 30 mM EDTA, and processed as above.
For puromycin control experiments (Extended Data Fig. 2e), 1 μM puromycin was added to cells 3 min prior to harvesting, lysis, and sucrose gradient centrifugation as above. Fractions 8–14 were pooled and processed as above.
Puromycylation and detection of puromycylated nascent chains
To label and detect nascent chains in tissue cultures, 2.5×10⁵ Huh7 cells in 6-well plates were incubated with 1 μM puromycin (Calbiochem) for 15 min at 37°C, washed twice with PBS and lysed on-plate using RIPA buffer as described above. To label and detect nascent chains in sucrose gradients, each gradient fraction was incubated with 1 μM puromycin for 15 min at 37°C, followed by incubation with 7 μl StrataClean beads (Agilent) for 16 h at 4°C with constant tumbling. Beads were washed once with 500 μl Polysome buffer and resuspended in 30 μl 2x Laemmli buffer. Puromycylated samples were resolved on SDS-PAGE as above and probed using an anti-puromycin antibody (MilliporeSigma).
Sample preparation for proteomic analysis
Proteins were extracted from cell lysates or isolated polysomes using methanol-chloroform precipitation. 400 μl methanol, 100 μl chloroform and 350 μl water were added sequentially to each 100 μl sample, followed by centrifugation at 14,000 × g for 5 min at room temperature. The top phase was removed and the protein interphase was precipitated by addition of 400 μl methanol, followed by centrifugation at 14,000 g for 5 min at room temperature. Pellet was air dried and resuspended in 8M urea, 25 mM ammonium bicarbonate (pH 7.5). Protein concentration was determined by BCA and 2–4 μg total protein were subjected to reduction and alkylation by incubation with 10 mM dithiothreitol (MilliporeSigma) for 1 h at room temperature followed by 55 mM iodoacetamide (MilliporeSigma) for 45 min at room temperature, in the dark. The samples were then incubated with 1:50 enzyme to protein ratio of sequencing-grade trypsin (Promega) overnight at 37 °C. Peptides were dried, desalted with C18 Ziptips (MilliporeSigma) and resuspended in 10 μL 0.1% formic acid in water.
LC-MS/MS acquisition
LC-MS/MS analyses were conducted using a Velos Pro Elite Orbitrap mass spectrometer (Thermo) coupled online to a nanoAcquity UPLC system (Waters Corporation) through an EASY-Spray nanoESI ion source (Thermo). An EASY-Spray PepMap RSLC C18, 3 μm, 75 μm × 15 cm column (Thermo Scientific) was used to resolve peptides using 0.1% formic acid in water as mobile phase A and 0.1% formic acid in acetonitrile as mobile phase B. Peptides were loaded at 2% B for 20 min at a flow rate of 600nL/min. Peptides were separated at 400nL/min using a gradient from 2% to 25% B over 48 or 220 min followed by a second gradient from 25% to 37% B over 8 minutes and then a column wash at 75% B and reequilibration at 2% B. Precursor scans were acquired in the Orbitrap analyzer (300–1800 m/z, resolution: 60,000@400 m/z, AGC target: 2e6. The top 6 most intense, doubly charged or higher ions were isolated (4 m/z isolation window), subjected to high-energy collisional dissociation (27.5 NCE), and the product ions measured in the Orbitrap analyzer (15,000@400 m/z, AGC target: 9e4).
Raw mass spectrometry data processing
Raw MS data were processed using MaxQuant version 1.6.7.040. MS/MS spectra searches were performed using the Andromeda search engine41 against the forward and reverse human Uniprot database (downloaded August 28, 2017), as well as viral amino acid sequences P03300 for PV (version January 23, 2007), AMC13911.1 for ZIKV (version February 1, 2016), and P29991 for DENV (version April 1, 1993). Cysteine carbamidomethylation was chosen as fixed modification and methionine oxidation and N-terminal acetylation as variable modifications. For proline hydroxylation studies, proline hydroxylation (+15.9949 Da) was added as a variable modification, followed by manual validation of fragmentation patterns. Hydroxyproline/proline ratios were extracted from MaxQuant modification-specific peptides table (ratio mod/base). Parent peptides and fragment ions were searched with maximal mass deviation of 6 and 20 ppm, respectively. Mass recalibration was performed with a window of 20 ppm. Maximum allowed false discovery rate (FDR) was <0.01 at both the peptide and protein levels, based on a standard target-decoy database approach. The “calculate peak properties” and “match between runs” options were enabled. When proteins could not be distinguished based on identified peptides, they were merged into a single protein group.
Statistical analyses and visualizations
All statistical tests were performed with Perseus version 1.6.7.0 using log2 transformed ProteinGroups, Peptides or Modification Peptides output tables from MaxQuant. Potential contaminants, proteins identified in the reverse dataset and proteins only identified by site were filtered out. Intensity-based absolute quantification (iBAQ) was used to estimate absolute protein abundance. Data was log2 transformed and divided into “core ribosome” and “nonribosomal” sets. Each set was normalized by calculating the median of log2-transformed iBAQ intensities for each MS run and subtracting it from each log2-transformed iBAQ intensity in the same run. For principal component analysis in Fig. 1c, data imputation was performed by replacing missing values with random values from a normal distribution 0.3 the width of the original distribution with a downshift of 1.6 standard deviations. For fold-change analyses, the mean of log2-transformed iBAQ measurements in mock-infected cells was subtracted from each measurement in virus-infected cells. ANOVA with a permutation-based FDR of 0.01 and S0=0.1 with 250 randomizations was used to determine statistically significant differences between grouped replicates. Hierarchical clustering in Fig. 1d was performed using a Euclidean distance approach with complete linkage, after filtering for proteins detected in 3 of 3 replicates in at least one condition. Categorical annotation was based on Gene Ontology Biological Process (GOBP), Molecular Function (GOMF) and Cellular Component (GOCC), as well as protein complex assembly by CORUM, with manual validation. Functional enrichment analysis in Fig. 1f was generated by first calculating the median of log2-transformed iBAQ intensities of all proteins in each category, per sample. Then, fold change from mock was calculated by subtracting the values for mock-infected cells from each measurement in virus-infected cells. Protein networks were based on a STRING output and visualized in Cytoscape version 3.7.2. Dataset integration between the proteomic data generated in this study and data generated by others was performed based on Uniprot ID for human-human comparisons or Gene Symbol for human-mouse comparisons. Where multiple entries existed for the same Gene Symbol, a single entry was generated by calculating median value. Swarmplots were generated from MS/MS peptide intensities using RAWGraphs, with a minimum radius of 2 and maximum radius of either 20 or 30, anticollision iterations set to 1 and circles padding set to 0.5.
Generation of stable knockdown cell lines
5×10⁵ 293T cells were seeded in 6-well plated and transfected the following day. 600ng of each shRNA plasmid (Supplementary Table 6) together with 600 ng pMDLg/pRRE, 600 ng pRSV-REV and 200 ng pMD2.G (Addgene #12251, #12253 and #12259, respectively) were transfected using Lipofectamine LTX (Thermo) according to the manufacturer’s instructions. Supernatants were collected 48 h post-transfection and passed through a 0.45 μm syringe filter (MilliporeSigma). 1 ml lentivirus-containing supernatants was diluted with 1 ml fresh DMEM and added to Huh7 cells plated the day before at a density of 1×10⁵. After 6 h at 37°C, inoculum was removed and replaced with complete DMEM media. At 48 h, cells were transferred to a T25 flask and puromycin (MilliporeSigma) selection was started at 2 μg/ml. At 7 days post-transduction, cells were aliquoted and frozen at −80°C. Every knockdown was performed using a combination of two or three different shRNAs. Cell lines were authenticated by qRT-PCR.
Transfections of strep-tagged viral proteins
2×10⁵ WT or cP4H-KD Huh7 cells were seeded in 12-well plates and transfected the following day. 0.5 ug of c-terminally strep-tagged pcDNA4-ZIKVug-NS2B3, pcDNA4-ZIKVug-NS2B3 S135A (proteolytically inactive), pcDNA4-ZIKVug-NS1 or pcDNA4-DENV2-NS2B342 were transfected using Lipofectamine LTX (Thermo) according to the manufacturer’s instructions. 20 μM MG132 was added at 24 h post-transfections. For immunoblot analysis, on-plate lysis was performed as described under SDS-PAGE and immunoblotting.
Inhibitors
Proteasome inhibitor MG132 was from Calbiochem. eIF4A1 inhibitor Rocaglamide A, alpha-glucosidase inhibitor Acarbose, protein disulfide isomerase (PDI) inhibitor 16F16, microsomal triglyceride transfer protein (MTTP) inhibitor lomitapaide and pan prolyl hydroxylase inhibitor ethyl 3,4-dihydroxybenzoate (EDHB) were from MilliporeSigma. Hsp70 inhibitors JG40 and JG345 were a gift from J. Gestwicki. Calmodulin inhibitor W7, Grp94 inhibitor PU-WS13, anti-fibrotic Nintedanib (BIBF 1120), HIF prolyl hydroxylase inhibitor Roxadustat (FG-4592) were from Cayman Chemicals. Diethyl-pythiDC was from AOBIOS.
SDS-PAGE and immunoblotting
For immunoblotting, adherent cells were washed twice with ice-cold PBS and either lysed on plate with RIPA buffer (25 mM Tris-HCl pH=7.5, 150 mM NaCl, 1% NP-40, 0.5% Sodium deoxycholate) or scraped in PBS, pelleted by centrifugation for 5 min at 1,000 × g, 4°C and resuspended in Polysome buffer. Each lysis buffer was supplemented with fresh 2 mM dithiothreitol (DTT, MilliporeSigma) and Complete EDTA-free protease inhibitor cocktail (Roche), for 20 min at 4°C. RIPA buffer was also supplemented with 50 units/mL benzonase (NEB) to remove DNA contamination. Lysis was performed on ice for 20 min and lysates were clarified by centrifugation for 10 min at 12,000 × g, 4°C. Protein concentration was determined by BCA assay (Thermo) and 4x Laemmli sample buffer (Bio-Rad) supplemented with fresh 10% 2-mercaptoethanol (MilliporeSigma) was added to a final concentration of 1x. For nondenaturing immunoblots (Extended Data Fig. 10e), 2-mercaptoethanol was omitted from the sample buffer. 15–30 μg of each sample was resolved on 4–20% (Bio-Rad) or 12% (homemade) SDS-PAGE, transferred to 0.2 or 0.45 μm PVDF membranes presoaked in methanol for 30sec. Membranes were blocked with 4% molecular biology grade BSA (Fisher) in tris-buffered saline supplemented with 0.1% Tween-20 (MilliporeSigma) (TBST) for 1 h at room temperature then probed with specific primary antibodies for 2 h at room temperature. Immunoblot densitometry analysis was performed using ImageJ version 1.52a. Primary antibodies were diluted in 4% BSA/TBST supplemented with 0.02% sodium azide, as follows: rabbit anti-RPL26 (Abcam ab59567; 1:1000), goat anti-PV VP1 (Invitrogen PA1–73124; 1:2500), mouse anti-PV 3CD43 1:1000, rabbit anti-ZIKV E protein (Genetex GTX133326; 1:2000), rabbit anti-ZIKV NS5 (Genetex GTX133312; 1:2000), rabbit anti-ZIKV NS3 (Genetex GTX133309; 1:2000), rabbit anti-ZIKV NS2B (Genetex GTX133318; 1:5000), rabbit anti-ZIKV NS1 (Genetex GTX133307, 1:1000), rabbit anti-DENV E protein (Genetex GTX127277; 1:1000), rabbit anti-DENV NS5 (GTX103350; 1:2000), rabbit anti-DENV NS3 (GTX124252; 1:2000), rabbit DENV NS2B (GTX124246; 1:1000), mouse anti-G3BP (SCBT sc-81940; 1:2000), mouse anti-streptavidin (Qiagen 34850; 1:5000), rabbit anti-P4HA1 (Proteintech 12658-I-AP; 1:2000), mouse anti-puromycin (MilliporeSigma MABE343; 1:2500), mouse anti-beta actin (MilliporeSigma A5316; 1:5000). Secondary antibodies were diluted in 4% skim milk in TBST, as follows: goat anti-Mouse IgG, HRP (MilliporeSigma NA9310; 1:10,000), goat anti-Rabbit IgG, HRP (MilliporeSigma NA9340; 1:10,000), donkey anti-Goat IgG, HRP (SCBT SC-2020; 1:10,000).
Quantitative Real-Time PCR (qRT-PCR)
Cultured cells were washed with PBS and 0.5 ml Trizol (Thermo) was added per 6-well. RNA was extracted according to the manufacturer’s instructions. To extract RNA from sucrose gradient fractions, 1 μl pellet paint co-precipitant (MilliporeSigma) and 500 μl phenol:chloroform:isoamyl alcohol (25:24:1 v/v, Ambion) were added to each 500 μl fraction and incubated for 5 min at room temperature. After centrifugation at 12,000 × g for 15 min, 4°C, the top phase was removed and subjected to another round of extraction as above. RNA was precipitated as for Trizol and resuspend in 20 μl water. cDNA was synthesized using the High Capacity cDNA Reverse Transcription Kit (Thermo) according to the manufacturer’s instructions. 200 ng total RNA or 5 μl of RNA from each gradient fraction were incubated at 70°C for 10 min and then placed on ice and reverse transcription was performed using 500 nM either random hexamers or specific oligonucleotides for strand-specific (−)vRNA amplification (Supplementary Table 6). qRT-PCR analysis was performed using SensiFast SYBR (BioLine) and gene-specific primers (Supplementary Table 6) according to the manufacturers’ instructions. Ct values were normalized by GAPDH mRNA for total RNA (to estimate KD efficiency) or by sum of Ct values across all gradient fractions (to estimate relative abundance in specific gradient fractions).
Cell viability and dose-response curves
5×10³ Huh7 cells were seeded in 96-well plates. At 24 h, cells were treated with different concentrations of inhibitors for another 36 h. Cell viability was assayed using CellTiter-Glo (Promega), according to the manufacturer’s instructions. Standard Hill equation dose-response curves were generated using Dr. Fit44.
Radioactive metabolic labeling
5×10⁵ Huh7 cells were seeded in 6-wells. After infection as above, cells were washed once with PBS then incubated with 100 μCi/mL35S protein labeling mix (PerkinElmer) in 1.5 ml cysteine and methionine free DMEM (Thermo) for 1 h at 37°C. Cells were washed twice with PBS then lysed in RIPA buffer as described above. Samples were resolved on homemade 10% SDS-PAGE, which was dried for 2 h at 70°C using a gel drier (Bio-Rad). Autoradiography detection was performed using x-ray films.
Data availability
The mass spectrometry proteomics data have been deposited to the ProteomeXchange Consortium via the PRIDE45 partner repository with the dataset identifier PXD024546.
Extended Data
Extended data figure 1. Suppression of global translation is associated with preferential synthesis of viral proteins.

a-b, Schematics of vRNA and polyprotein organization for PV (a), ZIKV, and DENV (b). IRES, internal ribosome entry site; ORF, open reading frame. c, PV, ZIKV and DENV infection is associated with shutoff of global translation and continued synthesis of viral proteins. Top, immunoblots of cells infected with PV, ZIKV or DENV (MOI=5) and treated with puromycin for 15 min at the indicated timepoints, to label nascent chains. Results are representative of 4 independent repeats. Bottom, timecourse of infectious particle production detected by plaque assays (gray) and densitometry of viral proteins (black) or puromycin-labeled nascent chains (pink). Data are means ±s.d. d, Related to Figure 1b. Polysome profile analysis (top) and immunoblots (bottom) of infected and control cells subjected to sucrose gradient fractionation followed by either qPCR analysis of negative strand viral RNA or puromycin treatment of gradient fractions. Results are representative of 3 independent repeats. e, Cells infected as in d were lysed in buffer containing EDTA and no Mg2+ and subjected to polysome profile analysis and qPCR of positive strand viral RNA. Results are representative of 2 independent repeats.
Extended data figure 2. Overview of polysome MS in infected and control cells.

a, Pairwise comparisons of two biological replicates of polysome MS from mock-infected cells. Each dot represents the level of a single protein as detected by MS. iBAQ, intensity based absolute quantification. r, Spearman correlation coefficient. b, iBAQ-normalized MS intensities of proteins associated with the indicated cellular complexes and organelles, plotted as percent of total, for either lysate (input) or polysome MS analyses. Data are means ±s.d. n=2 and 3 for Lysate(input) and Polysomes, respectively. c, Venn bar diagram of proteins detected by polysome MS across all conditions and timepoints. d, Distribution of ribosomal protein intensities (gray) and median intensities of viral polyproteins (pink), as detected by polysome MS. e, To identify co-sedimenting non-polysomal proteins, we performed polysome MS on uninfected cells pretreated with 1 μM puromycin for 3 min. Puromycin treated and untreated controls were subjected to polysome profile analysis on sucrose gradients, in triplicates. Dashes lines indicate fractions pooled for MS analysis. Because samples are normalized for total protein content, non-polysomal proteins, whose migration in the gradient is unaffected by puromycin, will appear to be enriched, whereas polysomal proteins, which will shift to lighter fractions in a puromycin dependent manner, will appear depleted or unchanged. To determine fold-changes (FC), we subtracted the means of each log2-transformed iBAQ value in puromycin versus control. FC distribution is shown in green for ribosomal proteins and gray for non-ribosomal proteins (histogram). FC values were then used for 1D annotation enrichment analysis46, where the FC distribution in each category is compared to the global distribution using a two-sided Wilcoxon-Mann-Whitney test. FDR values for each category are plotted as a function of mean FC (scatterplot). f, Most proteins detected by polysome MS are either previously identified ribosome-interacting partners47,48 or known to be involved in protein biogenesis.
Extended data figure 3. Polysome composition is gradually and extensively remodeled during infection.

a, Infection is not associated with changes to the core ribosome composition. Volcano plots of median-adjusted iBAQ intensities of ribosomal proteins measured by polysome MS in infected and uninfected cells. Two-sided Student’s T-test, FDR<0.01, S0=1. b, Differential detection of peptides mapping to ribosomal proteins may reflect changes in post-translational modifications. Same analysis as in (a), only at the peptide level. Red, ribosomal peptides with statistically significant increases in polysome MS of DENV at 60 hpi versus mock. Bottom bar graph, number of changing peptides mapping to each indicated protein, plotted as percent of all detected peptides that map to that protein. All changing peptides were found to harbor at least one—and most more than two—potential PTM sites based on Phosphosite data. c, Pairwise comparisons of proteins detected by polysome MS (left) and total proteome analysis of matching lysate samples (right) in infected cells (y axis) versus uninfected control (x axis). r, Spearman correlation coefficient. d, Euclidean distance hierarchical clustering of Spearman correlation coefficients across all polysome MS samples. Highest correlations are in white, lowest in red. e, Protein rank plots for total proteome of infected cells. Viral polyproteins are indicated in color. f, Related to Fig. 1d, line plots show medians±interquartile range of fold change from mock in log2-transformed iBAQ intensities, based on clustering shown in Fig. 1d.
Extended data figure 4. Differentially associated polysome interactors in mock versus the terminal timepoint for each virus.

a-c, Volcano plots comparing mock polysome MS with that of PV (a), ZIKV (b) and DENV (c) at 4, 36 and 60h, respectively. Two-sided Student’s T-test, FDR<0.01, S0=1.
Extended data figure 5. Antiviral host factors are evicted from polysomes by distinct yet convergent mechanisms.

a, Major RNA QC factors are strongly evicted from polysomes by all three viruses. STRING protein-protein interaction network for host factors involved in RNA surveillance and quality control depleted from (blue) or recruited to (pink) polysomes during infection. Differentially associated proteins (ANOVA FDR<0.01 across all polysome MS samples) were grouped based on annotations in Fig. 1g. Each node is divided in three to reflect individual changes for each virus and colored based on changes in polysome association from Mock. Node size represents relative abundance, which is the maximum iBAQ intensity measured for each indicated protein across all polysome MS samples. b, Line plots of the change over time in polysome association of G3BP complexes (top) and UPF1/MOV10 (bottom) during infection. Each line represents a single replicate of polysome MS timecourse. Dotted gray line indicates time of translation shutoff. c, G3BP1 is cleaved during PV but not ZIKV or DENV infection. Immunoblot analysis of whole cell lysates from cells infected with PV, ZIKV or DENV (MOI=5). Timecourses are 1–6h for PV and 12–72h for ZIKV and DENV. Arrowhead marks the position of G3BP1 cleavage fragment. Results are representative of 2 independent repeats. d, Volcano plot comparing polysome interactors in cells infected with PV for 4h versus mock. Host proteins known to be cleaved by PV protease are indicated. e, Polysome MS captures most direct interactors of vRNA. Venn diagram of proteins detected by polysome MS and those detected by pulldown of PV, ZIKV and DENV vRNA from the indicated studies17,18. f, High affinity flavivirus RNA interactors are depleted from polysomes during infection. Violin plots of proteins detected by both vRNA pulldowns and polysome MS. Proteins were divided into two groups based on their polysome association in this study: depleted or recruited by more than 2 folds upon infection with ZIKV or DENV at 36 or 60h, compared to mock. y-axis, protein abundance in vRNA pulldown-MS. P, Mann Whitney U test p-value. For each violin plot, white circles indicate the median of each distribution, black rectangles indicate interquartile range and vertical lines indicate the 95% confidence intervals. g, Polysome interactors depleted during ZIKV infection consist of high affinity ZIKV 3’UTR or capsid interactors. Pairwise comparison of the fold change in polysomes interactors (x-axis) versus their protein abundance in ZIKV vRNA pulldown-MS (y-axis). Known ZIKV sfRNA and capsid interactors from14,15,49,50 are colored blue and purple, respectively. h, Schematic of the production of subgenomic flaviviral RNA (sfRNA) by limited 5’-to-3’ XRN1 exonucleolytic cleavage of full-length genomes. i-j, Most ZIKV sfRNA does not associate with polysomes. Cells were infected with ZIKV (MOI=5) for 24h and lysates were fractionated on sucrose gradients followed by: (i) qPCR analysis using primers that amplify either full-length genome (pink) or 3’UTR sequence present in both full-length genome and sfRNA (blue). Values for each fraction are plotted as percent of total across the entire gradient. Data are means ±s.d (n=3). (j) PCR analysis for specific detection of either gRNA or sfRNA using blocking oligonucleotides.51 k, Most ZIKV capsid does not associate with polysomes. Levels of ZIKV capsid detected by MS analysis of either polysomes or lysate input samples from cells infected with ZIKV for 36h. Values are sum of peptides mapping to the capsid region of the viral polyprotein divided by the sum of peptides mapping to ribosomal proteins, with average ratios in the lysate set as 1. Data are means ±s.d (n=3). P, two-tailed Student’s T test p-value. l, A similar set of RNA QC factors is evicted from polysomes by either viral protease cleavage (PV) or sfRNA/capsid sequestration (ZIKV) to prevent translational silencing of gRNA.
Extended data figure 6. Rearrangement of translation initiation complexes during viral infection.
a, Line plots of the change over time in polysome association of initiation factors 3 (eIF3), 4G1 (eIF4G1), 4A1 (eIF4A1) and poly-A binding protein (PABPC1). Included in the quantification of eIF3 are the 8 subunits of the core octamer complex. Data are means ±s.d. Asterisk denotes statistically significant differences in eIF4A1 polysome association between 24 and 36hpi for ZIKV and 48 to 60hpi for DENV (p=0.0037 and 0.0071, respectively, two-tailed Student’s T test). Dotted gray line indicates time of translation shutoff. b, eIF4G1 c-terminal fragment, generated by PV protease cleavage to inhibit cap-dependent translation while promoting PV-specific translation initiation21, is retained on polysomes during PV infection. Mapping of polysome-associated eIF4G1 peptides, as detected by polysome MS of cells infected with PV, ZIKV or DENV for 4, 36 and 60h, respectively, plotted as cumulative fraction from N- to C-termini. Protein-protein interaction domains are shown below. c, eIF3, a multisubunit complex, forms two distinct subcomplexes in virus-infected cells. Line plots of the change over time in polysome association of eIF3 subunits, divided into the octamer (top) and yeast-like core (bottom) subcomplexes, colored blue and cyan on the structure of a preinitiating 48S ribosome (right; PDB 6FEC). Each line represents a single replicate of polysome MS timecourse. Dotted gray line indicates time of translation shutoff. d, Toxicity of RocA at 36h. Data are means ±s.d. (n=3). e, Heatmap of the median fold change from mock in polysome association of RNA helicases during infection with each of the three viruses.
Extended data figure 7. RNA-binding proteins control the fate of polysome-associated PV vRNA.

Many RNA-binding proteins have been implicated in regulating PV translation and replication by binding and restructuring its 5’UTR52. a, Multiple RNA-binding proteins are uniquely recruited to polysomes by PV. STRING protein-protein interaction network for host factors involved in alternative splicing and mRNA processing depleted from (blue) or recruited to (pink) polysomes during infection. Differentially associated proteins (ANOVA FDR<0.01 across all polysome MS samples) were grouped based on annotations in Fig. 1g. Each node is divided into three to reflect individual changes for each virus and colored based on change in polysome association from Mock. Node size represents relative abundance, which is the maximum iBAQ intensity measured for each indicated protein across all polysome MS samples. b, To identify novel RNA interactors regulating PV biogenesis, we used the temporal pattern of change in CSDE1/Unr, a bonafide PV ITAF21, across all polysome MS samples. We then generated a list of the top 15 polysome-associated RNA-binding proteins based on similarity in temporal patterns using Euclidian distances. Shown are medians±interquartile range of the top 15 interactors identified. Specific protein names are noted on the right. Dotted gray line indicates time of translation shutoff. 7 of the top 15 hits are known interactors, including bona fide ITAFs e.g. PCBP2, STRAP/UnrIP21 and glycyl-tRNA synthetase (GARS)22. Recruitment of additional factors that mirror the same temporal pattern, e.g. hnRNPR, SRSF10 and TRA2B, likely reflects previously unknown involvement in PV biogenesis. c, Line plots of the change over time in polysome association of known PV 5’UTR binders, plotted as fold change from mock. Each line is median ±s.d. Dotted gray line indicates time of translation shutoff. Green, factors that stimulate PV translation; pink, factors that inhibit PV translation and stimulate replication; gray, alternative splicing factor cleaved by PV protease to facilitate infection53. Values for GARS were recalculated manually based on unique peptides only, as many peptides also map to IARS. Cytosolic ITAFs are recruited earlier than nuclear factors (3 versus 4 hpi), consistent with a later disruption of nuclear pores by PV protease54. This coincides with cleavage of PCBP2, which converts it from activator to inhibitor of translation55, as well as increased association of nuclear hnRNPC, an essential component of viral replication that competes with and displaces ITAFs from the 5’UTR of picornaviruses54,56. d, PV translation peaks by 3 hpi while replication lags by about an hour. (+)vRNA and 3CD polymerase were quantified by qPCR and immunoblot analysis, respectively, in cells infected with PV (MOI=5) for the indicated times. Shown are representative blots from 2 independent repeats, and qPCR values of (+)vRNA normalized to GAPDH (pink) and 3CD densitometry normalized to actin (black) (n=1). e, Schematic of the change in PV 5’UTR-binding proteins upon transition from translation to replication. Early during translation, viral genome binds cytosolic ITAFs that stimulate its translation. Later during infection, poliovirus 3C protease cleaves nuclear pore proteins, as well as alternative splicing factors released into the cytoplasm, to inhibit new rounds of translation initiation on polysome-associated vRNA. This releases vRNA from polysomes for use as a template in replication. Thus, the observed rearrangement of 5’UTR-binding proteins between 3 and 4hpi acts as a timer that shifts viral genomes from translation to replication.
Extended data figure 8. Cytosolic and ER proteostasis of viral nascent chains.

a, Line plots of the change over time in polysome association of cytosolic Hsp70 chaperones and co-chaperones. Each line represents a single replicate of polysome MS timecourse. Dotted gray line indicates time of translation shutoff. b, Efficiency of KD in Huh7 cells based on qPCR using primers specific to the indicated transcripts, normalized to GAPDH. (n=2) c, Toxicity of JG40 and JG345 at 36h. Data are means ±s.d. (n=3). d, JG345 inhibits PV, ZIKV and DENV, whereas JG40 only inhibits ZIKV and DENV. Virus production by plaque assays of cells infected with PV, ZIKV or DENV (MOI=0.1) for 5, 24 and 36h, respectively, in the presence or absence of Hsp70 inhibitor, plotted as % of DMSO control. Data are means ±s.d. (n=3). e, Virus production by plaque assays of cells infected with PV (MOI=0.1) in the presence or absence of Hsp70 inhibitors. Data are means ±s.d. (n=3). f, Eviction of nascent chain-associated complex (NAC) from polysomes during flavivirus infection is associated with increased binding of ER-resident factors. Line plots of the change over time in polysome association of NAC subunits (NACA and BTF3, blue) and ER resident factors with GOCC ER lumen annotation (pink). Data are means ±s.d. for NAC or median ±interquartile range for GOCC ER Lumen. Dotted gray line indicates time of translation shutoff. g, Cumulative fraction of polysome interactors with GOCC ER Part annotation. P, two-sided Mann Whitney U test p-value. h, Efficiency of KD in Huh7 cells based on qPCR using primers specific to the indicated transcripts, normalized to GAPDH. (n=2) i, Toxicity of indicated compounds at 36h. Data are means ±s.d. (n=3).
Extended data figure 9. Collagen prolyl hydroxylases facilitate infection of ZIKV and DENV.

a, Collagen-specific chaperone, but not collagens or an RNA-binding protein required for their translation, is recruited to polysomes by ZIKV and DENV. Line plots of the change over time in polysome association of collagen-specific chaperone (SERPINH1/Hsp47), all collagens identified by polysome MS, and collagen translation regulator RRBP1. Each line represents a single replicate of polysome MS timecourse. Dotted gray line indicates time of translation shutoff. b, Related to Figure 3c. Polysome profiles (top) and immunoblot analysis of gradient fractions treated with puromycin to label nascent chains (bottom). Results are representative of 2 independent repeats. c, P4HA1 co-sedimentation with ZIKV polysomes is disrupted by ribosome runoff. WT cells were infected with ZIKV (MOI=5) for 24h then treated with 20 μM harringtonine for 10 min followed by addition of 1 μM puromycin for another 10 min. Lysates were subjected to sucrose gradient fractionation and puromycin labeling. Shown are rRNA absorbance profiles (top) and immunoblots (bottom). Results are representative of 2 independent repeats. d, Efficiency of KD in Huh7 cells based on qPCR using primers specific to the indicated transcripts, normalized to GAPDH. (n=2). e-f, Timecourse of virus production by plaque assays in WT and cP4H-KD for ZIKV (e) and DENV (f) at MOI=0.1. (n=3) g, WT or cP4H-KD cells were infected with ZIKV at the indicated MOIs. 200 μM ascorbic acid (VitC) was added at the start of infection and again 12h later, and virus production at 24h was monitored using plaque assays. Data are means ±s.d. (n=3).
Extended data figure 10. Proline hydroxylation affects viral protein stability.
a, Multiple DENV prolines are hydroxylated co-translationally by cP4H. Bubble chart shows individual hydroxyproline sites, as detected by polysome MS in WT cells infected with DENV for 60h. Bubble size is proportional to posterior error probability (PEP) of hydroxyproline sites detected by MS. b, Loss of proline hydroxylation prevents full induction of translation shutoff by ZIKV infection. WT and cP4H-KD cells were infected with ZIKV (MOI=10) for 24h and metabolically labeled for 1h followed by autoradiography (left) and quantification (right). Data are means ±s.d. (n=4). P, two-tailed Student’s T test p-value. c-d, Proline hydroxylation stabilizes multiple viral proteins during infection. WT or cP4H-KD cells were infected with ZIKV (MOI=10) and MG132, CHX or MG132+CHX were added at 24h for additional 12h prior to immunoblot analysis (c). WT or cP4H-KD cells were infected with DENV (MOI=10) and MG132 was added at 36 for additional 12h prior to immunoblot analysis (d). Results are representative of 3 independent repeats. e, Lack of proline hydroxylation does not affect NS3 protease activity or NS1 protein stability/oligomerization. Strep-tagged ZIKV proteins were transfected into WT or cP4H-KD cells and analyzed by nonreducing immunoblot at 24h. Representative of 3 independent repeats. d, Proline hydroxylation reduces aggregation of ZIKV and DENV NS2B. Strep-tagged NS2B3 was transfected into WT and cP4H-KD cells and MG132 was added at 24h for additional 12h, prior to immunoblot analysis. Results are representative of 2 independent repeats.67
Supplementary Material
ACKNOWLEDGEMENTS
We thank the Rothschild-Yad Hanadiv Foundation, EMBO (ALTF 289-2015) and HFSP (LT000050-2016) to R.Av., NIH grants AI127447 to JF and NIH (R01, AI36178, AI40085, P01 AI091575) and the University of California (CCADD), and DoD-DARPA Prophecy to R.An.
Footnotes
DECLARATION OF INTERESTS
All authors declare no competing interests.
References
- 1.Kumar N et al. Host-Directed Antiviral Therapy. Clin. Microbiol. Rev 33, (2020). [DOI] [PMC free article] [PubMed] [Google Scholar]
- 2.Stern-Ginossar N, Thompson SR, Mathews MB & Mohr I Translational Control in Virus-Infected Cells. Cold Spring Harb. Perspect. Biol 11, (2019). [DOI] [PMC free article] [PubMed] [Google Scholar]
- 3.Nicholson BL & White KA Functional long-range RNA-RNA interactions in positive-strand RNA viruses. Nat. Rev. Microbiol 12, 493–504 (2014). [DOI] [PMC free article] [PubMed] [Google Scholar]
- 4.Aviner R & Frydman J Proteostasis in Viral Infection: Unfolding the Complex Virus-Chaperone Interplay. Cold Spring Harb. Perspect. Biol 12, (2020). [DOI] [PMC free article] [PubMed] [Google Scholar]
- 5.Jaafar ZA & Kieft JS Viral RNA structure-based strategies to manipulate translation. Nat. Rev. Microbiol 17, 110–123 (2019). [DOI] [PMC free article] [PubMed] [Google Scholar]
- 6.Mizuno CM et al. Numerous cultivated and uncultivated viruses encode ribosomal proteins. Nat. Commun 10, 752 (2019). [DOI] [PMC free article] [PubMed] [Google Scholar]
- 7.Macejak DG & Sarnow P Association of heat shock protein 70 with enterovirus capsid precursor P1 in infected human cells. J. Virol 66, 1520–7 (1992). [DOI] [PMC free article] [PubMed] [Google Scholar]
- 8.Yang W et al. G3BP1 inhibits RNA virus replication by positively regulating RIG-I-mediated cellular antiviral response. Cell Death Dis. 10, 946 (2019). [DOI] [PMC free article] [PubMed] [Google Scholar]
- 9.Limjindaporn T et al. Interaction of dengue virus envelope protein with endoplasmic reticulum-resident chaperones facilitates dengue virus production. Biochem. Biophys. Res. Commun 379, 196–200 (2009). [DOI] [PubMed] [Google Scholar]
- 10.Sweeney TR, Abaeva IS, Pestova TV & Hellen CUT The mechanism of translation initiation on Type 1 picornavirus IRESs. EMBO J. 33, 76–92 (2014). [DOI] [PMC free article] [PubMed] [Google Scholar]
- 11.Lee K-M, Chen C-J & Shih S-R Regulation Mechanisms of Viral IRES-Driven Translation. Trends Microbiol. 25, 546–561 (2017). [DOI] [PubMed] [Google Scholar]
- 12.Zhang Y, Gao W, Li J, Wu W & Jiu Y The Role of Host Cytoskeleton in Flavivirus Infection. Virol. Sin 34, 30–41 (2019). [DOI] [PMC free article] [PubMed] [Google Scholar]
- 13.Dougherty J, Tsai W-C & Lloyd R Multiple Poliovirus Proteins Repress Cytoplasmic RNA Granules. Viruses 7, 6127–6140 (2015). [DOI] [PMC free article] [PubMed] [Google Scholar]
- 14.Michalski D et al. Zika virus noncoding sfRNAs sequester multiple host-derived RNA-binding proteins and modulate mRNA decay and splicing during infection. J. Biol. Chem 294, 16282–16296 (2019). [DOI] [PMC free article] [PubMed] [Google Scholar]
- 15.Moon SL et al. Flavivirus sfRNA suppresses antiviral RNA interference in cultured cells and mosquitoes and directly interacts with the RNAi machinery. Virology 485, 322–9 (2015). [DOI] [PMC free article] [PubMed] [Google Scholar]
- 16.Ooi YS et al. An RNA-centric dissection of host complexes controlling flavivirus infection. Nat. Microbiol 4, 2369–2382 (2019). [DOI] [PMC free article] [PubMed] [Google Scholar]
- 17.Lenarcic EM, Landry DM, Greco TM, Cristea IM & Thompson SR Thiouracil cross-linking mass spectrometry: a cell-based method to identify host factors involved in viral amplification. J. Virol 87, 8697–712 (2013). [DOI] [PMC free article] [PubMed] [Google Scholar]
- 18.Pallarés HM et al. Zika Virus Subgenomic Flavivirus RNA Generation Requires Cooperativity between Duplicated RNA Structures That Are Essential for Productive Infection in Human Cells. J. Virol 94, (2020). [DOI] [PMC free article] [PubMed] [Google Scholar]
- 19.Zeng J et al. The Zika Virus Capsid Disrupts Corticogenesis by Suppressing Dicer Activity and miRNA Biogenesis. Cell Stem Cell 27, 618–632.e9 (2020). [DOI] [PMC free article] [PubMed] [Google Scholar]
- 20.Rodríguez Pulido M, Serrano P, Sáiz M & Martínez-Salas E Foot-and-mouth disease virus infection induces proteolytic cleavage of PTB, eIF3a,b, and PABP RNA-binding proteins. Virology 364, 466–474 (2007). [DOI] [PubMed] [Google Scholar]
- 21.Hunt SL, Hsuan JJ, Totty N & Jackson RJ unr, a cellular cytoplasmic RNA-binding protein with five cold-shock domains, is required for internal initiation of translation of human rhinovirus RNA. Genes Dev. 13, 437–48 (1999). [DOI] [PMC free article] [PubMed] [Google Scholar]
- 22.Andreev DE et al. Glycyl-tRNA synthetase specifically binds to the poliovirus IRES to activate translation initiation. Nucleic Acids Res. 40, 5602–14 (2012). [DOI] [PMC free article] [PubMed] [Google Scholar]
- 23.Iwasaki S, Floor SN & Ingolia NT Rocaglates convert DEAD-box protein eIF4A into a sequence-selective translational repressor. Nature 534, 558–61 (2016). [DOI] [PMC free article] [PubMed] [Google Scholar]
- 24.Li-Weber M Molecular mechanisms and anti-cancer aspects of the medicinal phytochemicals rocaglamides (=flavaglines). Int. J. Cancer 137, 1791–1799 (2015). [DOI] [PubMed] [Google Scholar]
- 25.Yang SNY et al. RK-33 Is a Broad-Spectrum Antiviral Agent That Targets DEAD-Box RNA Helicase DDX3X. Cells 9, 170 (2020). [DOI] [PMC free article] [PubMed] [Google Scholar]
- 26.Kramer G, Shiber A & Bukau B Mechanisms of Cotranslational Maturation of Newly Synthesized Proteins. Annu. Rev. Biochem 88, 337–364 (2019). [DOI] [PubMed] [Google Scholar]
- 27.Gamerdinger M, Hanebuth MA, Frickey T & Deuerling E The principle of antagonism ensures protein targeting specificity at the endoplasmic reticulum. Science 348, 201–7 (2015). [DOI] [PubMed] [Google Scholar]
- 28.Taguwa S et al. Zika Virus Dependence on Host Hsp70 Provides a Protective Strategy against Infection and Disease. Cell Rep. 26, 906–920.e3 (2019). [DOI] [PMC free article] [PubMed] [Google Scholar]
- 29.Taguwa S et al. Defining Hsp70 Subnetworks in Dengue Virus Replication Reveals Key Vulnerability in Flavivirus Infection. Cell 163, 1108–1123 (2015). [DOI] [PMC free article] [PubMed] [Google Scholar]
- 30.Kirk TZ, Evans JS & Veis A Biosynthesis of type I procollagen. Characterization of the distribution of chain sizes and extent of hydroxylation of polysome-associated pro-alpha-chains. J. Biol. Chem 262, 5540–5 (1987). [PubMed] [Google Scholar]
- 31.DiChiara AS et al. Mapping and Exploring the Collagen-I Proteostasis Network. ACS Chem. Biol 11, 1408–1421 (2016). [DOI] [PMC free article] [PubMed] [Google Scholar]
- 32.Ishikawa Y & Bächinger HP A molecular ensemble in the rER for procollagen maturation. Biochim. Biophys. Acta - Mol. Cell Res 1833, 2479–2491 (2013). [DOI] [PubMed] [Google Scholar]
- 33.Ueno T et al. Enhancement of procollagen biosynthesis by p180 through augmented ribosome association on the endoplasmic reticulum in response to stimulated secretion. J. Biol. Chem 285, 29941–50 (2010). [DOI] [PMC free article] [PubMed] [Google Scholar]
- 34.Li Y, Li Q, Wong YL, Liew LSY & Kang C Membrane topology of NS2B of dengue virus revealed by NMR spectroscopy. Biochim. Biophys. Acta - Biomembr 1848, 2244–2252 (2015). [DOI] [PubMed] [Google Scholar]
- 35.Bretscher LE, Jenkins CL, Taylor KM, DeRider ML & Raines RT Conformational Stability of Collagen Relies on a Stereoelectronic Effect. J. Am. Chem. Soc 123, 777–778 (2001). [DOI] [PubMed] [Google Scholar]
- 36.Naduthambi D & Zondlo NJ Stereoelectronic Tuning of the Structure and Stability of the Trp Cage Miniprotein. J. Am. Chem. Soc 128, 12430–12431 (2006). [DOI] [PubMed] [Google Scholar]
- 37.Guo J et al. pVHL suppresses kinase activity of Akt in a proline-hydroxylation-dependent manner. Science 353, 929–32 (2016). [DOI] [PMC free article] [PubMed] [Google Scholar]
- 38.Burrill CP, Strings VR & Andino R Poliovirus: generation, quantification, propagation, purification, and storage. Curr. Protoc. Microbiol. Chapter 15, Unit 15H.1 (2013). [DOI] [PMC free article] [PubMed] [Google Scholar]
- 39.Kinney RM et al. Construction of infectious cDNA clones for dengue 2 virus: strain 16681 and its attenuated vaccine derivative, strain PDK-53. Virology 230, 300–8 (1997). [DOI] [PubMed] [Google Scholar]
- 40.Cox J & Mann M MaxQuant enables high peptide identification rates, individualized p.p.b.-range mass accuracies and proteome-wide protein quantification. Nat. Biotechnol 26, 1367–72 (2008). [DOI] [PubMed] [Google Scholar]
- 41.Cox J et al. Andromeda: a peptide search engine integrated into the MaxQuant environment. J. Proteome Res 10, 1794–805 (2011). [DOI] [PubMed] [Google Scholar]
- 42.Shah PS et al. Comparative Flavivirus-Host Protein Interaction Mapping Reveals Mechanisms of Dengue and Zika Virus Pathogenesis. Cell 175, 1931–1945.e18 (2018). [DOI] [PMC free article] [PubMed] [Google Scholar]
- 43.Gamarnik AV & Andino R Switch from translation to RNA replication in a positive-stranded RNA virus. Genes Dev. 12, 2293–304 (1998). [DOI] [PMC free article] [PubMed] [Google Scholar]
- 44.Di Veroli GY et al. An automated fitting procedure and software for dose-response curves with multiphasic features. Sci. Rep 5, 14701 (2015). [DOI] [PMC free article] [PubMed] [Google Scholar]
- 45.Perez-Riverol Y et al. The PRIDE database and related tools and resources in 2019: improving support for quantification data. Nucleic Acids Res. 47, D442–D450 (2019). [DOI] [PMC free article] [PubMed] [Google Scholar]
- 46.Cox J & Mann M 1D and 2D annotation enrichment: a statistical method integrating quantitative proteomics with complementary high-throughput data. BMC Bioinformatics 13 Suppl 1, S12 (2012). [DOI] [PMC free article] [PubMed] [Google Scholar]
- 47.Imami K et al. Phosphorylation of the Ribosomal Protein RPL12/uL11 Affects Translation during Mitosis. Mol. Cell 72, 84–98.e9 (2018). [DOI] [PubMed] [Google Scholar]
- 48.Simsek D et al. The Mammalian Ribo-interactome Reveals Ribosome Functional Diversity and Heterogeneity. Cell 169, 1051–1065.e18 (2017). [DOI] [PMC free article] [PubMed] [Google Scholar]
- 49.Fontaine KA et al. The Cellular NMD Pathway Restricts Zika Virus Infection and Is Targeted by the Viral Capsid Protein. MBio 9, (2018). [DOI] [PMC free article] [PubMed] [Google Scholar]
- 50.Göertz GP et al. Subgenomic flavivirus RNA binds the mosquito DEAD/H-box helicase ME31B and determines Zika virus transmission by Aedes aegypti. Proc. Natl. Acad. Sci 116, 19136–19144 (2019). [DOI] [PMC free article] [PubMed] [Google Scholar]
- 51.Kanodia P et al. A rapid and simple quantitative method for specific detection of smaller coterminal RNA by PCR (DeSCo-PCR): application to the detection of viral subgenomic RNAs. RNA 26, 888–901 (2020). [DOI] [PMC free article] [PubMed] [Google Scholar]
- 52.Lloyd RE Nuclear proteins hijacked by mammalian cytoplasmic plus strand RNA viruses. Virology 479–480, 457–74 (2015). [DOI] [PMC free article] [PubMed] [Google Scholar]
- 53.Jagdeo JM et al. Heterogeneous Nuclear Ribonucleoprotein M Facilitates Enterovirus Infection. J. Virol 89, 7064–7078 (2015). [DOI] [PMC free article] [PubMed] [Google Scholar]
- 54.Gustin KE & Sarnow P Effects of poliovirus infection on nucleo-cytoplasmic trafficking and nuclear pore complex composition. EMBO J. 20, 240–9 (2001). [DOI] [PMC free article] [PubMed] [Google Scholar]
- 55.Silvera D, Gamarnik AV & Andino R The N-terminal K homology domain of the poly(rC)-binding protein is a major determinant for binding to the poliovirus 5’-untranslated region and acts as an inhibitor of viral translation. J. Biol. Chem 274, 38163–70 (1999). [DOI] [PubMed] [Google Scholar]
- 56.Dave P et al. Strand-specific affinity of host factor hnRNP C1/C2 guides positive to negative-strand ratio in Coxsackievirus B3 infection. RNA Biol. 16, 1286–1299 (2019). [DOI] [PMC free article] [PubMed] [Google Scholar]
Associated Data
This section collects any data citations, data availability statements, or supplementary materials included in this article.
Supplementary Materials
Data Availability Statement
The mass spectrometry proteomics data have been deposited to the ProteomeXchange Consortium via the PRIDE45 partner repository with the dataset identifier PXD024546.