Abstract
Colistin resistance has increased due to the increasing and inappropriate use of this antibiotic. The mechanism involves modification of lipid A with phosphoethanolamine (PEtN) and/or 4-amino-4deoxy-l-arabinose (L-Ara4N). EptA and eptB catalyze the transfer of phosphoethanolamine to lipid A. In this study, gene network was constructed to find the associated genes related to colistin resistance, and further in vitro validation by transcriptional analysis was performed. In silico studies showed that eptB gene is a highly interconnected node in colistin resistance gene network. To ascertain these findings twelve colistin-resistant clinical isolates of Escherichia coli were selected in which five were harboring the plasmid-mediated mcr-1. Screening for colistin resistance was performed by broth microdilution (BMD) method and Rapid polymyxin NP test. PCR confirmed the presence of the eptA and eptB genes in all isolates and five isolates were harboring mcr-1. Transcriptional expression in five isolates harboring mcr-1, showed an enhanced expression of eptB when exposed under sub-inhibitory colistin stress. The present study for the first time highlighted genetic interplay between mcr-1 and eptA and eptB under colistin exposure.
Subject terms: Antimicrobial resistance, Bacteriology
Introduction
Polymyxins such as polymyxin B and colistin (polymyxin E) are utilized as the last therapeutic option due to the emergence of multidrug-resistant bacteria mainly against carbapenem-resistant Gram-negative bacteria including Enterobacteriaceae1. Resistance to colistin has increased steadily due to the increasing and inappropriate use of this antibiotic2. The mechanism of colistin resistance in Gram-negative bacteria is associated with specific modification of lipid A with phosphoethanolamine (PEtN) and/or 4-amino-4deoxy-l-arabinose (L-Ara4N)3. The synthesis and addition of L-Ara4N to lipid A is stimulated by the arnBCADTEF operon. This operon is activated due to the mutation in the two-component systems (TCSs), mainly PhoPQ and PmrAB4. Representatives of PEtN transferases namely eptA and eptB are involved in the synthesis and addition of PEtN5. They are regulated by the PmrAB TCS, which itself can be upregulated by PhoPQ4. EptA catalyzes the transfer of PEtN from phosphatidylethanolamine (PE) onto the lipid A of Lipopolysaccharide (LPS) and eptB codes for Kdo (2)-lipid A phosphoethanolamine 7″-transferase which catalyzes the addition of a pEtN moiety to the outer 3-deoxy-d-manno-octulosonic acid (Kdo) residue of a Kdo (2)-lipid A. Phosphatidylethanolamines with one unsaturated acyl group functions as pEtN donors and the reaction releases diacylglycerol6. These LPS modifications reduced the negative charge of LPS thereby decreasing the affinity of LPS to positively charged colistin leading to resistance7. The plasmid-mediated PEtN transferase encoded colistin resistance gene, mcr-1, which is horizontally transferable was first described in China in 20158. Since then, different types of mcr genes namely mcr-1 to mcr-10 have been identified and reported from different parts of the world9.
Thus, it is of immense importance to understand the associated gene networks of these resistance determinants and how they respond when bacteria are exposed to colistin pressure. This study involves an in silico and in vitro investigation of eptA and eptB and their expressional pattern within E. coli co-harboring mcr-1.
Results
Protein–protein interaction (PPI) analysis
STRING database generated PPIN of eptA and eptB genes. The network generated from this interaction showed that gene eptA interacted with 39 functional partners in total, i.e. at medium, high, and highest confidence levels eptA gene interacted with 31, 6, and 2 functional partners respectively. Similarly, PPIN of eptB gene showed that eptB interacted with 41 functional partners i.e. at medium and high confidence level 37 and 4 functional partners were associated respectively. No interactions were found at highest level for eptB gene. These confidence levels indicated the likeliness of the interaction based on evidences mentioned above. Functional partners associated with eptA and eptB genes are depicted in Figs. 1 and 2.
Figure 1.
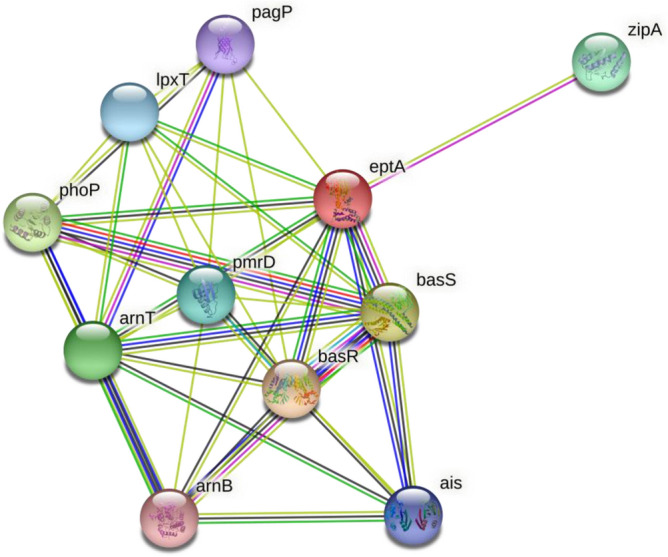
Functional partners associated with eptA.
Figure 2.
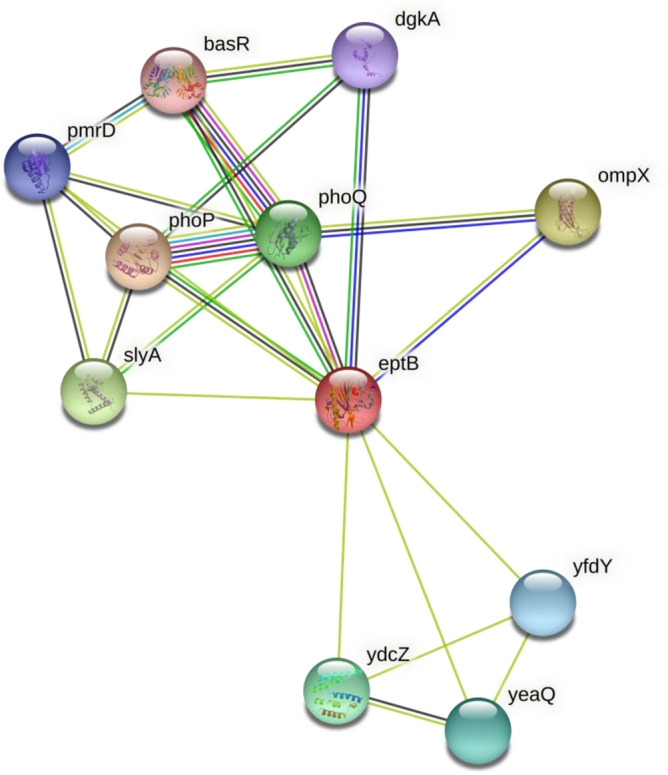
Functional partners associated with eptB.
Construction of gene network
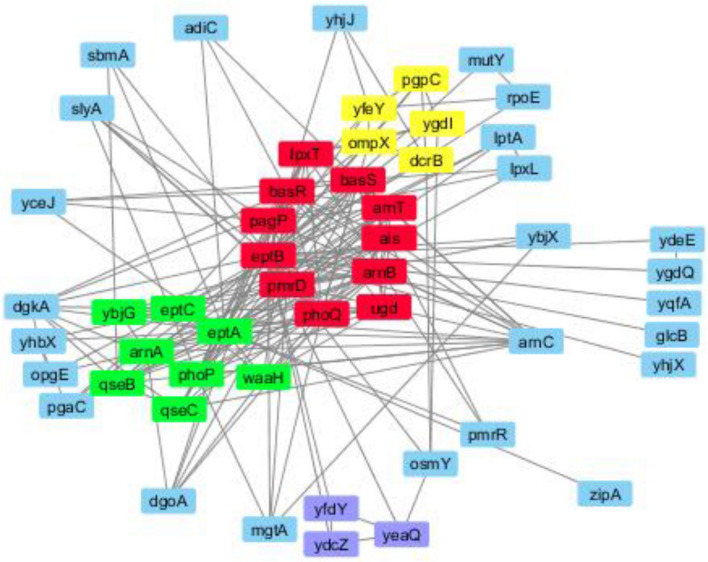
Incorporation of these PPIN onto Cytoscape v 3.4.0 generated a gene network of 52 nodes and 210 edges (interaction). Figure 3 shows the network of genes through which eptA and eptB genes interact to impart colistin resistance.
Figure 3.
Gene network through which eptA and eptB genes interact.
Analysis of cluster
Upon integration of PPIN into Cytoscape v 3.4.0, MCODE was employed for identifying the highly interconnected nodes. MCODE revealed 4 clusters with 27 nodes which were ranked based on the app’s algorithm. The rest of the nodes remained unclustered, hinting that they don’t have an active/influential role in imparting resistance. The cluster with the highest MCODE score had 11 nodes and 44 edges (Supplementary Fig. S1).
Analysis of topological parameter
Topological properties such as average shortest path length and betweenness centrality of all the functional partners participating in the network were measured for the identification of the most influential genes of the network. It was observed that the eptB gene from cluster 1 had a significant influence on the network (Supplementary Fig. S2).
Functional and pathway enrichment analysis
Functional and pathway enrichment analysis performed using STRING and ClueGO gave insights into the pathways associated with eptA and eptB. The significant terms associated with BP and MF (Molecular Functions) are depicted in Supplementary Fig. S3. In BP ontology, 4 enriched specific clusters with 36 GO terms were generated which were—lipopolysaccharide metabolic process (25 terms), intracellular signal transduction (13 terms), oligosaccharide biosynthetic process (14 terms), and response to iron ion (5 terms).
After analyzing the various properties of the selected genes involved with colistin resistance, it was found that the eptB gene from cluster 1 has a strong influence on the network owing to its high frequency in the network. Furthermore, eptB gene was found to be associated with 26 biological processes in the network which were part of the 3 major categories of the network-lipopolysaccharide metabolic process, intracellular signal transduction, oligosaccharide biosynthetic process. After all these analysis it is observed that eptB gene is a highly interconnected node (gene) of this network and can be predicted that this gene might play a crucial role in colistin resistance The processes and function with which the eptB gene is associated are given in Supplementary Table ST1.
Screening of colistin-resistant Escherichia coli
Broth microdilution method and polymyxin NP test confirmed twelve E. coli isolates to be screened positive for colistin resistance. Genotypic characterization by PCR analysis revealed the presence of eptA and eptB genes in all the E. coli isolates. The mcr-1 gene was found to be horizontally transferable and carried by FIA Inc group plasmid.
Plasmid elimination assay
Plasmids harboring colistin resistance determinants were successfully eliminated after a single treatment with sodium dodecyl sulfate (SDS; 4% to 10%).
Transcriptional analysis
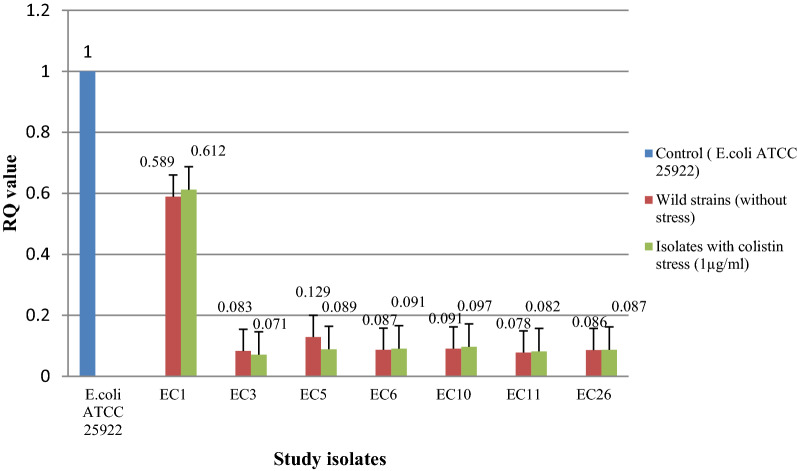
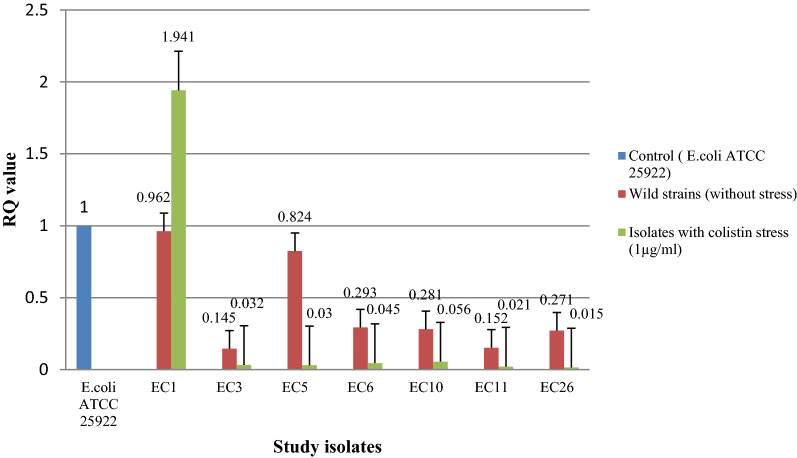
Transcriptional expression pattern in seven isolates (devoid of any mcr gene) did not show any change in expression of eptA and eptB with and without colistin stress (Figs. 4 and 5). However, the expression level [RQ (Relative quantification) value] was higher for both eptA and eptB in five isolates (EC2, EC4, EC17, EC34, and EC51) harboring mcr-1 i.e., an acquired pEtN gene. An enhanced expression was observed for these five isolates for both the genes when exposed under the sub-inhibitory concentration of colistin (Figs. 6 and 7) (Supplementary Table ST2). Similar pattern of expression was observed for all the transformants harboring mcr-1 gene (Supplementary Figs. S6 and S7). However, for cured mutants, colistin stress did not enhance expression of eptB significantly (Supplementary Figs. S4 and S5).
Figure 4.
Transcriptional analysis of eptA for mcr-1 negative isolates.
Figure 5.
Transcriptional analysis of eptB for mcr-1 negative isolates.
Figure 6.
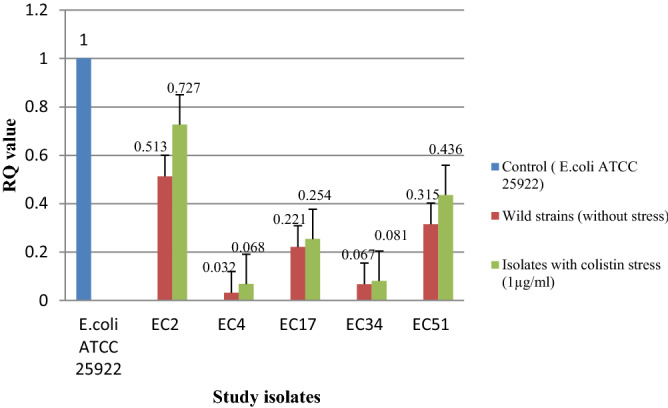
Transcriptional analysis of eptA for mcr-1 positive isolates.
Figure 7.
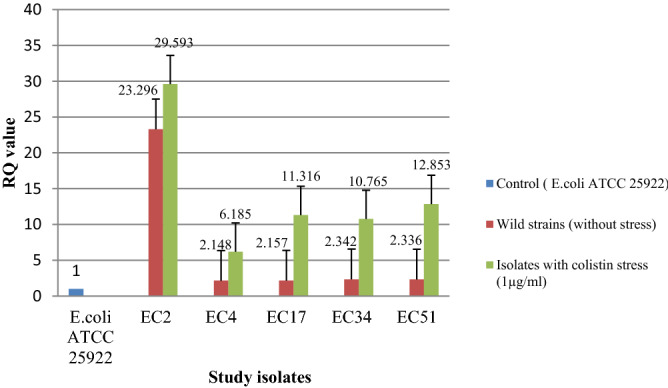
Transcriptional analysis of eptB for mcr-1 positive isolates.
Discussion
The extensive use of colistin in hospitals and also as a growth promoter in poultry, agriculture, etc. has led to increased resistance to this drug. Case reports and outbreaks have been reported from around the world10,11. In India, colistin resistance has been reported in various clinical isolates, environmental isolates, and also isolates from food samples11–13. The chromosomally encoded intrinsic resistance to colistin occurs naturally due to the expression of certain genes such as eptA and eptB and the transferable colistin resistance is mediated by plasmid-borne mcr genes14. EptB gene encodes Ca2+ induced pEtN which modifies the outer Kdo residue of E. coli LPS, thus leading to colistin resistance. However, extensive studies regarding this gene are lacking6. Therefore, this study was undertaken to understand the role of eptA and eptB in imparting colistin resistance.
In this study, the role played by eptA and eptB in imparting colistin resistance was studied following an in silico approach. Gene network constructed using Cytoscape software showed that the eptB gene was a highly interconnected node in colistin resistance gene network. Analyzing various parameters of the gene network it was found that this gene had higher frequency in the network and was also associated with 3 major biological processes, which included lipopolysaccharide metabolic process, intracellular signal transduction, and oligosaccharide biosynthetic process.
To further ascertain their role, transcriptional analysis of eptA and eptB gene in colistin-resistant E. coli was performed. An induced expression of eptB in the mcr-1 positive resistant isolates on exposure to colistin was observed. This could be related to the previous studies that showed the induced activation of chromosomally mediated colistin resistance genes like phoP, phoQ in the presence of colistin15,16. Another study from Spain mentioned the close link between the dgkA gene with mcr-1 and mcr-3. The same study found that the expression of mcr determinants downregulated endogenous genes involved in LPS modification or phospholipid recycling, although to different extents of repression: strong for arnB, ybjG, and pmrR; medium for eptA17. In our study, overexpression of eptB was observed in the isolates which harbor the mcr-1 gene while a lower expression level was observed in the isolates which were devoid of mcr-1. This finding showed that the presence of mcr-1 might augment the expression of the eptB gene in the presence of colistin thereby conferring resistance. Additionally, colistin stress can enhance expression of endogenous genes (eptA and eptB) when mcr-1 is present within an isolate. Although mcr-1 product alone can confer colistin resistance, other regulatory factors must be involved in triggering expression of eptA and eptB.
Therefore, we might consider that eptB plays a crucial role in mediating colistin resistance by the E. coli isolates. This study data revealed that eptB mediated mechanism of colistin resistance persists in the clinical E. coli isolates of this area and the association of mcr-1 in enhancing the expression of eptB in the presence of sub-inhibitory concentration of colistin pose a striking impact in the scenario of resistance mechanisms to colistin in clinical E. coli. Thus, the present study for the first time highlighted genetic interplay between mcr-1 and eptA and eptB under colistin exposure.
Materials and methods
Construction of protein–protein interaction network (PPIN)
To decipher the relationship between genes and proteins associated with eptA and eptB genes of E. coli protein–protein interaction network (PPIN) was studied using STRING (Search Tool for the Retrieval of Interacting Genes/ Proteins, v 11) database and the results were incorporated into Cytoscape v3.4.0 software. The database generated a network by integrating known and predicted associations based on multiple evidences which were individually scored and color-coded. This evidence included interactions obtained by curating databases, text mining from scientific publications, and high and low throughput experiment assays. Protein identifier or protein sequence was required as query input and functional partners associated with the genes under consideration were generated based on the evidence at four confidence scores—highest (0.900), high (0.700), medium (0.400), and low (0.150)18.
Construction of gene network
Cytoscape v 3.4.0, an open-source software package, was used for the visualization of the gene network. The software considers various parameters and helps in the visualization, modeling, and analysis of gene networks19.
Analysis of strongly associated cluster
To identify the highly interconnected regions i.e. clusters of the network, the MCODE (Molecular Complex Detection) app from Cytoscape software was employed. Clusters were scored and ranked based on an algorithm that stressed identified the locally dense regions of the network. Parameters like degree cutoff = 2, node score cutoff = 0.2, k-core = 2 and max. depth = 100 were set as cut-off20.
Analysis of topological parameters
Network Analyzer plugin of Cytoscape software was utilized for analysis of topological parameters that gave insights into small-world effect by considering properties such as average shortest path length and betweenness centrality. Betweenness centrality calculates the frequency of occurrence of a node (gene) through the shortest paths in a network, thus indicating the centrality of the node. The average shortest path length, on the other hand, estimates the shortest distance between the nodes21.
Functional and pathway enrichment analysis
Functional enrichment analysis done using STRING v 11 and ClueGO app of Cytoscape gave gene ontological (GO) annotations of the genes involved in the network. GO terms for BP (Biological Processes) were generated based on a p-value cut-off ≤ of 0.05 for the functional partners18,22.
Clinical isolates
A total of 291 consecutive, non-duplicate E. coli isolates were obtained from the Department of Microbiology, Silchar Medical College and Hospital (SMCH), Silchar. Twelve colistin-resistant E. coli isolates were selected for the study in which five among them were harboring mcr-1. The organisms were identified using VITEK® 2 compact system (Biomeriux, USA). E. coli ATCC 25922 was used as a control.
Screening of the isolates
The isolates were screened for colistin resistance by performing broth microdilution (BMD) method using colistin (Hi-Media, Mumbai, India) with a range from 2 to 4 μg/ml and the results were interpreted as per EUCAST guidelines 201723. Additionally, Rapid polymyxin NP tests were also performed by using a defined concentration (5ug/ml) of colistin to further screen colistin resistance among the test isolates24.
Horizontal transferability of colistin resistance
Purification of the plasmids of mcr-1 positive isolates was carried out by QIAprep Spin Miniprep Kit (Qiagen, Germany) and transformation was performed by heat shock method with E. coli DH5α as a recipient. The transformants were chosen on Luria Bertani agar (Hi‐Media, Mumbai, India) containing 2 µg/ml colistin. Further, validation was done both by phenotypic and by PCR analysis.
Plasmid incompatibility typing by PCR based replicon typing
PCR based replicon typing of the plasmids carrying mcr-1 gene was performed for the identification of their incompatibility (Inc) types. Eighteen different replicon types such as FIA, FIB, FIC, HI1, HI2, I1/Iγ, L/M, N, P, W, T, A/C, K, B/O, X, Y, F, and FIIA were used25.
Molecular characterization
Genotypic characterization was done for the screened positive isolates targeting eptA and eptB genes. Amplification for eptA and eptB genes was done by performing a PCR assay using specific oligonucleotide primers (Supplementary Table ST3). The conditions used were initial denaturation at 94 °C for 3 min followed by 35 cycles of denaturation at 94 °C for 40 s, annealing at 50 °C for 30 s, extension at 72 °C for 50 s and final extension at 72 °C for 7 min.
Plasmid elimination assay
Plasmid elimination assay was performed for 5 isolates harboring mcr-1 (EC2, EC4, EC17, EC34, and EC51) in Luria–Bertani broth. The isolates were treated with sodium dodecyl sulfate (SDS) in which 2%, 4%, 6%, 8%, and 10% of SDS was added to 5 ml of LB broth, which was then inoculated with 50 µl of a bacterial suspension and kept in a shaker incubator at 37 °C for overnight incubation26 and 30 µl of the bacterial suspension was grown on LB agar with and without colistin. Elimination of the plasmid was estimated by calculating the number of cells grown on medium with and without colistin. Colistin resistance was used as the selective marker for plasmid curing analysis. Further, PCR analysis was performed to check whether mcr-1 gene was eliminated from the parent types.
Transcriptional analysis
Expression of eptA and eptB genes was determined by quantitative real-time PCR (Applied Biosystem, USA). Oligonucleotides specific for the respective genes were used (Supplementary Table ST3). E. coli ATCC 25922 was used as a reference strain. All the isolates, cured mutants of mcr-1 harboring isolates, and transformants were inoculated in 5 ml Luria Bertani broth (Hi-media, Mumbai, India) containing 1 μg/ml of colistin and also in media without antibiotic pressure and incubated in a shaker incubator (160 rpm) at 37 ℃ for 12–16 h. Mid-log phase bacterial cultures at OD600 (OD value 0.4–0.5) were used for the experiment. Total mRNA was extracted by using RNeasy mini kit (Qiagen, Hilden, Germany) following the manufacturer’s instructions and reverse-transcribed into cDNA by using QuantiTect® Reverse Transcription kit (Qiagen, Hilden, Germany). Quantification of eptA and eptB transcripts was performed by Picodrop (Pico 200, Cambridge, UK) and real-time PCR was performed using Power Sybr Green Master Mix (Applied Biosystem, Warrington, UK) using Step One Plus real-time detection system (Applied Biosystem, USA), and the expression level of the housekeeping gene rpsL of E. coli was used to normalize the transcriptional levels of the target genes. Further, the threshold cycle (ΔΔCt) method was employed to calculate the fold-changes in the expression of eptA and eptB in two different conditions27.
Supplementary Information
Acknowledgements
The authors would like to acknowledge Head, Department of Microbiology, Assam University and Assam University Biotech Hub, for providing the infrastructural facility.
Author contributions
R.E.: design and performed the experimental work, literature search, data collection, analysis and prepared the manuscript. S.B.: performed the in silico experimental work. B.K.: participated in analysis and manuscript preparation. J.W.: participated in experiment and analysis. M.D.C.: participated in in silico experiment designing and manuscript correction. D.D.: participated in study designing and analysis. A.B.: supervised the research work and participated in designing the study and checking and finalizing the manuscript. All authors read and approved the final manuscript.
Data availability
The data that support the findings of this study are available from the corresponding author upon reasonable request.
Competing interests
The authors declare no competing interests.
Footnotes
Publisher's note
Springer Nature remains neutral with regard to jurisdictional claims in published maps and institutional affiliations.
Supplementary Information
The online version contains supplementary material available at 10.1038/s41598-022-05435-0.
References
- 1.Stogios PJ, et al. Substrate recognition by a colistin resistance enzyme from Moraxella catarrhalis. ACS Chem. Biol. 2018;13:1322–1332. doi: 10.1021/acschembio.8b00116. [DOI] [PMC free article] [PubMed] [Google Scholar]
- 2.Potron A, Vuillemenot JB, Puja H, Triponne P. ISAba1-dependent overexpression of eptA in clinical strains of Acinetobacter baumannii resistant to colistin. Antimicrob. Chemother. 2019;74:2544–2550. doi: 10.1093/jac/dkz241. [DOI] [PubMed] [Google Scholar]
- 3.Kim S, et al. Characterization of chromosome-mediated colistin resistance in Escherichia coli isolates from livestock in Korea. Infect. Drug Resist. 2019;12:3291–3299. doi: 10.2147/IDR.S225383. [DOI] [PMC free article] [PubMed] [Google Scholar]
- 4.Baron S, Hadjadj L, Rolain JM, Olaitan AO. Molecular mechanisms of polymyxin resistance: knowns and unknowns. Int. J. Antimicrob. Agents. 2016;48:583–591. doi: 10.1016/j.ijantimicag.2016.06.023. [DOI] [PubMed] [Google Scholar]
- 5.Choi Y, et al. Comparison of fitness cost and virulence in chromosome- and plasmid-mediated colistin-resistant Escherichia coli. Front. Microbiol. 2020;11:798. doi: 10.3389/fmicb.2020.00798. [DOI] [PMC free article] [PubMed] [Google Scholar]
- 6.Reynolds CM, Kalb SR, Cotter RJ, Raetz CRH. A Phosphoethanolamine transferase specific for the outer 3-deoxy-d-manno-octulosonic acid residue of Escherichia coli lipopolysaccharide, identification of the eptB gene and Ca2+ HYPERSENSITIVITY of an eptB deletion mutant. J. Biol. Chem. 2005;280:21202–21211. doi: 10.1074/jbc.M500964200. [DOI] [PubMed] [Google Scholar]
- 7.Jayol A, Nordmann P, Brink A, Poirel L. Heteroresistance to colistin in Klebsiella pneumoniae associated with alterations in the PhoPQ regulatory system. Antimicrob. Agents Chemother. 2015;59:2780–2784. doi: 10.1128/AAC.05055-14. [DOI] [PMC free article] [PubMed] [Google Scholar]
- 8.Liu Y-Y, et al. Emergence of plasmid-mediated colistin resistance mechanism MCR-1 in animals and human beings in China: A microbiological and molecular biological study. Lancet Infect. Dis. 2016;16:161–168. doi: 10.1016/S1473-3099(15)00424-7. [DOI] [PubMed] [Google Scholar]
- 9.Lei CW, Zhang Y, Wang YT, Wang HN. Detection of mobile colistin resistance gene mcr-10.1 in a conjugative plasmid from Enterobacter roggenkampii of chicken origin in China. Antimicrob. Agents Chemother. 2020;64:01191. doi: 10.1128/AAC.01191-20. [DOI] [PMC free article] [PubMed] [Google Scholar]
- 10.Aggarwal R, et al. Colistin-resistant Klebsiella pneumoniae in surgical polytrauma intensive Care unit of level-1 trauma center: First case series from trauma patients in India. Indian J. Crit. Care Med. 2018;22:2. doi: 10.4103/ijccm.IJCCM_430_17. [DOI] [PMC free article] [PubMed] [Google Scholar]
- 11.Ghafur A, Shankar C, Soundaria PG, et al. Detection of chromosomal and plasmid-mediated mechanisms of colistin resistance in Escherichia coli and Klebsiella pneumoniae from Indian food samples. J. Glob. Antimicrob. Resist. 2019;16:48–52. doi: 10.1016/j.jgar.2018.09.005. [DOI] [PubMed] [Google Scholar]
- 12.Manohar P, Shanthini T, Ayyanar R, et al. The distribution of carbapenem- and colistin-resistance in Gram-negative bacteria from the Tamil Nadu region in India. J. Med. Microbiol. 2017;66:874–883. doi: 10.1099/jmm.0.000508. [DOI] [PubMed] [Google Scholar]
- 13.Bardhan T, Chakraborty M, Bhattacharjee B. Prevalence of colistin-resistant, carbapenem-hydrolyzing proteobacteria in hospital water bodies and out-falls of West Bengal, India. Int. J. Environ. Res. Public Health. 2020;17:1007. doi: 10.3390/ijerph17031007. [DOI] [PMC free article] [PubMed] [Google Scholar]
- 14.Xu Y, Wei W, Lei S, et al. An evolutionarily conserved mechanism for intrinsic and transferable polymyxin resistance. Am. Soc. Microbiol. 2018;9:02317–2417. doi: 10.1128/mBio.02317-17. [DOI] [PMC free article] [PubMed] [Google Scholar]
- 15.Gunn JS, Miller SI. PhoP-PhoQ activates transcription of pmrAB, encoding a two-component regulatory system involved in Salmonella typhimurium antimicrobial peptide resistance. J. Bacteriol. 1996;178:6857–6864. doi: 10.1128/jb.178.23.6857-6864.1996. [DOI] [PMC free article] [PubMed] [Google Scholar]
- 16.Moskowitz SM, Ernst RK, Miller SI. PmrAB, a two-component regulatory system of Pseudomonas aeruginosa that modulates resistance to cationic antimicrobial peptides and addition of aminoarabinose to lipid A. J. Bacteriol. 2004;186:575–579. doi: 10.1128/JB.186.2.575-579.2004. [DOI] [PMC free article] [PubMed] [Google Scholar]
- 17.Vijayakumar S, Jacob JJ, Vasudevan K, Shankar BA, et al. Colistin resistance in Acinetobacter baumannii is driven by multiple genomic traits: Evaluating the role of ISAba1-driven eptA overexpression among Indian isolates. BioRxiv. 2021 doi: 10.1101/2021.01.07.425695. [DOI] [Google Scholar]
- 18.Szklarczyk D, et al. The STRING database in 2017: quality-controlled protein–protein association networks, made broadly accessible. Nucleic Acids Res. 2017;45(D1):D362–D368. doi: 10.1093/nar/gkw937. [DOI] [PMC free article] [PubMed] [Google Scholar]
- 19.Shannon P, et al. Cytoscape: A software environment for integrated models of biomolecular interaction networks. Genome Res. 2003;13:2498–2504. doi: 10.1101/gr.1239303. [DOI] [PMC free article] [PubMed] [Google Scholar]
- 20.Bader GD, Hogue CW. An automated method for finding molecular complexes in large protein interaction networks. BMC Bioinform. 2003;4:2. doi: 10.1186/1471-2105-4-2. [DOI] [PMC free article] [PubMed] [Google Scholar]
- 21.Yoon J, Blumer A, Lee K. An algorithm for modularity analysis of directed and weighted biological networks based on edge-betweenness centrality. Bioinformatics. 2006;22:3106–3108. doi: 10.1093/bioinformatics/btl533. [DOI] [PubMed] [Google Scholar]
- 22.Bindea G, et al. ClueGO: A Cytoscape plug-in to decipher functionally grouped gene ontology and pathway annotation networks. Bioinformatics. 2009;25:1091–1093. doi: 10.1093/bioinformatics/btp101. [DOI] [PMC free article] [PubMed] [Google Scholar]
- 23.The European Committee on Antimicrobial Susceptibility Testing. Breakpoint tables for interpretation of MICs and zone diameters. Version 7.0 http://www.eucast.org (2017).
- 24.Nordmann P, Jayol A, Poirel L. Rapid detection of polymyxin resistance in enterobacteriaceae. Emerg. Infect. Dis. 2016;22:6. doi: 10.3201/eid2206.151840. [DOI] [PMC free article] [PubMed] [Google Scholar]
- 25.Carattoli A, Bertini A, Villa L, Falbo V, Hopkins KL, Threlfall EJ. Identification of plasmids PCR-based replicon typing. J. Microbiol. Methods. 2005;63:219–228. doi: 10.1016/j.mimet.2005.03.018. [DOI] [PubMed] [Google Scholar]
- 26.El-Mansi M, Anderson KJ, Inche CA, Knowles LK, Platt DJ. Isolation and curing of the Klebsiella pneumoniae large indigenous plasmid using sodium dodecyl sulphate. Res. Microbiol. 2000;151:201–208. doi: 10.1016/S0923-2508(00)00140-6. [DOI] [PubMed] [Google Scholar]
- 27.Swick MC, Morgan-Linnell SK, Carlson KM, Zechiedrich L. Expression of multidrug efflux pump genes acrab-tolC, mdfA and norE in Escherichia coli clinical isolates as a function of fluoroquinolone and multidrug resistance. Antimicrob. Agents Chemother. 2011;55:921–924. doi: 10.1128/AAC.00996-10. [DOI] [PMC free article] [PubMed] [Google Scholar]
Associated Data
This section collects any data citations, data availability statements, or supplementary materials included in this article.
Supplementary Materials
Data Availability Statement
The data that support the findings of this study are available from the corresponding author upon reasonable request.


