

Abstract
Background
Osteoporotic vertebral compression fractures (OVCF) are common among the elderly, and malnutrition has also been identified as a poor prognostic factor in elderly patients with fractures. However, the relationship between nutrition status and functional prognosis in OVCF is unclear. The aim of this study was to investigate the association between nutritional status using geriatric nutritional risk index (GNRI), activities of daily living (ADL), and fall after fracture in patients with OVCF.
Methods
The clinical information of 187 conservatively treated OVCF patients was retrospectively examined. This information included: age, sex, body mass index, total number of drugs used for treatment at admission, bone mineral density, use of drugs for osteoporosis, fracture type, comorbidity severity, nutritional status, Barthel Index (BI), and fall after OVCF. Subjects were divided into two groups according to their GNRI. Propensity score matching was used to confirm factors affecting BI and falls after OVCF.
Results
Sixty-eight patients (36.4%) presented with malnutrition at fracture. According to multiple linear regression analysis, GNRI positively affected BI gain (β = 0.283, 95% confidence interval [CI] − 122.2 to − 0.706, p = 0.001). Furthermore, on logistic regression analysis, fall after OVCF was associated with GNRI (odds ratio = 0.896, 95% CI 0.832–0.964, p = 0.003).
Conclusions
Malnutrition in elderly OVCF patients decreases the acquisition of ADL and increases fall risk. Improvement of nutritional status during OVCF treatment may lead to improvement of ADL and prevention of falls.
Keywords: Osteoporotic vertebral compression fracture, Nutrition status, Activities of daily living, Falls
Introduction
The prevalence of osteoporotic vertebral compression fracture (OVCF) is increasing in an aging society [1]. OVCF is also common in Japan, with approximately 2 million cases of OVCF occurring annually [2]. It causes severe pain and disability, and raises the risk of secondary fracture [3, 4]. In addition, pain and muscle weakness cause a decline in the activities of daily living (ADL) and quality of life (QoL) of the elderly [5–7]. Kim et al. [8] described paraspinal muscle changes in OVCF, suggesting a reduction in muscle mass in patients with OVCF, and a 22.7–43.7% prevalence of sarcopenia in these patients, which is higher than that of other orthopedic disorders [9–11]. Several reports have described the relationship between sarcopenia and nutritional status, suggesting that nutritional intervention is necessary to improve muscle strength [12, 13]. It was also revealed that the prevalence of sarcopenia is substantial in most geriatric settings, and well-designed studies evaluating exercise or nutritional interventions are needed before treatment guidelines can be developed. Wakabayashi et al. [14] demonstrated that nutritional management is important for rehabilitation, and it has been reported that the combination of rehabilitation and nutritional management improves ADL and QoL. Thus, nutrition status in elderly patients has a potential influence on the outcomes of OVCF. Takahashi et al. [15] described the relationship between sarcopenia and malnutrition in OVCF. It is said that sarcopenia and undernutrition reduced ADL. However, despite the need for nutrition management in OVCF, albumin and the geriatric nutritional risk index (GNRI) have not been reported for nutritional assessment. Furthermore, no association was reported between nutritional status and fall risk or functional prognosis in OVCF.
It was hypothesized that there is an association between nutritional status, fall risk, and impact on ADL after OVCF. Further, this study examined the relationship between GNRI nutrition status and functional prognosis in OVCF.
Materials and Methods
Study Design and Participants
A retrospective examination was conducted on the clinical information of 187 patients aged 65 years or older with OVCF treated conservatively who underwent rehabilitation between October 2014 and April 2020. All patients had a primary fracture and were followed for at least 6 months after injury. Those with pre-existing fractures and who underwent surgical treatment were excluded. Further, patients with multiple vertebral fractures, cognitive impairment, and missing data including bone density that cannot be accurately measured after spine surgery were also excluded. The sample size was calculated using t test, and 180 samples were calculated using a difference to be detected of 10, a standard deviation of 25.35, a significance level of 0.05, and a power of 0.8 [15].
All patients were treated with pain control and rehabilitation while wearing a corset. Rehabilitation began with relaxation, range of motion exercise, and resistance training at the bedside. Sitting, standing, and walking exercises started with the corset on, depending on the pain. The study protocol was approved by our institutional ethics committee (approval number: 20201201). Informed consent was obtained from all patients.
Data Collection
Patients’ clinical information included age, sex, body mass index (BMI), total number of drugs used for treatment at admission, bone mineral density (BMD), use of drugs for osteoporosis, fracture type, serum albumin level, comorbidity severity, nutritional status, functional capacity, and falls during follow-up periods.
Outcome Measurements
The primary outcomes were functional capacity and nutritional status. The secondary outcome was the risk of fall during follow-up periods. Patient functional capacity to perform ADL was evaluated by the Barthel Index (BI), specifically BI gain, the change in total BI from the first rehabilitation to the end of follow-up. The BI is an assessment of ten items: eating, moving, dressing, toilet movement, bathing, walking, going up and down stairs, changing clothes, defecation, and urination. The total score is 100 points, and each movement is evaluated by 5–15 points. The higher the score, the higher is the function.
Nutritional status was evaluated using the geriatric nutritional risk index (GNRI), calculated using the formula proposed by Bouillanne et al. [16].
14.89 × serum albumin (g/dL) + {41.7 × (current/ideal body weight)}.
Okamoto et al. defined GNRI less than 92 as malnutrition and GNRI more than 92 as normal. This study also defined GNRI of 92 or less as malnutrition and GNRI of 92 or more as normal group with mild or no risk of malnutrition [17].
BMD was measured using dual-energy X-ray absorptiometry (DXA) at the lumbar spine (L1–4).
Fracture type was classified using the semi-quantitative (SQ) method proposed by Genant et al. [18]. The SQ method classifies patients into grades ranging from 0 to 3, with vertebral fractures diagnosed when the grade is 1 or higher. Comorbidity was assessed using the Charlson Comorbidity Index (CCI), which is an indicator of multi-disease comorbidities and includes diabetes with chronic complications, heart failure, kidney disease, liver disease, chronic lung disease, dementia, hemiplegia or paraplegia, malignancy, and AIDS/HIV [19]. Functional evaluation of the lumbar spine was measured using the patient’s Japanese Orthopaedic Association (JOA) score [20]. The JOA score is useful to evaluate the severity of symptoms in clinical practice, it has become the standard assessment tool for lumbar spine disease.
Regarding the measurement of outcomes, the primary outcome considered was the occurrence of fall during follow-up periods, and the secondary outcome considered was BI gain.
Statistical Analysis
For statistical analysis, the patients were divided into two groups: the malnutrition group and the normal group. The unpaired t test, Mann–Whitney’s U test, and χ2 test were used to perform comparisons between groups depending on variables assessed and the normality of data. In addition, propensity score matching was carried out. Propensity scores were calculated using age, sex, CCI, and fracture type. Variance inflation factor (VIF) was calculated as an index of multicollinearity, and items with VIF values of 2 or less were used as independent variables. Spearman’s rank correlation was used for the univariate analysis. A multiple linear regression analysis after propensity score matching was performed to assess BI gain, and multiple logistic regression analysis was carried out for the incidence of fall during follow-up periods. Variables were independently associated with GNRI. Data were analyzed using SPSS version 25 (IBM Corporation; Armonk, NY, USA).
Results
The study involved an assessment of 187 of 211 patients with OVCF diagnosed and treated conservatively between October 2014 and April 2020, excluding 5 with multiple vertebral fractures, 10 with cognitive impairment, and 9 with missing data (Fig. 1). Patient characteristics are shown in Table 1. Sixty-eight patients (36.4%) were in the malnutrition group. The malnutrition group had lower BMI, serum albumin, BMD and BI score at the end of follow-up, JOA score at the end of follow-up, and BI gain (p < 0.001), and a higher number of falls during follow-up periods (p = 0.002) than the normal group.
Fig. 1.
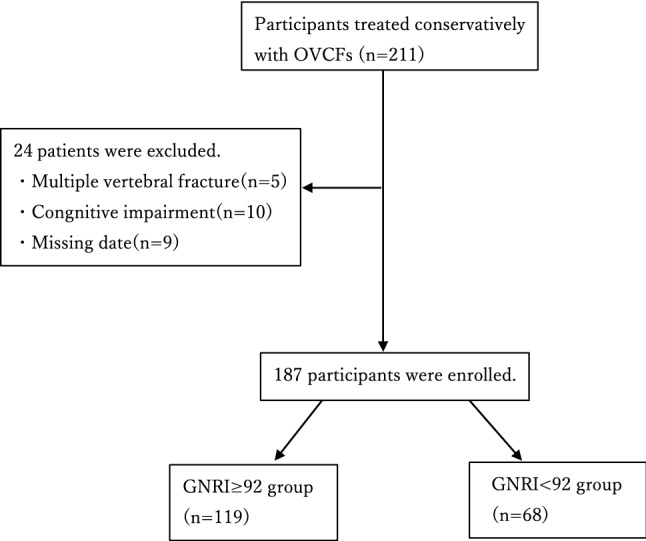
Flowchart of patient selection
Table 1.
Patient characteristics
| All (n = 187) | GNRI ≥ 92 (n = 119) | GNRI < 92 (n = 68) | p value | |
|---|---|---|---|---|
| Age (year) | 81.1 ± 8.0 | 81.0 ± 7.3 | 81.4 ± 9.0 | 0.752(1) |
| Sex, female, N (%) | 116 (62.0) | 75(63.0) | 41(60.3) | 0.711(2) |
| Fracture type | 0.781(2) | |||
| Grade I | 61 (32.6) | 37 (31.1) | 24 (6.5) | |
| Grade II | 97 (51.9) | 64 (35.4) | 33 (38.7) | |
| Grade III | 29 (15.5) | 18 (59.1) | 11 (54.8) | |
| BMI (kg/m2) | 21.8 ± 3.13 | 23.1 ± 2.82 | 19.6 ± 2.43 | < 0.001(1) |
| Serum albumin (g/dl) | 3.60 ± 0.46 | 3.81 ± 0.33 | 3.21 ± 0.41 | < 0.001(1) |
| Admission GNRI | 94.9 ± 9.80 | 100.5 ± 6.53 | 85.0 ± 6.02 | < 0.001(1) |
| BMD (g/cm2) | 0.88 ± 0.12 | 0.91 ± 0.11 | 0.82 ± 0.12 | < 0.001(1) |
| CCI | 1 (0–6) | 1 (0–5) | 1 (0–6) | 0.176(2) |
| Total number of drugs administered on admission | 7 (0–23) | 7 (0–14) | 7(0–23) | 0.816(1) |
| Use of drugs for osteoporosis, N (%) | 45 (24.1) | 31 (26.1) | 14 (20.6) | 0.567(2) |
| Barthel Index | ||||
| First rehabilitation | 37.9 ± 11.6 | 37.8 ± 11.6 | 38.2 ± 11.6 | 0.844(1) |
| At the end of follow-up | 76.7 ± 12.2 | 80.2 ± 11.3 | 70.5 ± 11.2 | < 0.001(1) |
| Barthel Index gain | 38.7 ± 13.5 | 42.4 ± 12.0 | 32.4 ± 13.5 | < 0.0011) |
| JOA score | ||||
| First rehabilitation | 7.6 ± 1.4 | 7.8 ± 1.4 | 7.3 ± 1.5 | 0.043(1) |
| At the end of follow-up | 20.5 ± 3.9 | 22.3 ± 2.8 | 17.3 ± 3.5 | < 0.001(1) |
| The period from fracture to admission (day) | 1.7 ± 0.4 | 1.8 ± 0.7 | 1.7 ± 0.9 | 0.843(1) |
| Fall during follow-up periods, N (%) | 15 (9.2) | 4 (4.5) | 11 (38.7) | 0.002(2) |
Value are presented as mean ± standard, deviation or number(%) or median (interquartile range).
GNRI geriatric nutritional risk indexes, BMI body mass index, CCI Charlson Comorbidity Index, BI Barthel Index
(1) Student’s t test
(2) Chi-squared test
Spearman’s rank correlation results are shown in Table 2. GNRI was positively correlated with serum albumin, BI gain, BMD and JOA score at the end of follow-up. GNRI and falls during follow-up periods were negatively correlated. There was a negative correlation between age and BI at first rehabilitation. The correlation of falls during follow-up periods showed negative correlation with GNRI, serum albumin, JOA score at the end of follow-up, and positive correlation with total number of drugs on admission.
Table 2.
Spearman rank correlation coefficients among the factors
| Age | BMI | GNRI | Serum albumin | Total number of drugs on admission | CCI | BMD | BI gain | JOA score first | JOA score last | Fall during follow-up periods | |
|---|---|---|---|---|---|---|---|---|---|---|---|
| Age | 1 | − 0.075 | − 0.083 | − 0.110 | 0.030 | 0.149* | − 0.073 | 0.024 | − 0.024 | − 0.039 | 0.129 |
| BMI | − 0.075 | 1 | 0.667 | 0.162 | 0.028 | 0.015 | 0.211** | 0.206** | 0.088 | 0.334** | − 0.056 |
| GNRI | − 0.083 | 0.667** | 1 | 0.804** | − 0.074 | − 0.088 | 0.270** | 0.300** | 0.147* | 0.532** | − 0.191** |
| Serum albumin | − 0.110 | 0.162* | 0.804** | 1 | − 0.120 | − 0.112 | 0.204** | 0.267** | 0.137 | 0.460** | − 0.282** |
| Total number of drugs on admission | 0.030 | 0.028 | − 0.074 | − 0.120 | 1 | 0.540** | − 0.042 | − 0.125 | 0.064 | − 0.151* | 0.243** |
| CCI | 0.149* | 0.015 | − 0.088 | − 0.112 | 0.540** | 1 | − 0.040 | − 0.080 | 0.128 | − 0.122 | 0.114 |
| BMD | − 0.073 | 0.211** | 0.270** | 0.204** | 0.042 | − 0.040 | 1 | 0.236** | 0.126 | 0.241** | − 0112 |
| BI gain | 0.024 | 0.206** | 0.300** | 0.267** | − 0.125 | − 0.080 | 0.236** | 1 | 0.084 | 0.251** | − 0.120 |
| JOA score first | − 0.024 | 0.088 | 0.147* | 0.137 | 0.064 | 0.128 | 0.126 | 0.084 | 1 | 0.115 | − 0.092 |
| JOA score last | − 0.039 | 0.334** | 0.532** | 0.460** | − 0.151* | − 0.122 | 0.241** | 0.251** | 0.115 | 1 | − 0.414** |
| Fall during follow-up periods | 0.129 | − 0.056 | − 0.191** | − 0.282** | 0.243** | 0.114 | − 0.112 | − 0.120 | − 0.092 | − 0.414** | 1 |
BMI body mass index, BMD bone mineral density, GNRI geriatric nutritional risk indexes, CCI Charlson Comorbidity Index, BI Barthel Index
*p < 0.05
**p < 0.01
Results of the multivariate analysis of BI gain after propensity score matching are shown in Table 3. GNRI positively affected the BI gain (β = 0.283, 95% confidence interval [CI] − 122.2 to − 0.706, p = 0.001). The results of the logistic regression analysis after propensity score matching are shown in Table 4. The incidence of fall during follow-up periods was correlated with GNRI (odds ratio, 0.896; 95% CI 0.832–0.964; p = 0.003).
Table 3.
Liner regression analysis for BI gain
| Variables | β | 95% confidence interval | p value | |
|---|---|---|---|---|
| Lower | Upper | |||
| PS | − 0.166 | 0.160 | 0.599 | 0.047 |
| GNRI | 0.283 | − 122.211 | − 0.706 | 0.001 |
PS (log-transformed propensity score) was calculated from log transformation of the propensity score for age, sex, Charlson Comorbidity Index, number of drugs, and fracture type
GNRI geriatric nutritional risk indexes
Table 4.
Logistic regression analysis for fall during follow-up periods
| Variables | Odds ratio | 95% confidence interval | p value | |
|---|---|---|---|---|
| Lower | Upper | |||
| PS | 7.414 | 0.766 | 7.179 | 0.053 |
| GNRI | 0.896 | 0.832 | 0.964 | 0.003 |
PS (log-transformed propensity score) was calculated from log transformation of the propensity score for age, sex, Charlson Comorbidity Index, number of drugs, and fracture type
GNRI geriatric nutritional risk indexes
Discussion
The results of this retrospective cohort study revealed two aspects concerning nutritional status in patients with OVCF. First, this study suggested that malnutrition was a risk factor for reduced ADL in OVCF. Second, malnutrition may increase the risk of falling after OVCF. This study supports the hypothesis that better nutritional status is associated with improved ADL and functional status after OVCF. There are no reports describing the relationship between nutritional assessment using GNRI and functional prognosis of OVCF; to our knowledge, this is the first study to show the impact of nutritional status on ADL in patients with OVCF.
First, we found that malnutrition may lower ADL after OVCF. Some reports have described the relationship between nutritional status and ADL, and suggested that ADL is lower in cases of malnutrition. Bakker et al. [21] reported that malnutrition is associated with lower ADL, QoL, and longer hospital stay and rehabilitation. Moreover, Bakker et al. [21] and Osta et al. [22] reported malnutrition in 4.8% and 13.5% of elderly patients, respectively. In our study, the prevalence of malnutrition was higher than in other studies. For this reason, Bakker et al. [21] and Osta et al. [22] reported that weight loss was included in nutritional assessment. Since the item of weight loss was not included in GNRI which we used as an index for nutritional status, it was considered that there was a case in which nutrition disorder was considered even in the absence of weight loss. In addition, since the subjects were patients with OVCF, undernutrition itself was considered to be a risk for fracture, which may have resulted in a high proportion of malnutrition. Nutritional assessment using GNRI and appropriate nutritional assessment may improve ADL.
Second, low GNRI was associated with a higher risk of falls after OVCF. In a previous study on fall risk, Hong et al. [23] noted age, gender, marital status, self-rated health, number of chronic diseases, number of disability items, ADL, and physical functioning as risk factors for falls in the elderly. Galet et al. [24] reported that the rate of readmission due to falls increased from 15.6% in 2010 to 17.4% in 2014, necessitating a fall prevention program. In this current study, falls after OVCF were negatively correlated with GNRI, serum albumin, and JOA scores, and the total number of drugs on admission was positively correlated. These results suggest that malnutrition, functional decline, and polypharmacy are associated with falls after OVCF. Furthermore, a logistic regression analysis using propensity score matching for the probability of falls after OVCF showed that GNRI had an influence on the probability of falls after OVCF. Malnutrition reduces body weight and skeletal muscle mass by breaking down muscle and fat for energy; as a result, it was considered that balance ability and walking ability decreased, and fall risk increased.
Bonafede et al. [25] described the risk factors for falls in OVCF as osteoporosis and no recent fracture, falls, older age, poor health status, and comorbidities, but did not mention motor function or nutritional assessment. However, in our study, age and comorbidities were not correlated with BI gain and falls after OVCF, and JOA scores for motor function assessment and nutritional assessment influenced falls and ADL acquisition after OVCF. These results suggest that better motor function and nutritional status may reduce falls after OVCF. From these results, it was considered that nutrition assessment and preparation of fall prevention programs were necessary to prevent falls after OVCF. In addition, GNRI is a simple and accurate tool for predicting the risk of mortality in hospitalized elderly patients. In this study, low GNRI on admission in OVCF patients may increase the risk of falls.
Regarding the relationship between GNRI and BMD, this study showed a positive correlation between GNRI and BMD. There are several reports on the relationship between osteoporosis and nutrition [26, 27]. As for the relationship between nutritional status and bone density, Chen et al. [28] found that when GNRI was high, bone density and grip strength were high. The nutritional evaluation using GNRI is important for the motor function improvement.
This study had a few limitations. First, detailed assessment of sarcopenia and muscle strength, balance assessment, and pain assessment were insufficient for the retrospective study. Second, the assessment of living conditions, such as family members living together, employment, and the presence or absence of stairs in the house, was insufficient. It is necessary to carry out the evaluation of such life situation in future.
Conclusion
This study showed that undernutrition affects ADL acquisition in elderly OVCF patients. Furthermore, malnutrition also affected falls after OVCF. In the future, it will be necessary to conduct a detailed investigation of motor function and environmental factors, and to verify a rehabilitation program that will be effective for preventing falls.
Acknowledgements
Not applicable.
Author Contributions
All authors helped with data collection and contributed to the writing and critical revisions for intellectual content and final approval of the article.
Funding
There is no funding for the current study.
Availability of Data and Materials
The datasets used/or analyzed during the current study are available from the corresponding author on reasonable request.
Declarations
Conflict of Interest
All authors declare that they have no competing interests.
Ethics Approval and Consent to Participate
The study protocol was reviewed and approval by the Committee on Ethics and the institutional review board of Nihon University Hospital and Osumi Hospital. Because this study was retrospective, the requirement for informed consent was waived.
Consent for Publication
Not applicable.
Footnotes
Publisher's Note
Springer Nature remains neutral with regard to jurisdictional claims in published maps and institutional affiliations.
References
- 1.Ballane G, Cauley JA, Luckey MM, Fuleihan GEH. Worldwide prevalence and incidence of osteoporotic vertebral fractures. Osteoporosis International. 2017;28:1531–1542. doi: 10.1007/s00198-017-3909-3. [DOI] [PubMed] [Google Scholar]
- 2.Harada A, Matsuyama Y, Nakano T, Deguchi M, Kuratsu S, Sueyoshi Y, Ito M. Nationwide survey of current medical practices for hospitalized elderly with spine fractures in Japan. Journal of Orthopaedic Science. 2010;15:79–85. doi: 10.1007/s00776-009-1411-2. [DOI] [PubMed] [Google Scholar]
- 3.Johnell O, Kanis JA. An estimate of the worldwide prevalence and disability associated with osteoporotic fractures. Osteoporosis International. 2006;17(12):1726–1733. doi: 10.1007/s00198-006-0172-4. [DOI] [PubMed] [Google Scholar]
- 4.Naves M, Díaz-López JB, Gómez C, Rodríguez-Rebollar A, Serrano-Arias M, Cannata-Andía JB. The effect of vertebral fracture as a risk factor for osteoporotic fracture and mortality in a Spanish population. Osteoporos International. 2003;14:520–524. doi: 10.1007/s00198-003-1405-4. [DOI] [PubMed] [Google Scholar]
- 5.Duchowny KA, Clarke PJ, Peterson MD. Muscle weakness and physical disability in older Americans: longitudinal findings from the US Health and Retirement Study. The Journal of Nutrition, Health & Aging. 2018;22:501–507. doi: 10.1007/s12603-017-0951-y. [DOI] [PMC free article] [PubMed] [Google Scholar]
- 6.Tanaka S, Yoshida A, Kono S, Oguma T, Hasegawa K, Ito M. Effectiveness of elcatonin for alleviating pain and inhibiting bone resorption in patients with osteoporotic vertebral fractures. Journal of Bone and Mineral Metabolism. 2017;35:544–553. doi: 10.1007/s00774-016-0791-6. [DOI] [PubMed] [Google Scholar]
- 7.Suzuki N, Ogikubo O, Hansson T. The prognosis for pain, disability, activities of daily living and quality of life after an acute osteoporotic vertebral body fracture: its relation to fracture level, type of fracture and grade of fracture deformation. European Spine Journal. 2009;18:77–88. doi: 10.1007/s00586-008-0847-y. [DOI] [PMC free article] [PubMed] [Google Scholar]
- 8.Kim HJ, Park S, Park SH, et al. Prevalence of frailty in patients with osteoporotic vertebral compression fracture and its association with numbers of fractures. Yonsei Medical Journal. 2018;59:317–324. doi: 10.3349/ymj.2018.59.2.317. [DOI] [PMC free article] [PubMed] [Google Scholar]
- 9.Iida H, Sakai Y, Watanabe T, Matsui H, Takemura M, Matsui Y, Harada A, Hida T, Ito K, Ito S. Sarcopenia affects conservative treatment of osteoporotic vertebral fracture. Osteoporos Sarcopenia. 2018;4:114–117. doi: 10.1016/j.afos.2018.09.002. [DOI] [PMC free article] [PubMed] [Google Scholar]
- 10.Hida T, Shimokata H, Sakai Y, Ito S, Matsui Y, Takemura M, Kasai T, Ishiguro N, Harada A. Sarcopenia and sarcopenic leg as potential risk factors for acute osteoporotic vertebral fracture among older women. European Spine Journal. 2016;25:3424–3431. doi: 10.1007/s00586-015-3805-5. [DOI] [PubMed] [Google Scholar]
- 11.Hew FL, Chan SP, Yeap SS. Sarcopenia and vertebral fracture. Osteoporos Sarcopenia. 2018;4:151. doi: 10.1016/j.afos.2018.11.086. [DOI] [PMC free article] [PubMed] [Google Scholar]
- 12.Denison HJ, Cooper C, Sayer AA, Robinson SM. Prevention and optimal management of sarcopenia: A review of combined exercise and nutrition interventions to improve muscle outcomes in older people. Clinical Interventions in Aging. 2015;10:859–869. doi: 10.2147/CIA.S55842. [DOI] [PMC free article] [PubMed] [Google Scholar]
- 13.Robinson SM, Reginster JY, Rizzoli R, Shaw SC, Kanis JA, Bautmans I, Bischoff-Ferrari H, Bruyère O, Cesari M, Dawson-Hughes B, Fielding RA, Kaufman JM, Landi F, Malafarina V, Rolland Y, van Loon LJ, Vellas B, Visser M, Cooper C, ESCEO working group Does nutrition play a role in the prevention and management of sarcopenia? Clin Nutr. 2018;37:1121–1132. doi: 10.1016/j.clnu.2017.08.016. [DOI] [PMC free article] [PubMed] [Google Scholar]
- 14.Wakabayashi H, Sakuma K. Rehabilitation nutrition for sarcopenia with disability: A combination of both rehabilitation and nutrition care management. Journal of Cachexia, Sarcopenia and Muscle. 2014;5:269–277. doi: 10.1007/s13539-014-0162-x. [DOI] [PMC free article] [PubMed] [Google Scholar]
- 15.Takahashi K, Kubo A, Ishimura K, Fukui T, Tamura T. Correlation among sarcopenia, malnutrition and activities of daily living in patients with vertebral compression fractures: A comparison based on admission and discharge parameters evaluating these conditions. Journal of Physical Therapy Science. 2018;30(12):1401–1407. doi: 10.1589/jpts.30.1401. [DOI] [PMC free article] [PubMed] [Google Scholar]
- 16.Bouillanne O, Morineau G, Dupont C, Coulombel I, Vincent JP, Nicolis I, Benazeth S, Cynober L, Aussel C. Geriatric nutritional risk index: A new index for evaluating at-risk elderly medical patients. American Journal of Clinical Nutrition. 2005;82:777–783. doi: 10.1093/ajcn/82.4.777. [DOI] [PubMed] [Google Scholar]
- 17.Okamoto T, Hatakeyama S, Narita S, Takahashi M, Sakurai T, Kawamura S, Hoshi S, Ishida M, Kawaguchi T, Ishidoya S, Shimoda J, Sato H, Mitsuzuka K, Tochigi T, Tsuchiya N, Arai Y, Habuchi T, Ohyama C. Impact of nutritional status on the prognosis of patients with metastatic hormone-naïve prostate cancer: A multicenter retrospective cohort study in Japan. World Journal of Urology. 2019;37(9):1827–1835. doi: 10.1007/s00345-018-2590-2. [DOI] [PubMed] [Google Scholar]
- 18.Genant HK, Jergas M, Palermo L, Nevitt M, Valentin RS, Black D, Cummings SR. Comparison of semiquantitative visual and quantitative morphometric assessment of prevalent and incident vertebral fractures in osteoporosis. The Study of Osteoporotic Fractures Research Group. Journal of Bone and Mineral Research. 1996;11:984–996. doi: 10.1002/jbmr.5650110716. [DOI] [PubMed] [Google Scholar]
- 19.D’Hoore W, Sicotte C, Tilquin C. Risk adjustment in outcome assessmen: The Charlson comorbidity index. Methods of Information in Medicine. 1993;32:382–387. doi: 10.1055/s-0038-1634956. [DOI] [PubMed] [Google Scholar]
- 20.Takahashi K, Kitahara H, Yamagata M, Murakami M, Takata K, Miyamoto K, Mimura M, Akahashi Y, Moriya H. Long-term results of anterior interbody fusion for treatment of degenerative spondylolisthesis. Spine (Phila Pa 1976) 1990;15:1211–1215. doi: 10.1097/00007632-199011010-00022. [DOI] [PubMed] [Google Scholar]
- 21.Bakker MH, Vissink A, Spoorenberg SLW, Jager-Wittenaar H, Wynia K, Visser A. Are edentulousness, oral health problems and poor health-related quality of life associated with malnutrition in community-dwelling Elderly (aged 75 years and over)? A Cross-Sectional Study. Nutrients. 2018;10:1965. doi: 10.3390/nu10121965. [DOI] [PMC free article] [PubMed] [Google Scholar]
- 22.El Osta N, El Arab H, Saad R, Rabbaa Khabbaz L, Fakhouri J, Papazian T, El Osta L. Assessment of nutritional status of older patients attending a tertiary hospital in Middle Eastern country. Clinical Nutrition ESPEN. 2019;33:105–110. doi: 10.1016/j.clnesp.2019.06.010. [DOI] [PubMed] [Google Scholar]
- 23.Hong X, Yan J, Xu L, Shen S, Zeng X, Chen L. Relationship between nutritional status and frailty in hospitalized older patients. Clinical Interventions in Aging. 2019;14:105–111. doi: 10.2147/CIA.S189040. [DOI] [PMC free article] [PubMed] [Google Scholar]
- 24.Galet C, Zhou Y, Eyck PT, Romanowski KS. Fall injuries, associated deaths, and 30-day readmission for subsequent falls are increasing in the elderly US population: A query of the WHO mortality database and National Readmission Database from 2010 to 2014. Clinical Epidemiology. 2018;10:1627–1637. doi: 10.2147/CLEP.S181138. [DOI] [PMC free article] [PubMed] [Google Scholar]
- 25.Bonafede M, Shi N, Barron R, Li X, Crittenden DB, Chandler D. Predicting imminent risk for fracture in patients aged 50 or older with osteoporosis using US claims data. Archives of Osteoporosis. 2016;11:26. doi: 10.1007/s11657-016-0280-5. [DOI] [PMC free article] [PubMed] [Google Scholar]
- 26.Rizzoli R, Bischoff-Ferrari H, Dawson-Hughes B, Weaver C. Nutrition and bone health in women after the menopause. Womens Health (London). 2014;10(6):599–608. doi: 10.2217/WHE.14.40. [DOI] [PubMed] [Google Scholar]
- 27.Tucker KL. Osteoporosis prevention and nutrition. Current Osteoporosis Reports. 2009;7(4):111–117. doi: 10.1007/s11914-009-0020-5. [DOI] [PubMed] [Google Scholar]
- 28.Chen SC, Chung WS, Wu PY, Huang JC, Chiu YW, Chang JM, Chen HC. Associations among geriatric nutrition risk index, bone mineral density, body composition and handgrip strength in patients receiving hemodialysis. Nutrition. 2019;65:6–12. doi: 10.1016/j.nut.2019.02.013. [DOI] [PubMed] [Google Scholar]
Associated Data
This section collects any data citations, data availability statements, or supplementary materials included in this article.
Data Availability Statement
The datasets used/or analyzed during the current study are available from the corresponding author on reasonable request.