

Abstract
Eight blueberry cultivars at three developmental stages were investigated for metabolite profiling, antioxidant, and anticancer activities. Cultivars- and developmental stages-variations were determined in total phenolic, flavonoid, DPPH, and FRAP antioxidant assays. The anticancer capacity was equal against A549, HepG2, and Caco-2 cancer cells, whereas the inhibition rate was dose-, incubation period-, cultivar-, and developmental stages-dependent. The untargeted metabolite profiling by UPLC-TOF-MS analysis of two contrast cultivars, ‘Vernon’ and ‘Star’, throughout the developmental stages revealed 328 metabolites; the majority of them were amino acids, organic acids, and flavonoids. The multivariate statistical analysis identified five metabolites, including quinic acid, methyl succinic acid, chlorogenic acid, oxoadipic acid, and malic acid, with positively higher correlations with all anticancer activities. This comprehensive database of blueberry metabolites along with anticancer activities could be targeted as natural anticancer potentials. This study would be of great value for food, nutraceutical, and pharmaceutical industries as well as plant biotechnologists.
Keywords: Blueberry cultivars, Berry developmental stage, Antioxidant, Anticancer, Untargeted metabolomics, Biomarker metabolites
1. Introduction
Blueberry (Vaccinium corymbosum) is considered one of the most popular fruits globally because of its good taste and numerous health benefits (Folmer et al., 2014; Li et al., 2017). It is classified as northern highbush species commercially grown in the United States (Mengist et al., 2020). Blueberry is considered a reservoir of bioactive compounds with various health benefits. Its bioactivities include potential anti-cancer, antioxidant, anti-inflammation, anti-obesity, and anti-diabetic activities (Jiao et al., 2019; Tian et al., 2019; Wang, Lin et al., 2019; Wang, Fong, Singh, Vorsa, & Johnson-Cicalese, 2019). The health benefits of blueberry have been primarily attributed to the presence of accepted, such as growth inhibition of several types of human cancer cells, including breast, cervical, colon, and prostate cancer (Folmer et al., 2014). The blueberry bioactive metabolites with anticancer properties are mainly flavonols, flavanols, phenolic acids, stilbenes, anthocyanins, terpenoids, and micronutrients (Folmer et al., 2014).
The daily consumption of antioxidant-rich plant-based food/products is expanding rapidly because of their practical preventive approaches against several diseases (Aravind, Wichienchot, Tsao, Ramakrishn, & Chakkaravarthi, 2021; Jiang, Fang, Leonard, & Zhang, 2021; Lourenço, Moldão-Martins, & Alves, 2019; Raudonė et al., 2021). Consequently, the demand for functional foods/product development through stimulating the accumulation of naturally occurring bioactive several health-related metabolites such as organic acids, sugars, micro-metabolites in their biological matrix or through various food-nutrients, and polyphenolic compounds (Folmer et al., 2014). The anticancer properties of berry extracts/metabolites/products are widely processing techniques is gaining utmost research interest. It is conceivable that several factors can affect the natural occurrence patterns of berry’s bioactive compounds and metabolites. This includes, but is not necessarily limited to genotypic diversity, environmental conditions, berry developmental stages, and interactions among these factors. The berry developmental stage significantly influences the organoleptic properties and phytochemical compositions of berries (Forney et al., 2012). Indeed, ripening is accompanied by substantial fruit composition changes, leading to alterations in fruit colors, textures, taste, and, most importantly, the nutritional benefits (Castrejón, Eichholz, Rohn, Kroh, & Huyskens-Keil, 2008).
Several studies were performed investigating the effect of cultivar variations in blueberry metabolites, fruit quality, maturation, and health benefits (Gündüz, Serçe, & Hancock, 2015; Li et al., 2017; Scalzo, Stevenson, & Hedderley, 2015; Timmers, Grace, Yousef, & Lila, 2017; Wang, Lin et al., 2019; Wang, Fong et al., 2019). However, the available studies are mainly focused on the total metabolite content or target-specific metabolites in a small number of genotypes/cultivars. Despite its importance, it provides limited insights into the maximum metabolic characteristics. Most importantly, there are still limited studies on the variations among blueberry cultivars in terms of their untargeted metabolite profiles and how these profiles would vary among different stages of berry developments. A more comprehensive study on the blueberry’s metabolite profiling and health benefit qualities at different developmental stages would reveal the transformation patterns of metabolites with their health functionalities. Lately, high-throughput metabolomics approaches are focused on providing an inclusive chemical profile of plant/foods-based samples, leading to new insights into the development of functional foods/products (Darwish et al., 2021; Das, Kim, Hong, & Eun, 2019; Pinu, 2018; Wang, Cao, Yuan, & Guo, 2021). For instance, the novel UPLC-TOF-MS technique provides the platform to estimate different analytes at very lower levels with better accuracy, sensitivity, precision, and more importantly in a time-effective manner. The UPLC-MS is reported to identify the berry metabolites (Concetta et al., 2020; Qian, Zhang, An, Zhou, & Qian, 2021).
The present study aims to evaluate the total metabolite content, antioxidant, anticancer activities, and untargeted metabolite profiling of eight blueberry cultivars throughout three developmental stages. In addition, multivariate statistical analysis was performed to characterize the biomarker compounds associated with anticancer potential. Therefore, this study provides a comprehensive database of types, relative quantities, and accumulation patterns of biologically active metabolites and bioactivities in blueberry, which is anticipated to be of great value to different entities in the food and nutraceutical industries, as well as plant breeders and biotechnologists aiming to develop new blueberry germplasm with superior fruit quality and nutritional value.
2. Materials and methods
2.1. Chemicals and reagents
Folin–Ciocalteau phenol reagent, 2,2-diphenyl-1-picrylhydrazyl (DPPH), gallic acid, quercetin, Trolox, TPTZ, HPLC grade methanol, acetate buffer, FeCl3, acetic acid, quercetin, DMSO, crystal violet, RPMI-1640 media, Dulbecco’s Modified Eagle Medium (DMEM), fetal bovine serum (FBS-HI), penicillin, and streptomycin were all purchased from Sigma-Aldrich Chemical Co. (St. Louis, MO, USA).
2.2. Blueberry sample
In this study, eight blueberry cultivars (Vaccinium corymbosum), including Star’, ‘Vernon’, ‘Alapaha’, ‘Abundance’, ‘Meadowlark’, ‘Farthing’, ‘Emerald’, and ‘Sweet Crisp’ were used. All cultivars were grown at the Center for Viticulture and Small Fruit Research of the Florida A&M University, Tallahassee, Florida (30◦ 28′ 45.63′′ N, 84◦ 10′ 16.43′′ W). Samples were collected from 7-years old blueberry trees at different fruit developmental stages: stage-I (green color), stage-II (turning pigmentation), and stage-III (ripening) (Fig. 1A). The ripening stage of blueberry cultivars was determined via assessing several physicochemical characteristics including, several color parameters, weight, total soluble solid (◦Brix), pH, and total acidity (g tartaric acid/L) (Table S1). For each cultivar at each developmental stage, berries were collected, cut into small pieces, frozen in liquid nitrogen, and then ground to a fine powder using a Geno/Grinder 2010 (Metuchen, NJ, USA). All samples were stored at −80 ◦C for further analysis. Blueberry powder samples (12 g) were extracted using 100 mL of methanol, and the mixture was kept for shaking at room temperature for 24 h in the dark. After that, the supernatant was separated by Whatman no. 41 filter papers (Thomas Scientific, Swedesboro, NJ, USA), and the collected supernatants were concentrated under the reduced pressure at 40 ◦C with a rotary evaporator, followed by dehydration in a speed vacuum (Eppendorf North America, Enfield, CT, USA). All dried extracts were stored at 4 ◦C in the dark for further analysis. Finally, the stock solution of blueberry fresh extracts was prepared at 10 mg/mL concentration in DMSO to determine total metabolite content and antioxidant activity. For anticancer assays, 10 mg of blueberry extracts were dissolved in 25 µL of DMSO (stock solution). This extract was further diluted 10X with DMEM (working solution) to determine the anticancer activity.
Fig. 1.

(A) Close-up view of the 8 blueberry cultivars at different developmental stages. Stage I represents the green color stage, stage II represents the turning pigmentation stage, and stage III represents the ripening stage. (B) Total phenolic content (TPC), (C) Total flavonoid content (TFC), (D) Total anthocyanin content (TAC), (E) DPPH radical scavenging activity, and (F) FRAP activity of blueberry cultivars during developmental stages. Colors representing each cultivar are indicated. Data represent the mean values ± SD (n = 3). The different lowercase letters represent the significant differences among blueberry cultivars and different uppercase letters represent the significant differences among developmental stages, according to Duncan’s multiple range test (p > 0.05). (For interpretation of the references to color in this figure legend, the reader is referred to the web version of this article.)
2.3. Total phenolic and flavonoid content
Total phenolic content (TPC) was determined according to the previously described method by Siriwoharn, Wrolstad, Finn, and Pereira (2004), with minor modifications. Briefly, 15 μL of diluted blueberry extracts were placed in a 96-well microplate (Genesee Scientific, San Diego, California, USA). Subsequently, 240 μL of Folin-Ciocalteu reagent (1:15, v/v) was added to the wells and incubated in the dark at room temperature for 30 min. Then, the mixtures were treated with 15 μL of 20% sodium carbonate solution. The mixture was shaken before measuring the absorbance at λ = 755 nm using a microplate reader (ACCURIS Smart Reader, Edison, NJ, USA). Gallic acid solutions in the specific concentration range (100–400 mg/L) were used to construct a calibration curve. TPC in blueberry samples was expressed as milligram gallic acid equivalents per gram of fresh sample weight (mg GAE/g FW). Total flavonoid content (TFC) was estimated based on the previously reported method by Chang, Yang, Wen, and Chern (2002), with slight modifications. Briefly, an aliquot (25 μL) of diluted blueberry extracts was mixed with 75 μL of 96% methanol (v/v) and placed in a 96-well microplate. Then, 5 μL of 10% aluminum chloride and 5 μL of potassium acetate (1 M) were added to the mixture. Finally, 140 μL of distilled water was added and incubated for 30 min in the dark at room temperature. The mixture was then shaken before measuring the absorbance at λ = 415 nm using a microplate reader. Quercetin was used to construct the calibration curve in a different concentration range (3.12–100 mg/L). TFC in blueberry samples was expressed as milligram quercetin equivalents per gram of fresh sample weight (mg QE/g FW).
2.4. Total anthocyanin content
Total anthocyanin content (TAC) in the blueberry sample was performed following the method described by Giusti and Wrolstad (2001), using Anthocyanins Assay Kit (Cosmo Bio, Carlsbad, CA, USA) with minor modifications to accommodate the reaction in 96-well microplates. First, a volume of 200-μL of Reagent A (KCl—25 mM) and 200-μL of Reagent B (Na Acetate—0.4 M, pH 4.5) was added in wells of 96-well microplates. Then, 20-μL of the blueberry sample was added to each well. The reactions were mixed by slow shaking for 1 min and incubated in the dark for 10 min at room temperature. The absorbance was measured at λ = 510 nm (for maximum anthocyanin absorption) and λ = 700 nm (for turbidity correction) using a microplate reader. TAC value was expressed as milligram cyanidin 3-glucoside equivalents per liter (mg/L).
2.5. DPPH and FRAP antioxidant activity
DPPH radical scavenging activity was determined according to the previously reported method by Darwish et al. (2016). Briefly, 100 μL of diluted blueberry samples were mixed with 100 μL of freshly prepared DPPH methanolic solution (200 μM). The mixture was then incubated for 30 min in the dark at room temperature. The absorbance was measured at λ 515 nm using a microplate reader. As a control, DMSO was used in place of the samples. DPPH activity was estimated for each biological replicate in triplicate (n 9). Data were expressed as the percentage scavenging of DPPH radical and calculated using the following equation:
Ferric reducing antioxidant potential (FRAP) assay was performed based on the previously described method by Lee, Kim, Kim, and Kim (2014) with slight modifications. The FRAP reagent was prepared at the ratio of 10:1:1 (v/v/v) consist of 300 mM acetate buffer (pH 3.6), a solution of 40 mM TPTZ in 40 mM HCl, and 20 mM FeCl3. Freshly prepared FRAP reagent (280 µL) and diluted samples (20 µL) were mixed in a 96-well microplate and incubated at 37 ◦C in the dark for 30 min. The absorbance was measured at λ = 590 nm using the microplate reader. Trolox at different concentrations was used to make the standard curve. FRAP activity was estimated for each biological replicate in triplicate (n = 9). Data are expressed in millimolar Trolox equivalents per gram of sample fresh weight (mM TE/g FW).
2.6. Anticancer activity
2.6.1. Cell culture
Three different human cancer cells, including A549 (lung carcinoma), HepG2 (hepatocellular carcinoma), and Caco-2 (colorectal adenocarcinoma) cell lines were obtained from ATCC (Manassas, VA, USA). The cells were cultured in DMEM basal medium supplemented with 10% (v/v) heat-inactivated fetal bovine serum and 1% penicillin/ streptomycin (100 U/mL penicillin and 0.1 mg/mL streptomycin). Cell cultures were incubated in an atmosphere of 5% CO2 at 37 ◦C (VWR, Suwanee, GA, USA). Cell growth and viability were determined using a Bio-Rad TC-20 automated cell counter (Bio-Rad, Hercules, CA, USA) after 24, 48, and 72 h incubation using crystal violet (1%).
2.6.2. Cell viability assay
Cells (density of 3 × 10⁴ cells/well) were incubated overnight in experimental media in 96-well plates. All blueberry extracts were prepared in 3 biological replicates, and each replicate was tested in triplicate on the 96-well plate. Blueberry extracts were added to the 96-well plates at final concentrations of 250, 500, 750, and 1000 (ng/mL). Cells were incubated at 37 ◦C for 24, 48, and 72 h. After each time-point, 10 μL of Alamar Blue solution (0.5 mg/mL) was pipetted into the plate (final concentration 10%, v/v) and incubated for an additional 4 h. The fluorescence signal was measured (550/580 nm) using an Infinite M200 microplate reader (Tecan, Männedorf, Switzerland). Controls were treated with DMSO at the same concentration used in the extracts (<1%). Blank wells contained only media, without cells. The rate of cell growth inhibition was calculated based on cell viability percentage, using the following formula:
2.7. Untargeted metabolomics
2.7.1. UPLC-TOF-MS analysis
For the untargeted metabolomics study, 200 μL of 80% methanol were added to the sample tube and vortexed for 30 s. Then, samples were kept at – 40 ◦C for 1 h. After that, samples were vortexed for 30 s and centrifuged at 12,000 rpm for 15 min/4 ◦C. Finally, 150 μL of supernatant and 5 μL of DL-o-Chlorophenylalanine (140 μg/mL) were transferred to the vial for LC-MS analysis. Separation was performed by Ultimate 3000LC combined with Q Exactive MS (Thermo) and screened with ESI-MS. The LC system is composed of an ACQUITY UPLC HSS T3 (100 × 2.1 mm, 1.8 μm) with Ultimate 3000LC. The mobile phase was composed of solvent A (0.05% formic acid–water) and solvent B (acetonitrile) with a gradient elution (0–1 min, 5% B; 1–12 min, 5–95% B; 12–13.5 min, 95% B; 13.5–13.6 min, 95–5% B; 13.6–16.0 min, 5% B). The flow rate of the mobile phase was 0.3 mL/min. The column temperature was maintained at 40 ◦C, and the sample manager temperature was set at 4 ◦C. Mass spectrometry parameters for ESI+ and ESI− mode are listed as follows: ESI+: Heater Temp 300 ◦C; Sheath Gas Flow rate, 45 arb; Aux Gas Flow Rate, 15 arb; Sweep Gas Flow Rate, 1 arb; spray voltage, 3.0 kV; Capillary Temp, 350 ◦C; S-Lens RF Level, 30%. ESI : Heater Temp 300 ◦C, Sheath Gas Flow rate, 45 arb; Aux Gas Flow Rate, 15arb; Sweep Gas Flow Rate, 1 arb; spray voltage, 3.2 kV; Capillary Temp, 350 ◦C; S-Lens RF Level, 60%.
2.7.2. Data processing and statistical analysis
Raw data were acquired and aligned using the Compound Discover (3.0, Thermo Fisher Scientific) based on the m/z value and the retention time of the ion signals. Ions from ESI or ESI were merged and imported into the SIMCA-P program (version 14.1). All multivariate and statistical analyses, including the metabolite set enrichment analysis (MSEA), principal components analysis (PCA), partial least-squares–discriminant analysis (PLS-DA), volcano plot analysis, and heatmap analysis were carried out using MetaboAnalyst 5.0 online software (https://www.metaboanalyst.ca/MetaboAnalyst/home.xhtml). MSEA was carried out based on enrichment analysis by inputting the Human Metabolome Database (HMDB) ID to specify major chemical groups of identified metabolites. PCA was first used as an unsupervised method to find whether there were fundamental differences among blueberry cultivars throughout the developmental stages. Finally, statistical evaluation of group differences using volcano plot analysis was performed to visualize differences between the two cultivars at every developmental stage and identify the metabolites that vary significantly between the cultivars regarding their fold-change. For statistical evaluation of the volcano plot, the fold change of >2.0 and p-value of <0.05 were considered significant differentially accumulated metabolite (up-regulated or down-regulated). Furthermore, supervised regression modeling was performed on the data set using PLS-DA to obtain the variable importance in the projection (VIP). The biomarkers were filtered and confirmed by combining the results of the VIP, |p|, and |p(corr)|, and the screened metabolites were analyzed by the heatmap of Pearson correlation with anticancer activities to find out the potential anticancer biomarkers.
2.7.3. Metabolite identification
The most significant metabolite’s MS/MS spectra were acquired and searched in the following databases: METLIN (https://metlin.scripps.edu/landing_page.php), the Human Metabolome Database (www.hmdb.ca), Massbank (https://massbank.eu/MassBank/Search), and MetFrag (https://ipb-halle.github.io/MetFrag/). In this study, all metabolites were putatively identified, and no standards were used for identification. The metabolic pathway map was constructed based on relevant literature and the KEGG database (https://www.kegg.jp/kegg-bin/show_pathway?161345586717248/vvi01100.args).
2.8. Statistical analysis
Data were presented as mean ± SD (standard deviation). The significant differences between experimental groups were determined based on analysis of variance (ANOVA) using SAS 9.1.3 software (Cary, North Carolina, USA). Duncan’s Multiple Range test analyzed the comparison of means and differences were considered statistically significant when p < 0.05. Tukey test was performed to get significant differences between two groups: * at p ≤ 0.05, ** ≤ p 0.01, and *** p ≤ 0.001. All figures were constructed using prism (GraphPad Prism 5.01 Inc. La Jolla, CA, USA) statistical software.
3. Results and discussion
3.1. Total metabolite content and antioxidant activity of blueberry cultivars throughout the developmental stages
Total metabolite content and antioxidant activities of blueberry cultivars were determined through the measurement of total phenolic content (TPC), total flavonoid content (TFC), total anthocyanin content (TAC), DPPH radical scavenging activities, and FRAP antioxidant activities at each developmental stage. The developmental stages of blueberry cultivars were designated as stage-I: green color, stage-II: turning pigmentation, and stage-III: ripening (Fig. 1A).
As indicated in Fig. 1B, statistically significant differences (p < 0.05) were observed for TPC among blueberry cultivars and throughout the developmental stages within each cultivar. The average phenolic contents in blueberry cultivars were ranged from 102.8 to 203.6, 37.2 to 116.5, and 42.2 to 122.6 mg GAE/g FW at the developmental stages-I, -II, and -III, respectively. The ‘Vernon’ and ‘Alapaha’ cultivars had significantly higher TPC values, whereas all other six cultivars had lower values throughout the berry development (p < 0.05). At the developmental stage-I, the TPC levels in ‘Vernon’ were ~1.5- to ~2.0-fold higher than all other cultivars. However, ‘Vernon’ and ‘Alapaha’ exhibited an average of ~2.5- and ~2.8-fold higher TPC than other cultivars at the developmental stages-II and -III, respectively. The decline in TPC levels was observed as the berries progressed toward maturity. The results showed that developmental stage-I presented an average of 113% and 105% higher phenolic content than stage-II and -III, respectively. However, no significant differences (p < 0.05) were observed for the TPC levels between developmental stage-II and -III. These results are consistent with others finding that immature blueberry contains higher phenolic levels than the mature or ripe stage (Castrejón et al., 2008; Eichholz, Huyskens-Keil, & Rohn, 2015; Sun et al., 2018). Blueberry total phenolics mainly refer to the phenolic acid groups, especially hydroxycinnamic acid derivatives, which dominate at the green fruit stage (Castrejón et al., 2008; Vvedenskaya & Vorsa, 2004). Other researchers evaluated blueberry cultivars at different developmental stages reported that fruits contain a wide range of total phenolics, averaged at 60.76 (unripe green) to 33 (ripe blue) mg GAE/g DM (Castrejón et al., 2008); 21.36 (white unripe) to 15.13 (ripe) mg GAE/g DM (Kalt, Lawand, Ryan, McDonald, & Donner, 2003); 2.5 (white unripe) to 1.3 (blue ripe) mg GAE/g FW (Castrejón et al., 2008). In agreement with these reports, blueberry average TPC in the current study was ranged between 132 (immature green) to 63 (ripe) mg GAE/g FW. The relatively higher values in our results might be due to variations in cultivar, growing conditions, climate conditions, and/or extraction methods.
The accumulation pattern of TFC was similar to that of TPC throughout the developmental stages (Fig. 1C). The average flavonoids contents in blueberry cultivars were ranged from 6.7 to 32.9, 3.3–11.0, and 7.2–28.4 mg QE/g FW at developmental stages-I, -II, and -III, respectively. ‘Vernon’ cultivar displayed an average of ~3.5-fold higher TFC levels than all other cultivars at the developmental stage-I. On the other hand, ‘Vernon’ and ‘Alapaha’ had an average of ~3-fold higher TFC than other cultivars at the developmental stage-II. Additionally, ‘Vernon’ and ‘Alapaha’ showed an average of ~2.7- and ~3.5-fold higher TFC levels than other cultivars at the developmental stage-III. Our results also showed that most cultivars had significantly higher (p < 0.05) flavonoid content at developmental stage-I compared to that of stages-II and -III. The developmental stage-I had 147% and 11% higher TFC levels than stage-II and -III, respectively. In immature berries, the greatly available flavonoids are mainly those associated with flavonoid subclasses of flavonols and proanthocyanidins derivatives (Castrejón et al., 2008; Vvedenskaya & Vorsa, 2004).
As far as TPC and TFC values are concerned, ‘Vernon’ exhibited significantly higher (p < 0.05) TAC levels than other cultivars (Fig. 1D). The average TAC levels among all cultivars ranged between 0.01 and 0.51, 0.22–0.61, and 2.10–11.4 mg/L at developmental stages-I, -II, and -III, respectively. ‘Vernon’ exhibited ~31-, ~2-, and ~3-fold higher TAC levels when compared to all other cultivars at developmental stages-I, -II, and -III, respectively. Overall, the anthocyanin content in all the cultivars was consistent with that of phenolics and flavonoids. However, the accumulation pattern of these metabolites through developmental stages was not the same. Regardless of the cultivars, TAC levels at developmental stage-III were higher by 4640% and 1107% than stage-I and -II, respectively. The anthocyanin accumulation mainly occurred at the maturation stage and proceeded until full ripening. The decline in phenolics level was detected at the advanced stages of berry development, where the anthocyanin accumulation starts and considered as the major flavonoid at the ripening stage (Castrejón et al., 2008; Jaakola et al., 2002; Spinardi, Cola, Gardana, & Mignani, 2019; Vvedenskaya & Vorsa, 2004; Zifkin et al., 2012). Previous studies reported an increase in the transcript levels of chalcone synthase (CHS), anthocyanidin synthase (ANS), dihydroflavonol 4-reductase (DFR), and UDP-glucose flavonoid 3-O-glucosyltransferase (UFGT) at the ripening stage, leading to the accumulation of anthocyanins (Zifkin et al., 2012).
The antioxidant potential of blueberry extracts as determined by the DPPH and FRAP assays, followed the results of total phenolic and flavonoids throughout the developmental stages, as presented in Fig. 1E and F. Our results indicated that cultivar and developmental stage variations in total phenolic and flavonoid content were accompanied by differences in the antioxidant activities. For instance, ‘Vernon’ exhibited an average of ~2-, ~1.5-, and ~3.8-fold higher DPPH antioxidant activity at the developmental stages-I, -II, and -III, respectively. In addition, developmental stage-I presented an average of 246% and 227% higher antioxidant activities than stage-II and -III, respectively. The Pearson’s correlation analysis revealed that TPC (r = 0.947; p = 2.64 × 10⁻¹²) and TFC (r = 0.668; p = 3.64 × 10⁻⁴) had higher positive correlations with the DPPH radical scavenging activity, whereas, TAC had no significant correlation (r = 0.059).
In the case of FRAP antioxidant activity, ‘Vernon’ exhibited an average of ~1.1-, ~2.6-, and ~2.0-fold higher capacity at the developmental stages-I, -II, and -III, respectively. An average of 98% and 97% augmented FRAP antioxidant activities were observed by developmental stage-I than stage-II and -III, respectively. Similar to DPPH, the Pearson’s correlation analysis revealed that TPC (r = 0.921; p = 1.67 × 10⁻¹⁰) and TFC (r = 0.570; p = 3.65 × 10⁻³) had higher positive correlations with the FRAP, whereas, TAC had no significant correlation (r = 0.079).
3.2. Cancer cell growth inhibitory activities of blueberry extracts
The anticancer activity of different blueberry cultivars and developmental stages was determined for four different extract concentrations 250, 500, 750, and 1000 ng/mL, and three incubation periods, 24, 48, and 72 h, against human lung cancer A549, liver cancer HepG2, and colon cancer Caco-2 cell lines (Table S2). Interestingly, blueberry extracts exhibited potential efficacy to inhibit all three types of cancer cell-growth populations. The anticancer activities of extracts were both doses- and incubation time-dependent. Our results indicated that >50% (on average) cell growth inhibition was achieved by a 500 ng/mL dose regardless of the incubation period. Additionally, the prolonged incubation required a lower extract concentration for efficient cell growth inhibition. Overall, extracts at the range of 250 to 500 ng/mL showed significant differences (p < 0.05) to inhibit all three types of cancer cell growth. In contrast, the 750 to 1000 ng/mL concentrations showed moderate to minor differences among all incubation periods. The statistically highest anticancer potential was linked to ‘Vernon’ and ‘Alapaha’ cultivars. In contrast, the moderate to lower activity was associated with ‘Sweet Crisp’, ‘Abundance’, ‘Meadowlark’, ‘Farthing’, ‘Star’, and ‘Emerald’, in that order. The highest anticancer activity was generally associated with developmental stage-I and the lowest with stage-III among developmental stages.
The potential cancer activities of blueberry extracts were investigated further by comparing between the highest (‘Vernon’) and lowest (‘Star’) blueberry cultivars based on their metabolite contents and nutritional benefits. Extracts from these cultivars were examined on three cancer cell lines at a 500 ng/mL concentration for 48 h incubation. Our results showed that ‘Vernon’ had 52%, 22%, and 21% higher anticancer activity than ‘Star’ at developmental stages-I, -II, and -III, respectively, against the lung cancer cells A549. In addition, ‘Vernon’ had 47%, 16%, and 18% higher anticancer activity against HepG2 cells, 46%, 21%, and 33% higher ability against Caco-2 cells at the developmental stages-I, -II, and -III, respectively (Fig. 2A). This result indicated that developmental stage-I had higher potentials to inhibit cancer cell growth than stages-II and -III. Furthermore, the acquired IC50 values indicated that the extract concentration to achieve 50% cell growth inhibition was 1.2-times less when ‘Vernon’ extracts were used compared to ‘Star’ extracts regardless of the developmental stage these extracts were prepared. (Fig. 2B, C, D). The overall lowest and highest IC50 values for the three cancer cell lines were observed in ‘Vernon’ at developmental stage-I and ‘Star’ at stage-III, respectively. The lowest and highest IC50 dose was concluded as 320 and 591 ng/mL against lung cancer cells A549, 317 and 591 ng/mL against liver cancer cells HepG2, and 335 and 597 ng/mL against colon cancer cell Caco-2 population, respectively. The higher potency of ‘Vernon’ in inhibiting cancer cell populations might be due to its high bioactive metabolite contents. Indeed, correlation analyses demonstrated a significant positive correlation between TPC and the growth inhibition of the three cancer cell lines; however, the correlation was slightly stronger with the HegG2 (r = 0.834; p = 4.22 × 10⁻⁷) and the A549 (r = 0.832; p = 4.56 × 10⁻⁷) cells than that with Caco-2 cells (r = 0.775; p = 8.60 × 10⁻⁶). Surprisingly, TFC showed a moderate correlation with the cancer cell growth inhibition, where Caco-2 displayed the strongest correlation (r = 0.516; p = 9.86 × 10⁻³), followed by HepG2 (r = 0.418; p = 4.19 × 10⁻²) and A549 (r = 0.407; p = 4.83 × 10⁻²). Interestingly, the DPPH antioxidant capacity exhibited a similarly strong positive correlation with cell growth inhibition of A549 (r = 0.783; p = 6.20 × 10⁻⁶), HepG2 (r = 0.776; p = 8.24 × 10⁻⁶), and Caco-2 (r = 0.742; p = 2.27 × 10⁻⁵). Likewise, the FRAP antioxidant potency displayed a strong positive correlation with cell growth inhibition of A549 (r = 0.800; p = 2.77 × 10⁻⁶), HepG2 (r = 0.801; p = 2.62 × 10⁻⁶), and Caco-2 (r = 0.672; p = 3.22 × 10⁻⁴). The anticancer properties of blueberry extracts are mainly associated with specific berry-derived-bioactive compounds, especially flavonoids and phenolic acids, which are positively correlated with their anticancer potentials (Folmer et al., 2014).
Fig. 2.

(A) Inhibition percentage (%) of the A549, HepG2, and Caco-2 cancer cell growth by selected blueberry cultivars throughout the different developmental stages at the dose of 500 ng/mL for 48 h incubation. (B) IC50 values of selected blueberry cultivars throughout the developmental stages for (B) A549, (C) HepG2, and (D) Caco-2 cancer cells at 48 h incubation. Data represent the mean values ± SD (n = 3). ** Significant at p ≤ 0.01, ns: non-significant. Vern-SI: ‘Vernon’ cultivar at the green color stage; Vern-SII: ‘Vernon’ cultivar at the turning pigmentation stage; Vern-SIII: ‘Vernon’ cultivar at the ripe stage; Star-SI: ‘Star’ cultivar at the green color stage; Star-SII: ‘Star’ cultivar at the turning pigmentation stage; Star-SIII: ‘Star’ cultivar at the ripe stage. (For interpretation of the references to color in this figure legend, the reader is referred to the web version of this article.)
3.3. Untargeted metabolite profiling of selected blueberry cultivars throughout the developmental stages
For the untargeted metabolite profile analysis, we only selected the two most representative cultivars, ‘Vernon’ and ‘Star’, based on the significant variability in their total metabolite contents, antioxidant capacity, and anticancer activity throughout all developmental stages, as shown above. A total of 328 metabolites (153 in ESI+ mode, 69 in ESI− mode, and 106 in ESI+ and ESI− modes) were putatively identified in all blueberry samples (Table S3). The primary chemical grouping of 328 identified metabolites from all blueberry cultivars throughout the developmental stages was performed based on over-representation analysis using metabolite set enrichment analysis (MSEA) (Fig. 3). As all 328 metabolites were identified in all cultivars as well as developmental stages, the over-representation analysis of MSEA denotes the significant chemical groups under the chemical structure metabolite sets (top 25) with enrichment ratio (Fig. 3A). The main chemical groups with a higher p-value were defined as amino acids and peptides, fatty acids and conjugates, TCA acids, organic carboxylic acids, benzoic acids, cinnamic acids, monosaccharides, fatty amides, phenylacetic acid, phenols, pyrimidines, cyclohexylamines, phenylpropanoids, purines, flavonoids, and pyridines. The colors in the interactive pie chart designate each chemical group relative to the total number of compounds (Fig. 3B). Among the 15 chemical groups, amino acids and peptides, fatty acids and conjugates, flavonoids, fatty acids, isoprenoids, organic dicarboxylic acids, and monosaccharides were pronounced as the dominant groups. The primary chemical compositions of blueberry include organic acids, phenolics (flavonoids, phenolic acids, proanthocyanidins, anthocyanidins, ellagitannins, stilbenes, and others), micro-nutrients, and terpenoids (Folmer et al., 2014; Forney et al., 2012). Previous studies also showed a high content of acids and phenolics in immature berries, whereas high levels of sugar compounds and anthocyanins in more developed and ripe berries (Forney et al., 2012).
Fig. 3.

(A) Dot plot and (B) Interactive pie chart of identified blueberry metabolites throughout the developmental stages based on metabolite set enrichment analysis (MSEA). This analysis refers to the over-representation analysis of 328 identified metabolites from all blueberry cultivars throughout the developmental stages. As all 328 metabolites were identified in all cultivars as well as all developmental stages, the over-representation analysis of MSEA represents the main chemical classes of metabolites set with enrichment ratio. For the over-representation analysis only HMDB ID of identified compounds are used without concentration. Colors in the bar plot describe the p-value. The red and orange colors dots signify the high and low values, respectively. The dot sizes indicate the enrichment ratio, which was computed by hits/expected, where hits = observed hits and expected = expected hits. The colors in the interactive pie chart designate each chemical group relative to the total number of compounds. (For interpretation of the references to color in this figure legend, the reader is referred to the web version of this article.)
Multivariate statistical analysis for all identified blueberry metabolites was performed to get the possible differences between the ‘Vernon’ and ‘Star’ cultivars throughout the different developmental stages. The principal component analysis (PCA) 2D score plot presented in Fig. 4A showed that the first and second principal components explained 89.6% and 5.5% of the variations, respectively. The ‘Vernon’ and ‘Star’ cultivars were deviated from each other and clustered depending on their similarities in developmental stages. At the same time, both cultivars showed close aggregation of stages-II and -III and segregation in stage-I. The PCA biplot analysis revealed that malic acid was the primary blueberry metabolite contributing to the ‘Vernon’ at the developmental stage-I (Fig. 4B). Moreover, oxalacetic acid, citric acid, and oxoglutaric acid were predominant contributors of the ‘Star’ at developmental stages-II and -III. Although all metabolites were identified in both cultivars at all developmental stages, the PCA analysis indicated that the differences in blueberry metabolites were mainly due to variations between cultivars, and to less extent, due to variations among developmental stages.
Fig. 4.

(A) PCA 2D score plot and (B) Biplot of the blueberry metabolites throughout the developmental stages. (C) Visualization of top 20 FC metabolite patterns by volcano plot between ‘Vernon’ vs v’Star’ at developmental (C) stage-I, (D) stage-II, and (E) stage-III. In the 2D score plot, the red color of the oval, triangle, and cross shape represents Star-SI, Star-SII, and Star-SIII; and blue color represents Vern-SI, Vern-SII, and Vern-SIII. The different short abbreviations in the biplot manifest the scores of the observations (i.e., blueberry developmental stages). The vectors that point toward the same direction correspond to the variables (i.e., metabolites) with similar response profiles. Vern-SI: ‘Vernon’ cultivar at the green color stage; Vern-SII: ‘Vernon’ cultivar at the turning pigmentation stage; Vern-SIII: ‘Vernon’ cultivar at the ripe stage; Star-SI: ‘Star’ cultivar at the green color stage; Star-SII: ‘Star’ cultivar at the turning pigmentation stage; Star-SIII: ‘Star’ cultivar at the ripe stage. In the Volcano Plot analysis, Bluish bars on the right side: up-regulated metabolites, and bluish bars on the left side: down-regulated metabolites. (For interpretation of the references to color in this figure legend, the reader is referred to the web version of this article.)
Volcano plot analysis was performed between ‘Vernon’ vs. ‘Star’ at each developmental stage to determine the fold change differences in blueberry metabolites. The results indicated that, at developmental stage-I, 121 metabolites were significantly up-regulated, 62 metabolites were substantially down-regulated, and 144 metabolites were insignificantly altered in ‘Vernon’ than ‘Star’. Among them, the top 20 most upregulated metabolites were epiafzelechin 3-gallate, lucuminic acid, naringin, eujambolin, luteolin, kaempferol, quercetin 3-arabinoside, kaempferol 3-xylosylglucoside, tridecanoic acid, and neoglucobrassicin (Fig. 4C). In contrast, isochesnatin, 2-isopropyl citrate, kojic acid, gallic acid, myricetin 3-galactoside 2-furoic acid, 2-methyla-conitate, 5-hydroxy-2-furoic acid, 2,5-furandicarboxylic acid, succinic acid, 2-furoic acid, and aconitic acid were the most down-regulated metabolites (Fig. 4C). However, in developmental stage-II, 120 metabolites were significantly up-regulated, 64 were considerably down-regulated, and 143 were insignificantly changed in ‘Vernon’ compared to ‘Star’. As shown in Fig. 4D, lucuminic acid, epiafzelechin 3-gallate, delphinidin 3-sophoroside, tridecanoic acid, theaflavic acid, N-glyco-lylneuraminic acid, kaempferol, prostaglandin B1, naringin, and p-cymene were computed as the top up-regulated metabolites in the developmental stage II; whereas protohypericin, L-agaritine, kojic acid, 4-pyridoxic acid, gallic acid, isochesnatin, 2-methylaconitate, 2-isopropyl citrate, 2,5-furandicarboxylic acid, and cysteine were the top downregulated metabolites. Finally, the metabolic profiling of the developmental stage-III displayed 109 significantly up-regulated, 67 noticeably down-regulated, and 151 insignificantly modified metabolites in ‘Vernon’ compared to ‘Star’. As presented in Fig. 4E, lucuminic acid, epiafzelechin 3-gallate, delphinidin 3-sophoroside, quercetin 3-arabinoside, naringin, isorhamnetin, 5-hydroxyindoleacetic acid, theaflavic acid, prostaglandin B1, and eujambolin were noted as the most upregulated metabolites; whereas, protohypericin, 4-pyridoxic acid, L- agaritine, benzaldehyde, gallic acid, kojic acid, eicosapentaenoic acid, 3-trans-p-coumaroylrotundic acid, 2-methylaconitate, and 2,5-furandi- carboxylic acid were the most down-regulated metabolites. Interest- ingly, three common metabolites, epiafzelechin 3-gallate, lucuminic acid, and naringin, were significantly up-regulated at every developmental stage of ‘Vernon’. Epiafzelechin 3-gallate and naringin belong to the flavonoid class, whereas lucuminic acid belongs to o-glycosyl compounds. In addition, kaempferol and tridecanoic acid at developmental stages-I and -II; eujambolin and quercetin 3-arabinoside at developmental stages-I and -III were identified as the commonly up-regulated metabolites. However, delphinidin 3-sophoroside, theaflavic acid, and prostaglandin B1 were the widely up-regulated metabolites at developmental stages-II and -III. In contrast, gallic acid, kojic acid, 2,5-furan-dicarboxylic acid, 5-hydroxy-2-furoic acid, 2-methylaconitate, and myricetin 3-galactoside were the commonly down-regulated metabolites found at every developmental stage.
3.4. Screening of biomarker metabolites and their correlation with anticancer activities
Partial least squares-discriminant analysis (PLS-DA) was performed among 328 identified blueberry metabolites in ‘Vernon’ and ‘Star’ throughout all developmental stages to obtain biomarker metabolites according to variable importance in projection (VIP) scores. As shown in Fig. 5A, PLS-DA analysis computed a total of 17 biomarker blueberry metabolites (VIP 1.0) throughout developmental stages. These biomarker metabolites were quinic acid, methylsuccinic acid, citric acid, oxalacetic acid, malic acid, oxoglutaric acid, oxoadipic acid, lysine, 2-furoic acid, 2-methylcitric acid, pipecolic acid, 2-methylaconitate, 5-hydroxy-2-furoic acid, glucosamine, aconitic acid, L-arginine, and chlorogenic acid. Interestingly, metabolites with a high VIP score (>1.0) determined throughout the developmental stages (presented in Fig. 5A) were also commonly found in each developmental stage (Table S4).
Fig. 5.
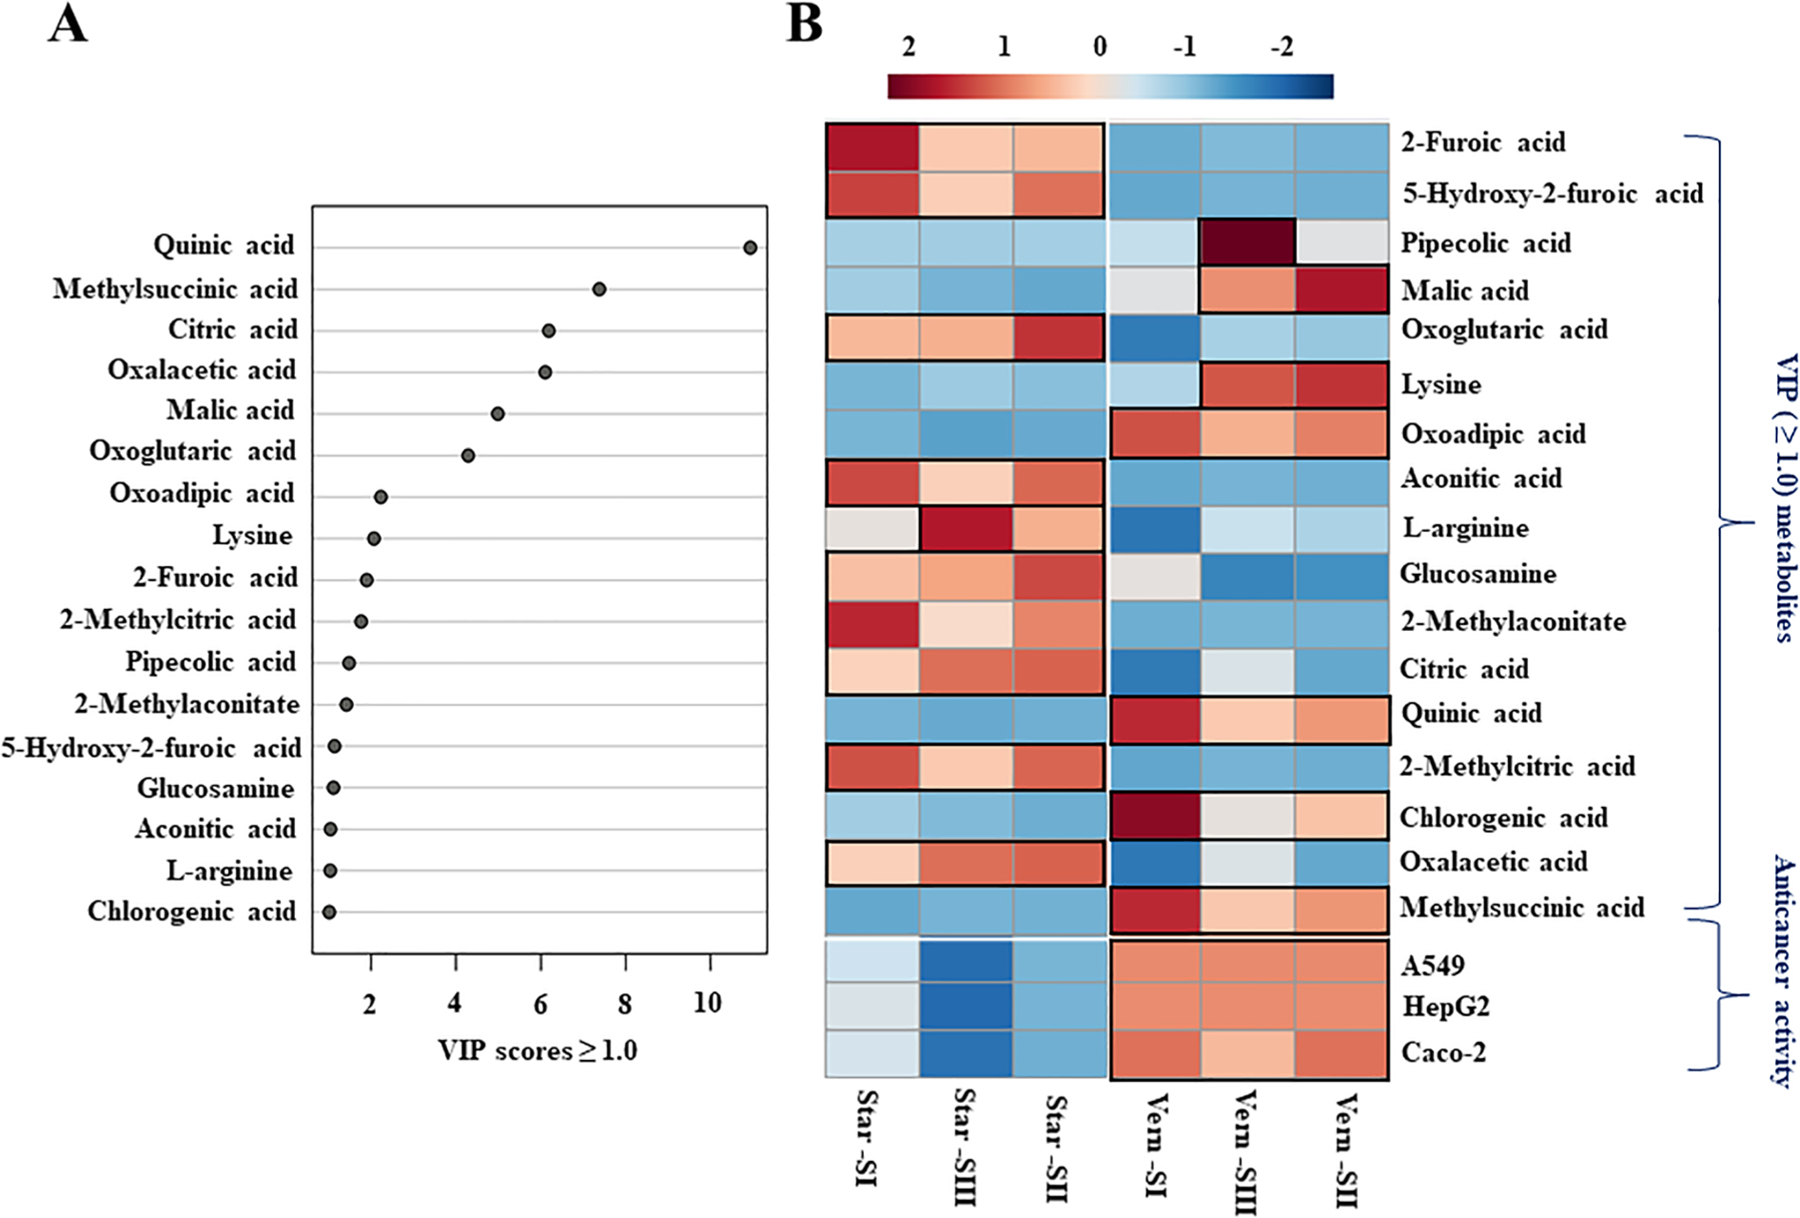
(A) Variable importance in projection (VIP ≥ 1.0) measure in PLS-DA and (B) Heatmap of VIP (score ≥ 1.0) metabolites and anticancer activities of ‘Vernon’ and ‘Star’ among all developmental stages. In Heatmap analysis, each column refers to the blueberry cultivars at developmental stages, each row indicates the metabolites and anticancer activities, the red and blue colors with values (ranged from –2 to +2) describe the higher and lower metabolites intensities and anticancer potentialities, the higher the red color intensity (from +1 to +2 values), the higher the metabolite contents and anticancer activities. In contrast, the higher blue color intensity (from –1 to –2 values) represents the lower metabolite contents and anticancer activities. Vern-SI: ‘Vernon’ cultivar at the green color stage; Vern-SII: ‘Vernon’ cultivar at the turning pigmentation stage; Vern-SIII: ‘Vernon’ cultivar at the ripe stage; Star-SI: ‘Star’ cultivar at the green color stage; Star-SII: ‘Star’ cultivar at the turning pigmentation stage; Star-SIII: ‘Star’ cultivar at the ripe stage; A549: lung cancer cell line; HepG2: liver cancer cell line; Caco-2: colon cancer cell line. (For interpretation of the references to color in this figure legend, the reader is referred to the web version of this article.)
The heatmap analysis of the identified biomarker compounds and anticancer activities was performed as presented in Fig. 5B. The results indicated a clear visualization of the cultivar variations in blueberry metabolite’s relative content and anticancer potentialities. In contrast, developmental stage variation in terms of anticancer potential was not very significant. The anticancer potentials were observed for ‘Vernon’ at all stages against A549, HepG2, and Caco-2 cancer cells. The developmental stage-I and -II showed slightly higher anticancer activity than stage-III against Caco-2 cells, but no apparent differences were observed among developmental stages against A549 and HepG2 cancer cells. In addition, the higher intensities of quinic acid, chlorogenic acid, methylsuccinic acid, and oxoadipic acid were perceived in ‘Vernon’ at every developmental stage. While lysine and malic acid were higher in developmental stages-II and -III, pipecolic acid was dominant in the developmental stage-III.
In ‘Star’, the primary metabolites with higher effect were oxalacetic acid, 2-methylcitric acid, citric acid, 2-methylaconitate, glucosamine, L-arginine, aconitic acid, oxoglutaric acid, 5-hydroxy-2-furoic acid, and 2-furic acid throughout the different developmental stages. Surprisingly, no overlapping metabolites with higher intensities were observed between ‘Vernon’ and ‘Star’ at any developmental stage. In contrast, no anticancer activities were followed by ‘Star’ at every developmental stage. Accordingly, our results suggest that the higher anticancer activity of the ‘Vernon’ cultivar could be due to its higher content of the identified biomarker metabolites compared to ‘Star’.
To identify the most striking differences between ‘Vernon’ and ‘Star’ related to their metabolite profiles and anticancer activities, we performed Pearson’s correlation analysis between the 17 identified biomarker compounds (VIP ≥ 1.0) anticancer activities. As presented in Fig. 6A, clear visualization of positive correlations was observed between particular blueberry metabolites and the anticancer activity against the three cancer cell lines. The results notably revealed 5 metabolites with higher anticancer possibility, including chlorogenic acid, oxoadipic acid, quinic acid, methylsuccinic acid, and malic acid. The ability of chlorogenic acid in suppressing the growth of cancer cells has been reported (Lukitasari, Nugroho, & Widodo, 2018). Several studies have also described the positive role of quinic acid and its derivatives as potential anticancer compounds (Liu, Zhang, Yu, & Su, 2015; Murugesan et al., 2020; Singh, Chauhan, & Tripathi, 2018). The relative content of quinic acid and the other four-biomarker metabolites in each of the two cultivars was also presented in Fig. 6B. Apparently, ‘Vernon’ contains significantly higher relative contents of each biomarker metabolites at every developmental stage. Among these biomarker metabolites, quinic acid was affirmed to be the dominant metabolite, followed by methylsuccinic acid, chlorogenic acid, oxoadipic acid, and malic acid, in that order. Quinic acid, malic acid, succinic acid, and adipic acids are present as the organic acid compounds in blueberries (Forney et al., 2012; Fu, Zhang, He, Yue, & Gao, 2015). Chlorogenic acid is the predominant phenolic acid in highbush blueberries (Kang, Thakali, Jensen, & Wu, 2015). In this study, all these metabolites, except malic acid, showed declining levels as berries move toward maturity and ripening, particularly in ‘Vernon’. The decline of blueberry organic acids toward ripening was also previously reported (Forney et al., 2012).
Fig. 6.

(A) Pearson correlations and (B) The relative contents (MAU.s) of biomarker metabolites displaying higher positive correlation with anticancer activities of ‘Vernon’ and ‘Star’ among all developmental stages. Pearson correlations were performed between VIP (score ≥ 1.0) metabolites computed among all developmental stages and anticancer activities against A549 (lung cancer cell line), HepG2 (liver cancer cell line), and Caco-2 (colon cancer cell line).
4. Conclusion
In this study, we investigated and reported the variations in total phenolics, flavonoids, anthocyanins, antioxidant activity, anticancer potentiality, and untargeted metabolite profiles among eight blueberry cultivars and three berry developmental stages. Our results collectively indicated that the cultivar variations rather than the berry developmental stage explain most of the variations among blueberry extracts. Among the eight cultivars we tested in this study, ‘Vernon’ and ‘Star’ blueberries were the highest and the lowest cultivars in nutraceutical value, respectively. Our results also confirmed that immature berries (developmental stage 1) contain higher phenolics and flavonoids levels as well as a higher antioxidant and anticancer activity than mature and ripe fruits (i.e., developmental stages-II and -III). The untargeted metabolite profiling revealed that the chemical composition of blueberry extracts is predominated by organic acids, fatty acids, flavonoids, isoprenoids, and monosaccharides. We also demonstrated that blueberry extracts had great potential for cell growth inhibitory capabilities using three different cancer cell lines. Using the multivariate statistical analysis, we identified five blueberry biomarker metabolites, quinic acid, methylsuccinic acid, chlorogenic acid, oxoadipic acid, and malic acid, that exhibited higher positive correlations with anticancer activities against all tested cancer cell lines. The relative contents of these biomarker metabolites were also found to be significantly higher in ‘Vernon’ than that of ‘Star’; and in developmental stage-I than developmental stage-II and -III. The changes in blueberry bioactivities during developmental stages could be attributed to the transformation of metabolites to other forms as berries progress toward maturity and ripening. Overall, the present study provides a framework to understand the cultivar- and developmental stage-variations in untargeted metabolite profiles, antioxidant, and anticancer activities. The biomarker metabolites identified in this study and their demonstrated anticancer activities are anticipated to be of great value to several entities in the food, pharmaceutical, nutraceutical sectors, as well as plant breeders and biotechnologies to develop new germplasm with enhanced anticancer potentials.
Supplementary Material
Acknowledgment
We want to express our deep and sincere gratitude to the Viticulture Advisory Council (VAC), Florida Grape Growers Association (FGGA), and the Muscadine Products Corporation for their continues support.
Funding:
This work was supported by the 1890 Institution Teaching, Research, and Extension Capacity Building Grants (CBG) Program (grant no. 2020–38821-31086; project accession no. 1021741) from the USDA National Institute of Food and Agriculture.
Footnotes
CRediT authorship contribution statement
Protiva Rani Das: Conceptualization, Investigation, Methodology, Formal analysis, Validation, Formal analysis, Writing – original draft, Visualization. Ahmed G. Darwish: Conceptualization, Investigation, Methodology, Formal analysis, Validation, Formal analysis, Writing – original draft, Visualization. Ahmed Ismail: Formal analysis. Amr M. Haikal: Formal analysis. Pranavkumar Gajjar: Methodology, Investigation, Formal analysis. Subramani Paranthaman Balasubramani: Methodology, Investigation, Formal analysis. Mehboob B. Sheikh: Methodology, Investigation, Formal analysis. Violeta Tsolova: Conceptualization, Writing – review & editing. Karam F.A. Soliman: Conceptualization, Writing – review & editing. Sherif M. Sherif: Conceptualization, Supervision, Visualization, Writing – review & editing. Islam El-Sharkawy: Conceptualization, Methodology, Validation, Formal analysis, Resources, Data curation, Writing – review & editing, Visualization, Supervision, Project administration, Funding acquisition.
Declaration of Competing Interest
The authors declare that they have no known competing financial interests or personal relationships that could have appeared to influence the work reported in this paper.
Appendix A. Supplementary data
Supplementary data to this article can be found online at https://doi.org/10.1016/j.foodchem.2021.131632.
References
- Aravind SM, Wichienchot S, Tsao R, Ramakrishn S, & Chakkaravarthi S (2021). Role of dietary polyphenols on gut microbiota, their metabolites and health benefits. Food Research International, 142, Article 110189. [DOI] [PubMed] [Google Scholar]
- Castrejón ADR, Eichholz I, Rohn S, Kroh LW, & Huyskens-Keil S (2008). Phenolic profile and antioxidant activity of highbush blueberry (Vaccinium corymbosum L.) during fruit maturation and ripening. Food Chemistry, 109(3), 564–572. [Google Scholar]
- Chang CC, Yang MH, Wen HM, & Chern JC (2002). Estimation of total flavonoid content in propolis by two complementary colorimetric methods. Journal of Food and Drug Analysis, 10, 178–182. [Google Scholar]
- Concetta TM, Antonioc MG, Marcoa B, Rosariac A, Rosaa LM, Annabelleb D, … Brigitteb D (2020). LC-ESI-QTOF-MS profiling, protective effects on oxidative damage, and inhibitory activity of enzymes linked to type 2 diabetes and nitric oxide production of Vaccinium corymbosum L. (Ericaceae) extracts. Journal of Berry Research, 10(4), 603–622. [Google Scholar]
- Darwish AG, Das PR, Ismail A, Gajjar P, Balasubramani SP, Sheikh MB, … El-Sharkawy I (2021). Untargeted metabolomics and antioxidant capacities of muscadine grape genotypes during berry development. Antioxidants, 10(6), 914. 10.3390/antiox10060914 [DOI] [PMC free article] [PubMed] [Google Scholar]
- Darwish AGG, Samy MN, Sugimoto S, Otsuka H, Abdel-Salam H, & Matsunami K (2016). Effects of hepatoprotective compounds from the leaves of Lumnitzera racemosa on acetaminophen-induced liver damage in vitro. Chemical and Pharmaceutical Bulletin (Tokyo), 64, 360–365. [DOI] [PubMed] [Google Scholar]
- Das PR, Kim Y, Hong S-J, & Eun J-B (2019). Profiling of volatile and non-phenolic metabolites–Amino acids, organic acids, and sugars of green tea extracts obtained by different extraction techniques. Food Chemistry, 296, 69–77. [DOI] [PubMed] [Google Scholar]
- Eichholz I, Huyskens-Keil S, & Rohn SC (2015). 21 – Blueberry Phenolic Compounds: Fruit Maturation, Ripening, and Post-Harvest Effects. Processing and Impact on Active Components in Food, Edited by: Victor Preedy. Academic Press. [Google Scholar]
- Folmer F, Basavaraju U, Jaspars M, Hold G, El-Omar E, Dicato M, & Diederich M (2014). Anticancer effects of bioactive berry compounds. Phytochemistry Reviews, 13 (1), 295–322. [Google Scholar]
- Forney CF, Kalt W, Jordan MA, Vinqvist-Tymchuk MR, Sherry AE, & Fillmore SAE (2012). Blueberry and cranberry fruit composition during development. Journal of Berry Research, 2, 169–177. [Google Scholar]
- Fu H, Zhang L, He B, Yue P, & Gao X (2015). Analysis of organic acids in blueberry juice and its fermented wine by high-performance liquid chromatography. Advance Journal of Food Science and Technology, 9, 127–134. [Google Scholar]
- Giusti MM, & Wrolstad RE Characterization and measurement of anthocyanins by UV-visible spectroscopy. In Current Protocols in Food Analytical Chemistry; Wrolstad RE, Acree TE, An H, Decker EA, Penner MH, Reid DS, Schwartz SJ, Shoemaker CF, Sporns P, Eds.; Wiley: New York, 2001; pp F1.2.1–F1.2.13. [Google Scholar]
- Gündüz K, Serçe S, & Hancock JF (2015). Variation among highbush and rabbiteye cultivars of blueberry for fruit quality and phytochemical characteristics. Journal of Food Composition and Analysis, 38, 69–79. [Google Scholar]
- Jaakola L, Määttä K, Pirttilä AM, Törrönen R, Kärenlampi S, & Hohtola A (2002). Expression of structural genes involved in anthocyanin biosynthesis in relation to anthocyanin and flavonoid levels during bilberry (Vaccinium myrtillus L.) fruit development. Plant Physiology, 130, 729–739. [DOI] [PMC free article] [PubMed] [Google Scholar]
- Jiang Y, Fang Z, Leonard W, & Zhang P (2021). Phenolic compounds in Lycium berry: Composition, health benefits and industrial applications. Journal of Functional Foods, 77, 104340. 10.1016/j.jff.2020.104340 [DOI] [Google Scholar]
- Jiao X, Wang Y, Lin Y, Lang Y, Li E, Zhang X, … Li B (2019). Blueberry polyphenols extract as a potential prebiotic with anti-obesity effects on C57BL/6 J mice by modulating the gut microbiota. The Journal of Nutritional Biochemistry, 64, 88–100. [DOI] [PubMed] [Google Scholar]
- Kalt W, Lawand C, Ryan D, McDonald JE, & Donner H (2003). Oxygen radical absorbing capacity, anthocyanin, and phenolic content of highbush blueberries (Vaccinium corymbosum L.), during ripening and storage. Journal of the American Society for Horticultural Science, 128, 917–923. [Google Scholar]
- Kang J, Thakali KM, Jensen GS, & Wu X (2015). Phenolic acids of the two major blueberry species in the US market and their antioxidant and anti-inflammatory activities. Plant Foods for Human Nutrition, 70(1), 56–62. [DOI] [PubMed] [Google Scholar]
- Lee L-S, Kim S-H, Kim Y-B, & Kim Y-C (2014). Quantitative analysis of major constituents in green tea with different plucking periods and their antioxidant activity. Molecules, 19(7), 9173–9186. [DOI] [PMC free article] [PubMed] [Google Scholar]
- Li D, Li B, Ma Y, Sun X, Lin Y, & Meng X (2017). Polyphenols, anthocyanins, and flavonoids contents and the antioxidant capacity of various cultivars of highbush and half-high blueberries. Journal of Food Composition and Analysis, 62, 84–93. [Google Scholar]
- Liu ZH, Zhang SY, Yu YY, & Su GQ (2015). (−)-4-O-(4-O-β-D-glucopyranosylcaffeoyl) quinic acid presents antitumor activity in HT-29 human colon cancer in vitro and in vivo. Molecular & Cellular Toxicology, 11(4), 457–463. [Google Scholar]
- Lourenço SC, Moldão-Martins M, & Alves VD (2019). Antioxidants of natural plant origins: From sources to food industry applications. Molecules, 24(22), 4132. 10.3390/molecules24224132 [DOI] [PMC free article] [PubMed] [Google Scholar]
- Lukitasari M, Nugroho DA, & Widodo N (2018). Chlorogenic acid: The conceivable chemosensitizer leading to cancer growth suppression. Journal of Evidence-Based Integrative Medicine, 23, 2515690X18789628. [DOI] [PMC free article] [PubMed] [Google Scholar]
- Mengist MF, Grace MH, Xiong J, Kay CD, Bassil N, Hummer K, … Iorizzo M (2020). Diversity in metabolites and fruit quality traits in blueberry enables ploidy and species differentiation and establishes a strategy for future genetic studies. Frontier in Plant Science, 11. 10.3389/fpls.2020.0037010.3389/fpls.2020.00370.s00110.3389/fpls.2020.00370.s002 [DOI] [PMC free article] [PubMed] [Google Scholar]
- Murugesan A, Holmstedt S, Brown KC, Koivuporras A, Macedo AS, Nguyen N, … Kandhavelu M (2020). Design and synthesis of novel quinic acid derivatives: In vitro cytotoxicity and anticancer effect on glioblastoma. Future Medicinal Chemistry, 12, 21. [DOI] [PubMed] [Google Scholar]
- Pinu F (2018). Grape and wine metabolomics to develop new insights using untargeted and targeted approaches. Fermentation, 4(4), 92. 10.3390/fermentation4040092 [DOI] [Google Scholar]
- Qian YL, Zhang D, An Y, Zhou Q, & Qian MC (2021). Characterization of aromaactive compounds in Northern Highbush blueberries “Bluecrop” (Vaccinium corymbosum “Bluecrop”) and “Elliott” (Vaccinium corymbosum “Elliott”) by gas chromatography–olfactometry dilution analysis and odor activity value. Journal of Agricultural and Food Chemistry, 69(20), 5691–5701. [DOI] [PubMed] [Google Scholar]
- Raudonė L, Liaudanskas M, Vilkickytė G, Kviklys D, Žvikas V, Viškelis J, & Viškelis P (2021). Phenolic profiles, antioxidant activity and phenotypic characterization of Lonicera caerulea L. berries, cultivated in Lithuania. Antioxidants, 10, 115. [DOI] [PMC free article] [PubMed] [Google Scholar]
- Scalzo J, Stevenson D, & Hedderley D (2015). Polyphenol compounds and other quality traits in blueberry cultivars. Journal of Berry Research, 5(3), 117–130. [Google Scholar]
- Singh A, Chauhan SS, & Tripathi V (2018). Quinic acid attenuates oral cancer cell proliferation by downregulating cyclin D1 Expression and Akt signaling. Pharmacognosy Magazine, 14, 14. [Google Scholar]
- Siriwoharn T, Wrolstad RE, Finn CE, & Pereira CB (2004). Influence of cultivar, maturity, and sampling on blackberry (Rubus L. Hybrids) anthocyanins, polyphenolics, and antioxidant properties. Journal of Agricultural and Food Chemistry, 52, 8021–8030. [DOI] [PubMed] [Google Scholar]
- Spinardi A, Cola G, Gardana CS, & Mignani I (2019). Variation of anthocyanin content and profile throughout fruit development and ripening of highbush blueberry cultivars grown at two different altitudes. Frontier in Plant Science, 10. 10.3389/fpls.2019.01045 [DOI] [PMC free article] [PubMed] [Google Scholar]
- Sun Y, Li M, Mitra S, Hafiz Muhammad R, Debnath B, Lu X, … Qiu D (2018). Comparative phytochemical profiles and antioxidant enzyme activity analyses of the southern highbush blueberry (Vaccinium corymbosum) at different developmental stages. Molecules, 23(9), 2209. 10.3390/molecules23092209 [DOI] [PMC free article] [PubMed] [Google Scholar]
- Tian J-L, Liao X-J, Wang Y-H, Si X.u., Shu C, Gong E-S, … Li B (2019). Identification of cyanidin-3-arabinoside extracted from blueberry as a selective protein tyrosine phosphatase 1B inhibitor. Journal of Agriculture and Food Chemistry, 67(49), 13624–13634. [DOI] [PubMed] [Google Scholar]
- Timmers MA, Grace MH, Yousef GG, & Lila MA (2017). Inter-and intra-seasonal changes in anthocyanin accumulation and global metabolite profiling of six blueberry genotypes. Journal of Food Composition and Analysis, 59, 105–110. [Google Scholar]
- Vvedenskaya IO, & Vorsa N (2004). Flavonoid composition over fruit development and maturation in American cranberry, Vaccinium macrocarpon Ait. Plant Science, 167(5), 1043–1054. [Google Scholar]
- Wang H, Cao X, Yuan Z, & Guo G (2021). Untargeted metabolomics coupled with chemometrics approach for Xinyang Maojian green tea with cultivar, elevation, and processing variations. Food Chemistry, 352, 129359. 10.1016/j.foodchem.2021.129359 [DOI] [PubMed] [Google Scholar]
- Wang Y, Fong SK, Singh AP, Vorsa N, & Johnson-Cicalese J (2019). Variation of anthocyanins, proanthocyanidins, flavonols, and organic acids in cultivated and wild diploid blueberry species. HortScience, 54(3), 576–585. [Google Scholar]
- Wang Y, Lin J, Tian J, Si X.u., Jiao X, Zhang W, … Li B (2019). Blueberry malvidin-3-galactoside suppresses hepatocellular carcinoma by regulating apoptosis, proliferation, and metastasis pathways in vivo and in vitro. Journal of Agriculture and Food Chemistry, 67(2), 625–636. [DOI] [PubMed] [Google Scholar]
- Zifkin M, Jin A, Ozga JA, Zaharia LI, Schernthaner JP, Gesell A, … Constabel CP (2012). Gene expression and metabolite profiling of developing highbush blueberry fruit indicate transcriptional regulation of flavonoid metabolism and activation of abscisic acid metabolism. Plant Physiology, 158, 200–224. [DOI] [PMC free article] [PubMed] [Google Scholar]
Associated Data
This section collects any data citations, data availability statements, or supplementary materials included in this article.