Abstract
The exponential growth of the novel coronavirus disease (N-COVID-19) has affected millions of people already and it is obvious that this crisis is global. This situation has enforced scientific researchers to gather their efforts to contain the virus. In this pandemic situation, health monitoring and human movements are getting significant consideration in the field of healthcare and as a result, it has emerged as a key area of interest in recent times. This requires a contactless sensing platform for detection of COVID-19 symptoms along with containment of virus spread by limiting and monitoring human movements. In this paper, a platform is proposed for the detection of COVID-19 symptoms like irregular breathing and coughing in addition to monitoring human movements using Software Defined Radio (SDR) technology. This platform uses Channel Frequency Response (CFR) to record the minute changes in Orthogonal Frequency Division Multiplexing (OFDM) subcarriers due to any human motion over the wireless channel. In this initial research, the capabilities of the platform are analyzed by detecting hand movement, coughing, and breathing. This platform faithfully captures normal, slow, and fast breathing at a rate of 20, 10, and 28 breaths per minute respectively using different methods such as zero-cross detection, peak detection, and Fourier transformation. The results show that all three methods successfully record breathing rate. The proposed platform is portable, flexible, and has multifunctional capabilities. This platform can be exploited for other human body movements and health abnormalities by further classification using artificial intelligence.
Keywords: CFR, COVID-19, OFDM, SDR, USRP, breathing rate measurement
I. Introduction
In the past few years, viruses are spreading by human-to-human interaction, and COVID-19 is one of the deadly viruses. The exponential growth of COVID-19 isolates the whole human society. The competent authorities are taking the necessary steps to contain the COVID-19. Limitation of activities is not a viable solution because this may cause a shortage of food and other necessities of life. Researchers, doctors, and scientists all over the world are involved in diagnosis methods, vaccine development, and promising solutions to contain the spread of COVID-19. In this regard, human movements and health issues are getting considerable attention in the field of healthcare. Human movement recognition is the process of using different technologies to extract the features of the human movement [1]. It can be used for the monitoring of patients and vulnerable people such as the elderly or children. It can also be used to forecast and prevent many chronic diseases. The method for detecting vital signs can be used for monitoring and diagnosis of different medical issues. However, capturing information for human movements and health monitoring is still challenging. Many diverse technologies have been proposed from industry and academia sectors. These technologies are mainly divided into two categories, contact and contactless. Contact with body-based technology is considered as monitoring through wearable sensors that include the use of wearable devices such as smartphones or smartwatches having accelerometers sensors, which can provide the information to physicians. Contactless technologies are camera-based or Radio Frequency (RF) based. Camera-based monitoring includes the use of images or videos for human monitoring while RF-based technology uses changes in Wireless Channel State Information (WCSI) caused by human body motions. RF sensing-based technologies include Wi-Fi, radar, and SDR.
All these technologies have a tradeoff between advantages and limitations. Like, wearable sensors can be considered as an efficient technique as a source of rich information relating to human movement monitoring and health issues. Although wearable sensors are appropriate for normal situations, they are not a viable solution in pandemics and can become a cause of spreading viruses because of their direct interaction with the human body. The patients may also forget to wear wearable sensors. Some patients may interact with people with skin diseases, and infants are also discouraged from wearing such sensors [2]. Similarly, camera-based human monitoring technologies developed in [3] provides good results, but difficult to be installed in bedrooms and bathrooms due to privacy concerns. These technologies also fail in the monitoring of blind spots. In the case of Wi-Fi sensing, it is easily available and low cost but having limitations like flexibility and portability. On the other hand, radar technology is widely used in military resources, shows advantages such as accurate localization, coverage, and vital signs monitoring, but has various limitations like infrastructure deployment, spectrum licensing, and cost of equipment [4]. SDR offers a better solution in terms of cost and performance, as it provides flexible, cost-effective, and portable solutions, due to its software-based modification without changing the hardware [5]. The SDR-based platform can not only be used for human activity monitoring, but it can also be a viable solution for numerous health issues due to its scalable, and flexible hardware [6]. This platform offers a simple framework for experimentation rather than developing complex systems for functionality testing. Contactless technologies for monitoring human movements and health work in a contactless way and maybe one of the solutions for containing the spread of viruses. This technology is still in the initial stages of the research and needs further investigation to meet the challenges of the wireless channel and become a promising solution to monitor human movements and health.
A. Contributions and Novelty
In this research, Universal Software-defined Radio Peripheral (USRP) and LabVIEW are used as SDR platform to build a dataset of the WCSI from human movements. The research work contributes to the development of a contactless sensing platform for the detection of COVID-19 symptoms using SDR technology. This research will help in the containment of spreading the virus by monitoring human activities and early diagnosis of COVID symptoms such as breathing and coughing. The SDR technology provides flexibility, portability, multifunctionality, and a low-cost solution.
This platform can successfully detect large-scale movements like hand waving and small-scale movements like breathing and coughing. In addition, breathing rate measurement is validated by three different methods for normal, slow, and fast breathing. These three methods include zero-cross detection, peak detection, and Fourier transformation.
II. Literature Review
In this section, various contactless wireless sensing-based technologies for human movements and health issues are presented.
A. Human Movement Monitoring
Human activities recognition in indoor environments is performed by using an ambient radar sensor having a 7.8 GHz frequency. This platform classifies various human activities of individuals [7]. A low-power radar sensor is used for kitchen activity detection for fifteen different activities [8]. In [9], spectrogram image data acquired by radar is used to recognize and classify different falls for elderly people.
Using commercial Wi-Fi, [10] established a contactless Passive detection of moving humans with a Dynamic Speed (PADS) platform to identify different activities. A Through the Wall (TTW) presence detection system for humans is designed by [11], to extract CFR by using Wi-Fi signals. Wi-Fi-based Gesture Recognition system (Wi-GeRs) is used to observe and classify different hand movements by analyzing variations in CSI of Wi-Fi signals [12]. While [13] proposed a system to recognize different eating activities. Using Wi-Fi technology, a system is developed for User Identification System for Mobile Devices (UISMD) [14]. By combining the techniques of signal processing, edge computing, and machine learning (ML), a Sleep-Guardian system is developed, by using RF-based sensing [15]. Wi-Fi run system is developed for step estimation using CSI dynamics in the activity area [16].
The SDR-based contactless system is established for recognizing different human actions such as running, crawling and standing, etc. [17]. Similarly, [18] deployed entire-home gesture recognition by exploiting SDR technology. The SDR-based system is developed for hearing different human speech [19].
B. Human Health Monitoring
Passive Doppler radar platform used for human breathing detection and classification in [20]. Passive-Doppler radar platform [21] is also used to detect human movements and respiration. Vital signs monitoring and postures recognition during sleep is done using Wi-Fi signals [22]. Res-Beat developed for monitoring of respiration rate [23]. C-Band sensing techniques are used by Shah, S.A et. al for different health monitoring issues like tremors, breathing detection, and Chronic Obstructive Pulmonary Disease Warning respectively [24]–[25]. Shah, S.A et.al also developed a platform using S-band sensing techniques for several different health monitoring problems like cerebellar dysfunction patients motion assessment, pill-rolling assessment, seizure episodes detection respectively [26]–[28]. The SDR platform in [29], with Convolutional Neural Networks (CNN) model, is developed to differentiate various ankle movements. Similarly, SDR technology is also used for classifying different human weightlifting activities [30]. Recently, different machine learning and deep learning models are being used for COVID-19 prediction and diagnosis through radiographic imaging [31]–[35]. Summary of human activities and health monitoring of various non-contact sensing is given in Table I.
TABLE I. Literature Review Summary for Human Movements and Health Monitoring.
| Sr. # | Tech. | Human Movement Monitoring | Health Issues Monitored |
|---|---|---|---|
| 1. | Radar | Human activities recognition [7]–[9] | Respiration symptoms monitoring [20], [21] |
| 2. | Wi-Fi | Humans movement detection with Dynamic Speeds [10]
Through-The-Wall Detection [11] Human activity and fall recognition [32] Gesture recognition system [12] Different eating activities detection [13] User identification system [14] Human monitoring during Sleep [15] Step estimation [16] |
Respiration symptoms monitoring [1]
Monitoring vital signs and postures during sleep [22] Respiration rate monitoring [23] Detect tremors and breathing activity [24] Chronic obstructive pulmonary disease warning [25] Cerebellar dysfunction patients motion assessment [26] Pill-rolling assessment [27] Seizure episodes detection [28] |
| 3. | SDR | Human activities detection [17]
Different gesture recognition [18] Different human speech recognition [19] |
Fractured post-surgery ankle monitoring [29]
Monitoring of post-surgery weightlifting activities [30] |
III. Proposed Platform
The proposed platform consists of host PCs, SDR devices, and Omni-directional antennas. Each SDR device is attached to a host PC via a gigabit Ethernet port and a single antenna. The SDR devices used for experiments are Universal Software Radio Peripheral (USRP) model 2922 and the software is Laboratory Virtual Instrument Workbench (LabVIEW). There are three major functional blocks of the platform which are the transmitter, wireless channel, and receiver as shown in figure 1.
Fig. 1.
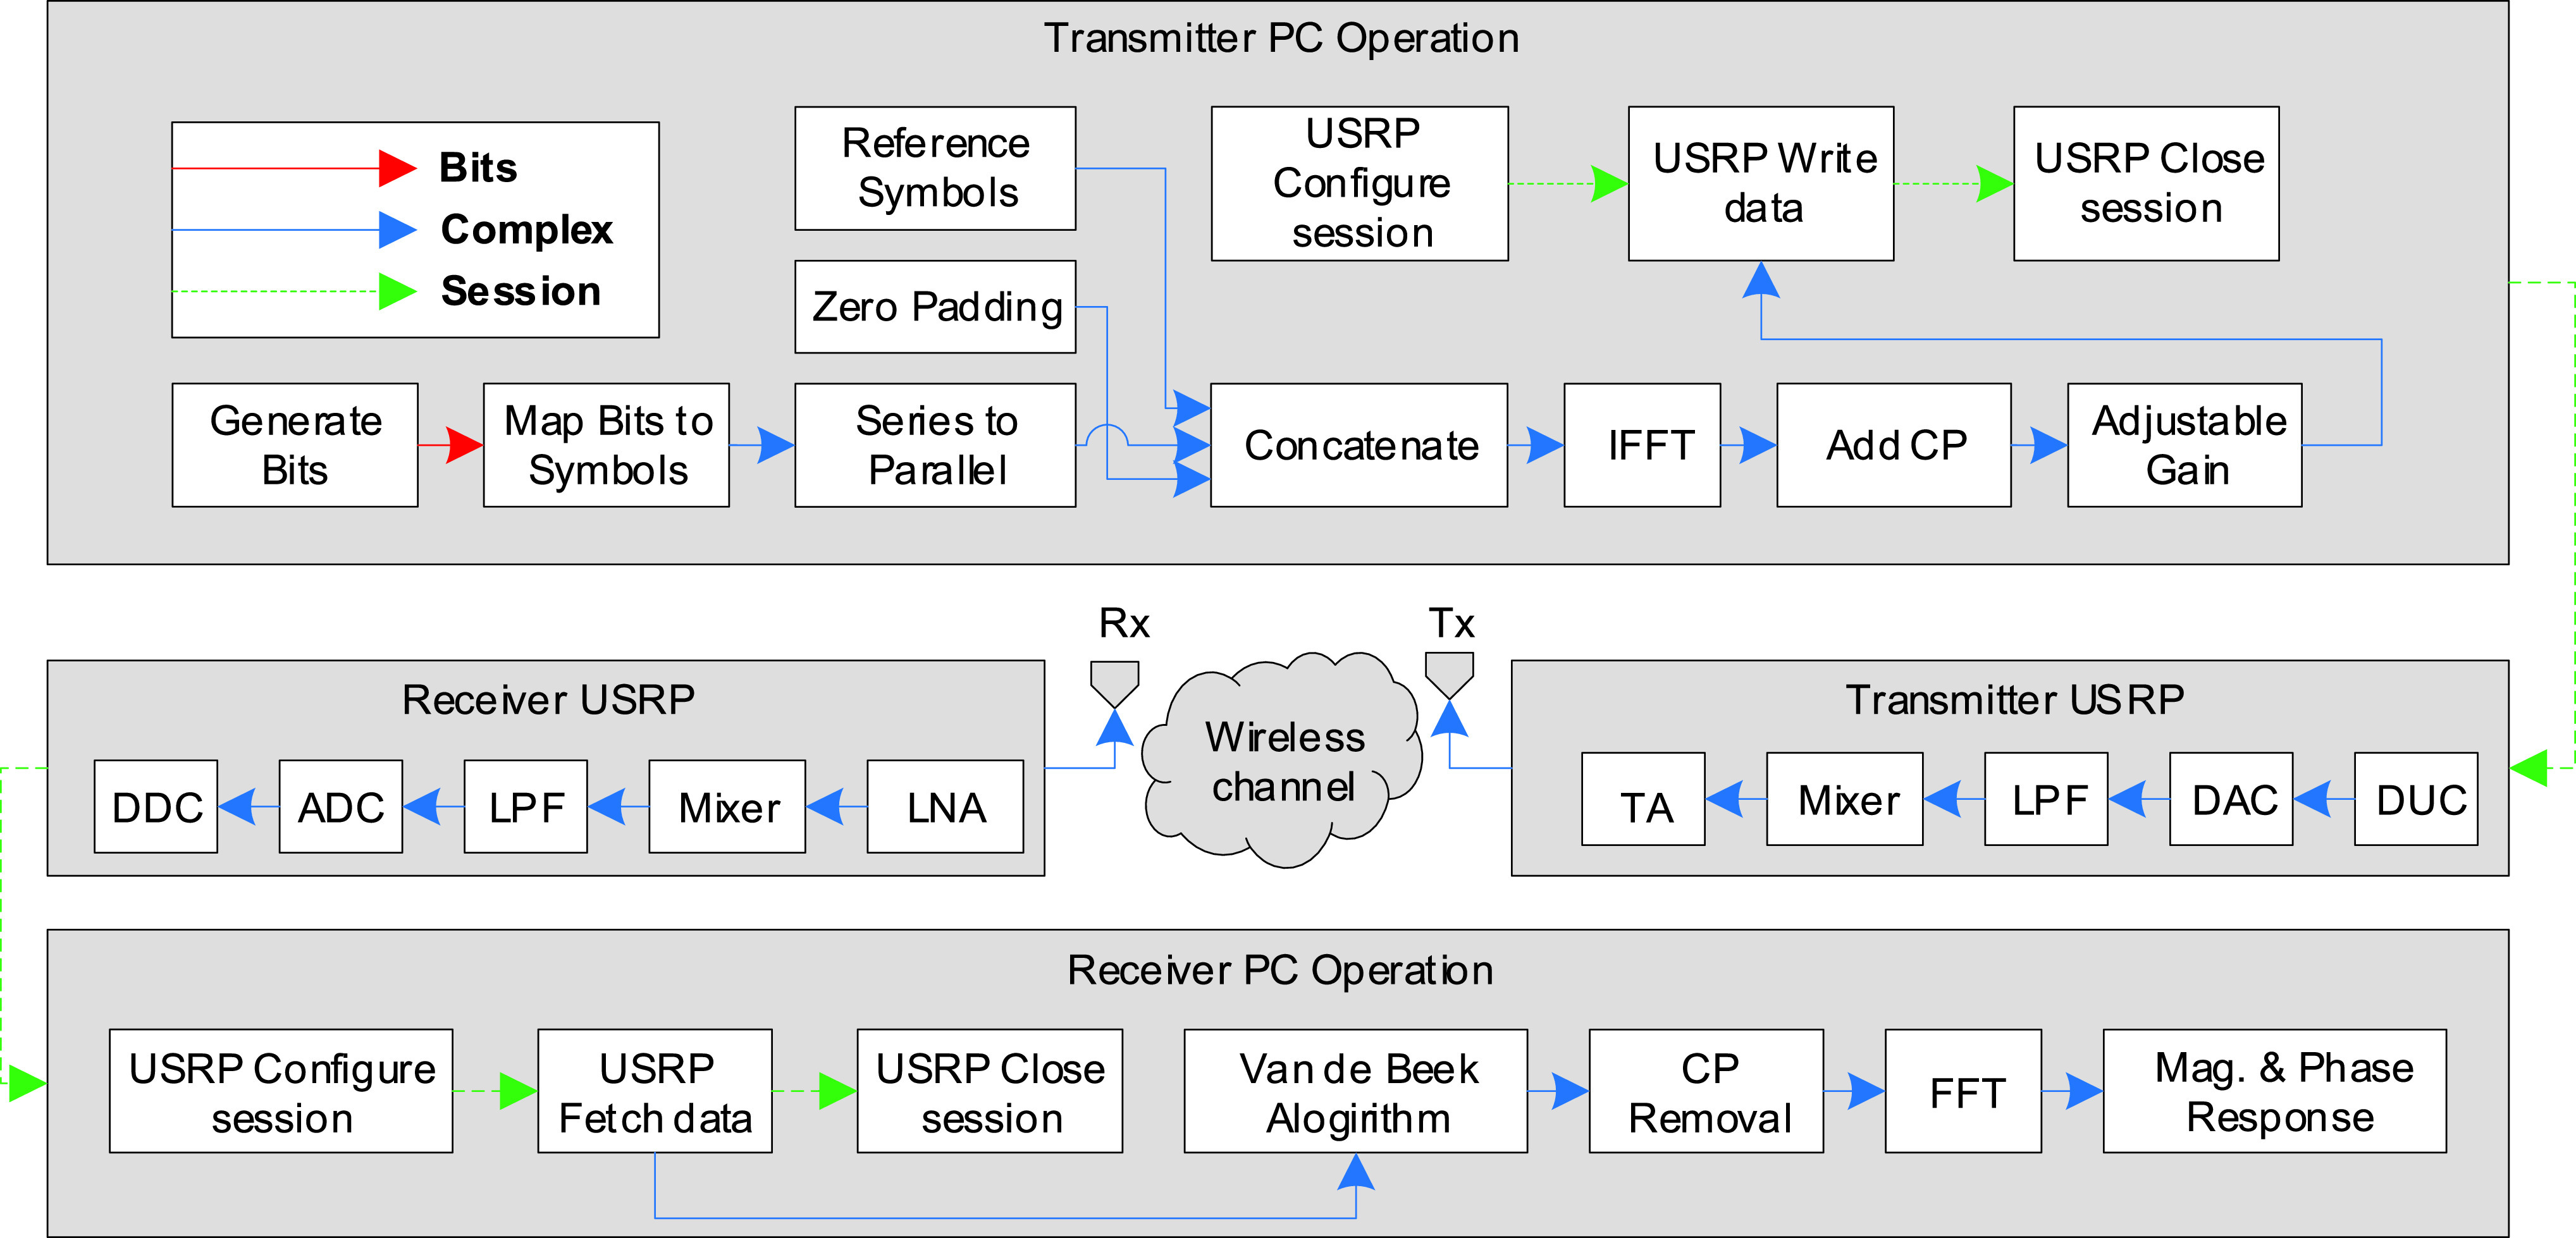
Proposed platform overview.
A. Transmitter
Pseudorandom (PN) data bits are generated and mapped to Quadrature Amplitude Modulation (QAM) symbols. These QAM symbols are split into parallel streams. Reference data symbols are concatenated in each parallel frame. These reference symbols are useful on the receiver side to estimate the channel. Zeros are inserted at edges and 1 zero at DC of each frame. After zero paddings, Inverse Fast Fourier Transform (IFFT) operation is applied to convert N-points frequency domain signals to N-points time-domain signal. L point cyclic prefix is inserted by duplicating the last one-fourth points at the beginning for the transmission of OFDM Frame. Now each frame has L+N samples. The data which is synthesized by host PC is sent to USRP kit through gigabit Ethernet cable using USRP write data block in LabVIEW. Host PC contains USRP driver software blocks, which are used to modify and control carrier frequency, In-phase, and Quadrature (IQ) rate and gain of the device.
Now baseband complex signal samples are synthesized by the host PC and fed to the USRP-2922 at a rate of 20 MS/s over Gigabit Ethernet cable. The USRP hardware interpolates the incoming signal to 400 MS/s using a digital up-conversion (DUC) process and then converts the signal to analog with a digital-to-analog converter (DAC). The resulting analog signal is passed through a 20 MHz low pass filter. After that, it is mixed up to the specified carrier frequency. After that signal is passed through the transmitting amplifier, where its gain can be adjusted between 0-30dB.
B. Channel
The real-time wireless channel is considered for the development of the platform to monitor human movement and health. Wireless channel has abundant information about the environment. Therefore, different methods are adopted to extract useful information from the wireless channel in the literature. In this research, CFR is used for analyzing the WCSI.
CFR is calculated by using (1):
 |
where
 is CFR,
 and
and
 are transmitted and received signals in the frequency domain respectively. Since
 is a complex value, so we can extract the amplitude response given in (2):
 |
whereas,
 and
and
 are the real and imaginary part of the CFR.
The CFR amplitude of single experiment E using multiple OFDM frames are express in the (3).
 |
whereas
 is used for the total number of subcarriers, and
 is used for the total number of OFDM frames received for a single E.
C. Receiver
The signal on the receiver side is first received by the USRP kit through the antenna. After this signal is passed through a Low Noise Amplifier (LNA) which reduces noise, then this signal is passed through a Drive Amplifier (DA), which is used to adjust the gain of the received signal. After that signal is mixed using a Direct Conversion Receiver (DCR) to baseband complex signal. This complex signal is passed through a 20 MHz Low Pass Filter (LPF), which is then sampled by a 2-channel, 100 MS/s, Analog-To-Digital Converter (ADC). The digitized complex signal follows parallel paths through a Digital down Conversion (DDC) process that mixes, filters, and decimates the input 100 MS/s signal to a user-specified rate. The down-converted signal is passed to the Host PC at up to 20 MS/s over a standard Gigabit Ethernet connection.
The receiver host PC contains USRP driver software blocks, which are used to modify and control different USRP hardware parameters like carrier frequency, IQ rate, Gain, etc. The data which is received by the USRP kit via gigabit Ethernet cable is fetched at the receiver host PC using USRP fetch data block in LabVIEW. It is a USRP driver software block and used to receive data on the host PC. Each OFDM frame has the same L samples/points at the start and end of the frame as CP. This appearance of CP in each frame yields a correlation between a pair of samples that are N samples apart. Hence received signal is not a white process either, but because of its probabilistic structure, it contains information about the time offset
 and carrier frequency offset
 . This crucial observation offers the opportunity for joint estimation of these two unknown offsets [36]. Therefore, here on the receiver side, the Van de Beek algorithm is used to remove offset in time and frequency [37]. This algorithm finds estimates of time offset
 and frequency
 by using (4) and (5) respectively,
 |
 is used to the estimate time offset
 and frequency offset
 . The magnitude of
 is compensated by energy term
 , peaks at time instant which provides
 , while its phase at this time instant is proportional to
 . Where
 is a correlation between two pairs of L samples of OFDM frame that are
 samples apart,
 is energy part and
 is the magnitude of correlation coefficients.
The time and frequency offset are removed along with CP removal from each OFDM frame. Now each OFDM frame will have N-points after CP removal. The FFT is then used to convert the time domain OFDM samples to the frequency domain OFDM symbol. The CFR amplitude is extracted at the receiver are analyzed to detect human body movements.
IV. Methodology
In this initial research, the amplitude response is estimated in the frequency domain by transmitting 1250 PN data bits. These bits are mapped by using 4-QAM to generate 625 symbols. These symbols are split into 5 parallel streams of 125 symbols. The 25 reference symbols are concatenated in each frame as pair of samples that are N samples apart. Hence received signal is not a white process either, but because of its probabilistic structure, it contains information about the time offset
 and carrier frequency offset
 . This crucial observation offers the opportunity for joint estimation of these two unknown offsets [36]. Therefore, here on the receiver side, the Van de Beek algorithm is used to remove offset in time and frequency [37]. This algorithm finds estimates of time offset
 and frequency
 by using (4) and (5) respectively, reference symbols. The zero paddings of 105 zeros as nulls and DC are added in each frame to perform 256-point IFFT. At the beginning of the frame, 64 symbols are inserted by duplicating the last 64 symbols. Now each OFDM frame size is 320 symbols and the total size of data is 1600 symbols. The OFDM frames are sent at the rate of 200 frames/s to estimate the CFR using the USRP kit. IQ rate gain and carrier frequency parameters are configured in the software-defined block of the transmitter and the receiver is given in Table II. Van De Beek algorithm is applied to locate the beginning and end of each frame and to remove time and frequency offsets. It also helps in removing the cyclic prefix to perform 256-point FFT to capture the amplitude response of the channel in the frequency domain.
TABLE II. Hardware and Software Configuration Parameters Settings.
| Hardware configuration parameters settings | |
|---|---|
| Antenna Gain (Tx) | 15 dB |
| Antenna Gain (Rx) | 30 dB |
| Operating Frequency (Tx/Rx) | 915 MHz |
| IQ Rate (Tx/Rx) | 200 kS/s |
| Software configuration parameters settings | |
| Data | PN sequence |
| Bits per symbol | 2 |
| OFDM subcarriers | 256 |
| Data subcarriers | 150 |
| Reference subcarriers | 25 |
| Nulls DC subcarriers | 103 |
| Cyclic Prefix points | 64 |
| NFFT Points | 256 |
| Samples per frame | 320 |
A. Experimental Setup
In this research work, extensive experiments are conducted to evaluate the performance of this platform in detecting and monitoring different human body movements including human hand waving, coughing, and breathing. In this experimental setup, the first data is collected through USRPs, which are placed at a distance of half-meter from the subject. Each participant was asked to sit on a chair in relax posture. A total of five participants are used for data collection and each participant was asked to perform different human body movements like hand waving, coughing, and breathing. Before performing different activities, all subjects were given training and were requested to do the proper practice. This helped all subjects to perform these different activities efficiently. Five data sets are collected by each participant for these activities. Detail of each participant is given in Table III.
TABLE III. Participants Detail.
| Sr. No. | Participant | Age (Years) | Weight (Kg) | Height (cm) |
|---|---|---|---|---|
| 1 | Male | 31 | 52 | 177 |
| 2 | Male | 31 | 65 | 174 |
| 3 | Male | 26 | 76 | 173 |
| 4 | Male | 31 | 52 | 176 |
| 5 | Male | 28 | 65 | 179 |
After data collection, it is processed in different steps including subcarrier selection, outlier removal, and high-frequency elimination. In the subcarrier selection process, a group of 256 subcarriers is obtained at the receiver for each activity. It is found that each subcarrier has a different amplitude because each subcarrier has a different sensitivity to human movement. To select those subcarriers which are more sensitive to human movement, the variance of all subcarriers is calculated and subcarriers with high variance are selected. After this wavelet filter is applied to remove any outliers in the data. Wavelet filter only discards outlier from raw data but keeps sharp transitions. In the end, high-frequency noise components are eliminated and data smoothening is done through a moving average filter of window size 8.
B. Human Body Movement Monitoring
For real-time human body movement monitoring, data from transmitter USRP is being sent to the real-time wireless channel, which introduces different channel effects like attenuation, time shift, and frequency shift. The CFR for the real-time channel is given in equation (6) as:
 |
Here
 denotes amplitude attenuations.
For real-time human body movement monitoring following activities are considered:
1). Hand Waving Movement Monitoring:
In this case, CFR amplitude information is used to monitor human hand movement. This case is considered to test the platform for analysis of large-scale human body movements. Each subject is asked to perform hand waving twice in 28 seconds. The changes in CFR are observed to monitor this hand waving activity.
2). Human Health Monitoring:
For human health monitoring, different health issues like human cough and different breath patterns are monitored by observing CFR. This case is considered to test the platform for analysis of small-scale human body movements.
-
a)
Human coughing monitoring: For the case of human coughing, each subject is asked to do a voluntary cough twice in 28 seconds of activity. This analysis leads to detect the different types of health issues due to coughing.
-
b)
Human breath patterns monitoring: For the case of human breathing, each subject is asked to perform different breathing patterns. Three types of breaths are considered in this research work including normal, slow, and fast breath. For normal breath, there are usually 12-20 breaths per minute (bpm) [38]. If the breath rate is less than 12 breaths per minute, then it is considered a slow breath. While if the breath is more than 20 breaths per minute then it is considered a fast breath. This case is also considered to test the platform for analysis of small-scale human body movement.
C. Breathing Rate Measurement
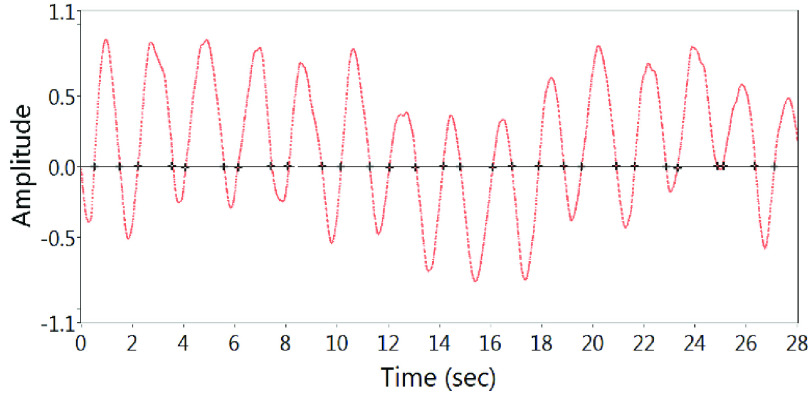
The breathing rate measurement is usually done through different methods including zero-cross detection, peak detection, and Fourier transformation [39]. To check system feasibility breath rate measurement is done through all these three methods. The breathing rate measurement detail of these methods is given below:
1). Zero Cross Detection Method:
For this method, the total number of zero crossings
 are detected for breathing data. Breath rate for all different breath patterns is measured by the following equation:
 |
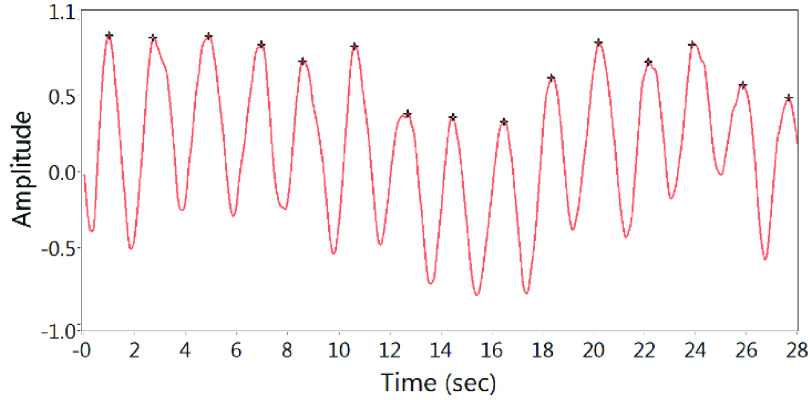
2). Peak Detection Method:
In the peak detection method, peaks are detected using quadratic fit. The number of peaks obtained represents the breath rate.
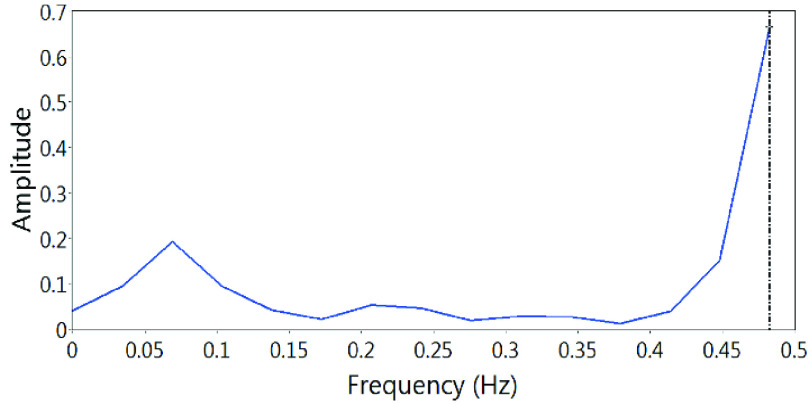
3). Fourier Transformation:
In this method, FFT is applied and amplitude response is used to check the maximum frequency component
 present in data. On basis of
 , breath rate is measured using the following equation:
 |
where
 represents time in seconds for which breathing activity is performed. In this research work, each activity is performed for 28 seconds.
V. Results and Discussions
The results are achieved for human body movements like hand waving and health issues monitoring like coughing and different breathing patterns. These results are used to test the platform for monitoring human movements and measuring the COVID-19 symptoms. Here CFR is used to describe effects on RF signal like reflection, scattering, and diffraction during propagation from the transmitter to the receiver. CFR amplitude information for a group of subcarriers gives a unique pattern to predict the channel information. Five subjects are asked to perform each activity but here the results of the 75th subcarrier of subject 3 shown for illustration purpose.
A. Hand Waving Movement Monitoring
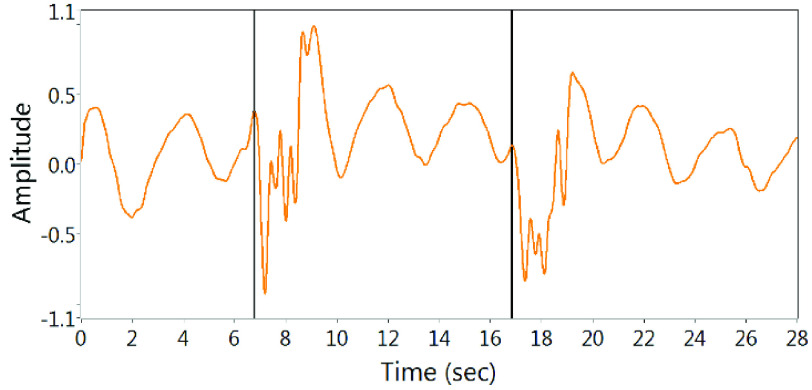
For hand waving activity, each participant was requested to be seated on a chair in an easy posture and do normal breathing. Then the subject was requested to do hand waving movement at 6th and 16th second. As this activity is performed for 28 seconds, it can be seen in figure 2 that there is an abrupt change in CFR due to hand waving after the 6th and 16th second. Human hand waving movement is considered in this research work just to test the detecting capabilities of the platform for large-scale body movements. As it can be seen from the results given in figure 2, this platform can faithfully detect a hand waving movement and it is suitable to analyze large-scale human body movement monitoring.
Fig. 2.
Real-time CFR amplitude information for hand waving.
B. Human Cough Monitoring
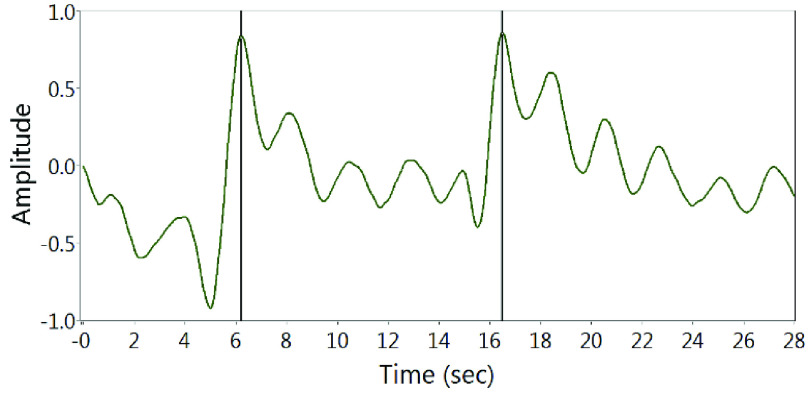
Now for cough monitoring each subject was requested to do voluntary cough at 6th and 16th second. As this activity is also performed for 28 seconds, an abrupt change in CFR can be seen in figure 3 due to coughing after the 6th and 16th second. Human coughing is considered to test the detecting capabilities of the platform for small-scale body movements. As it can be seen from the results given in figure 3, this platform can faithfully detect voluntary cough and it is suitable to analyze small-scale human body movement monitoring and different cough abnormalities. This result will help detect COVID-19 symptoms as abnormalities in coughing can be a symptom of COVID-19.
Fig. 3.
Real-time CFR amplitude information for coughing.
C. Human Breath Monitoring
For human breath monitoring, different breath patterns including normal, slow, and fast are monitored and the breathing rate for all these patterns is measured through three methods. This result will help to detect COVID-19 symptoms as irregular breathing is one of the common symptoms of COVID-19.
1). Normal Breathing:
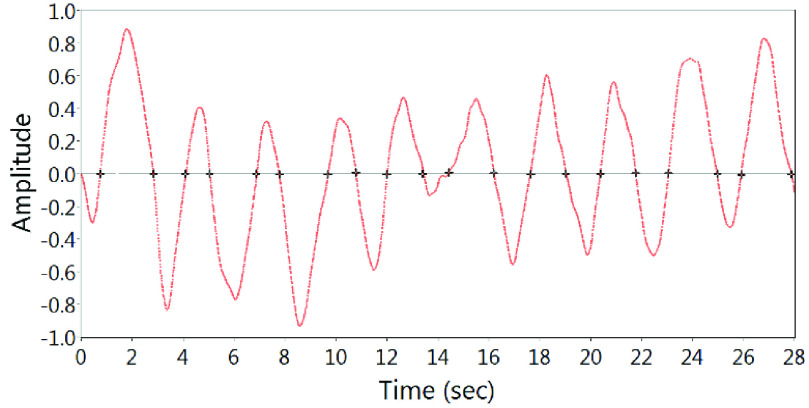
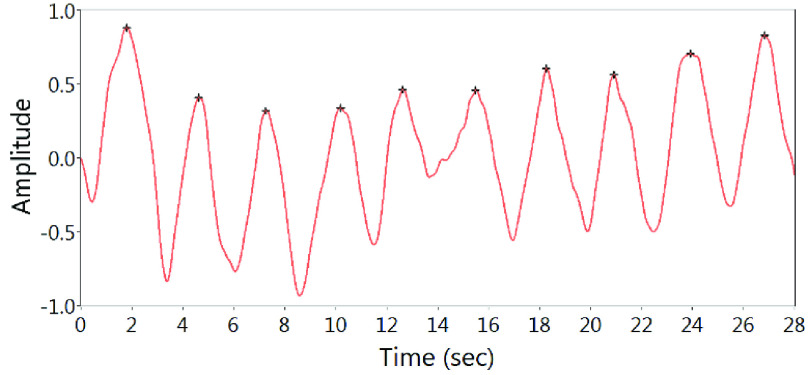
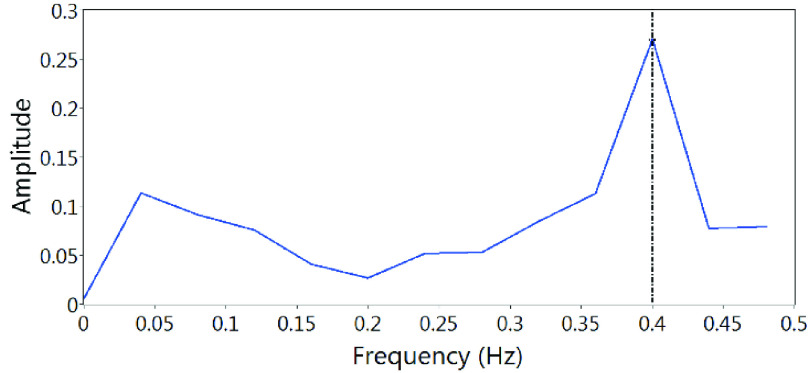
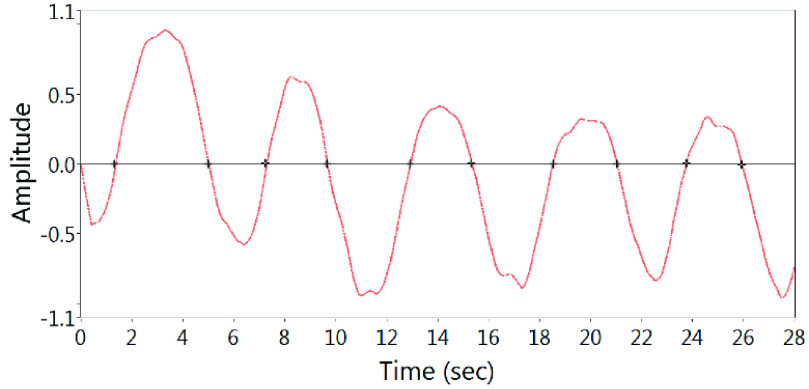
For the case of normal breathing, the breath rate is measured from three different methods. The first zero-cross detection method is used to measure breathing rate using equation 7. As there is a total of 20 zero crossings in figure 4, this results in 10 breaths in 28 seconds and approximately 20 breaths per minute (bpm). Now breath rate is measured from the peak detection method. In figure 5, there is a total of 10 peaks in 28 seconds, this results in 10 breaths in 28 seconds and approximately 20 bpm. For the Fourier transformation method,
 is found as 0.40 Hz which can be seen in figure 6. Now by using equation 8 breathing rate is measured as 11 breaths in 28 seconds, which results in approximately 22 bpm. There are almost similar results from all three methods, which validates our system detecting capability.
Fig. 4.
Breathing rate using zero-cross detection for normal breath.
Fig. 5.
Breathing rate using peak detection for normal breath.
Fig. 6.
Breathing rate using fourier transform for normal breath.
2). Slow Breathing:
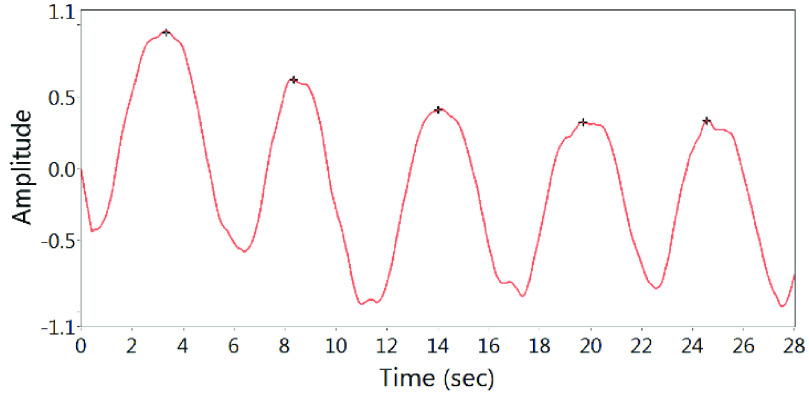
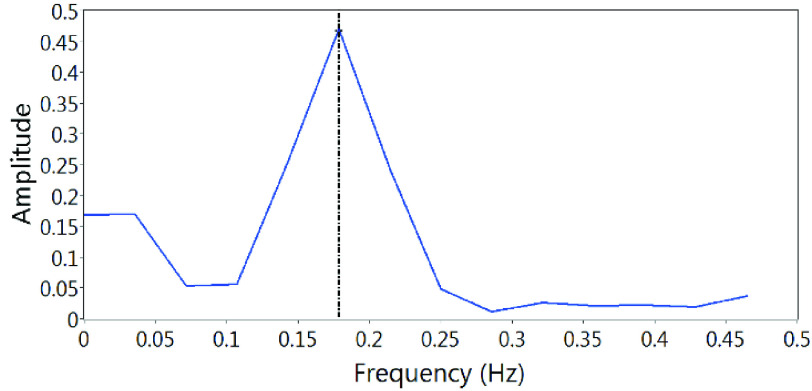
For the case of slow breathing, the same procedure is applied to find breath rate from three methods. The first zero-cross detection method is used to measure breathing rate using equation 7. As there is a total of 10 zero crossings in figure 7, this results in 5 breaths in 28 seconds and approximately 10 breaths per minute (bpm). Now breath rate is measured from the peak detection method. In figure 8, there is a total of 5 peaks in 28 seconds, this results in 5 breaths in 28 seconds and approximately 10 bpm. For the Fourier transformation method,
 is found as 0. 17 Hz which can be seen in figure 9. Now by using equation 8, the breathing rate is measured as 5 breaths in 28 seconds, which results in approximately 10 bpm. There are almost similar results from all three methods, which validates our system detecting capability.
Fig. 7.
Breathing rate using zero-cross detection for slow breath.
Fig. 8.
Breathing rate using peak detection for slow breath.
Fig. 9.
Breathing rate using fourier transform for slow breath.
3). Fast Breathing:
Now for the case of fast breathing, the same procedure is again used to find breath rate from three different methods. The first zero-cross detection method is used to measure breathing rate using equation 7. As there is a total of 29 zero crossings in figure 10, this results in 14 breaths in 28 seconds and approximately 28 breaths per minute (bpm). Now breath rate is measured from the peak detection method. In figure 11, there is a total of 15 peaks in 28 seconds, this results in 15 breaths in 28 seconds and approximately 30 bpm. For the Fourier transformation method,
 is found as 0. 48 Hz which can be seen in figure 12. Now by using equation 8, the breathing rate is measured as 14 breaths in 28 seconds, which results in approximately 28 bpm. There are almost similar results from all three methods, which validates our system detecting capability. The summary of breath rate measurement through all three methods is given in Table IV. This platform can faithfully detect different types of breathing, which can be validated by Table IV, as all three methods provide approximately provide same results.
Fig. 10.
Breathing rate using peak detection for fast breath.
Fig. 11.
Breathing rate using peak detection for fast breath.
Fig. 12.
Breathing rate using fourier transform for fast breath.
TABLE IV. Breath Rate Per Minute Measurement Through Different Methods.
| Sr. # | Breath pattern type | Zero Cross Detection | Peak Detection | Fourier Transformation |
|---|---|---|---|---|
| 1. | Normal breath | 20 | 20 | 22 |
| 2. | Slow breath | 10 | 10 | 10 |
| 3. | Fast breath | 28 | 30 | 28 |
VI. Conclusion
In this research work, a contactless platform is developed for monitoring human movement and early diagnosis of COVID-19 indicators and using SDR. Initially, CFR amplitude information is used to capture real-time channel response for different human body movements. The developed platform faithfully detects hand waving movement, coughing, and different breathing patterns. The system capabilities are tested by measuring breathing rate through zero crossings, peak detection, and Fourier transformation. The breathing rate is successfully recorded as 20, 10, and 28 breaths per minute for the case of normal, slow, and fast respectively. In the future, small-scale detection can be improved by enhancing the system gain. Shortness of breath and severe coughing are the common and early symptoms of COVID-19. In this regard, data can be collected from COVID-19 affected patients using this platform in a contactless manner to stop the virus spread and can further be investigated and classified using state of art machine and deep learning algorithms.
Acknowledgment
Funding Statement
This work was supported in part by the Zayed Health Center at United Arab Emirates University (UAEU) under Grant G00003476, in part by the Engineering and Physical Sciences Research Council (EPSRC) under Grant EP/T021063/1 and Grant EP/R511705/1, and in part by the Taif University Research Supporting, Taif University, Taif, Saudi Arabia, under Project TURSP-2020/277.
Contributor Information
Mubashir Rehman, Email: 18-phd-ee-002@student.hitecuni.edu.pk.
Raza Ali Shah, Email: raza.ali.shah@hitecuni.edu.pk.
Muhammad Bilal Khan, Email: bilal@stu.xidian.edu.cn.
Najah Abed Abu Ali, Email: najah@uaeu.ac.ae.
Abdullah Alhumaidi Alotaibi, Email: a.alhumaidi@tu.edu.sa.
Turke Althobaiti, Email: turke.althobaiti@nbu.edu.sa.
Naeem Ramzan, Email: naeem.ramzan@uws.ac.uk.
Syed Aziz Shah, Email: syed.shah@coventry.ac.uk.
Xiaodong Yang, Email: xdyang@xidian.edu.cn.
Akram Alomainy, Email: a.alomainy@qmul.ac.uk.
Muhammad Ali Imran, Email: muhammad.imra@glasgow.ac.uk.
Qammer H. Abbasi, Email: qammer.abbasi@glasgow.ac.uk.
References
- [1].Liu L., Shah S., Zhao G., and Yang X., “Respiration symptoms monitoring in body area networks,” Appl. Sci., vol. 8, no. 4, p. 568, Apr. 2018. [Google Scholar]
- [2].Li C., Lubecke V. M., Boric-Lubecke O., and Lin J., “A review on recent advances in Doppler radar sensors for noncontact healthcare monitoring,” IEEE Trans. Microw. Theory Techn., vol. 61, no. 5, pp. 2046–2060, May 2013. [Google Scholar]
- [3].Zhou Z., Chen X., Chung Y.-C., He Z., Han T. X., and Keller J. M., “Video-based activity monitoring for indoor environments,” in Proc. IEEE Int. Symp. Circuits Syst., May 2009, pp. 1449–1452. [Google Scholar]
- [4].Zhang C., Kuhn M. J., Merkl B. C., Fathy A. E., and Mahfouz M. R., “Real-time noncoherent UWB positioning radar with millimeter range accuracy: Theory and experiment,” IEEE Trans. Microw. Theory Techn., vol. 58, no. 1, pp. 9–20, Jan. 2010. [Google Scholar]
- [5].Khan M. B., Dong C., Al-Hababi M. A. M., and Yang X., “Design of a portable and multifunctional dependable wireless communication platform for smart health care,” Ann. Telecommun., vol. 75, no. 8, pp. 1–10, Aug. 2020. [Google Scholar]
- [6].Chavez-Santiago R., Mateska A., Chomu K., Gavrilovska L., and Balasingham I., “Applications of software-defined radio (SDR) technology in hospital environments,” in Proc. 35th Annu. Int. Conf. IEEE Eng. Med. Biol. Soc. (EMBC), Jul. 2013, pp. 1266–1269. [DOI] [PubMed] [Google Scholar]
- [7].Zhu S., Xu J., Guo H., Liu Q., Wu S., and Wang H., “Indoor human activity recognition based on ambient radar with signal processing and machine learning,” in Proc. IEEE Int. Conf. Commun. (ICC), May 2018, pp. 1–6. [Google Scholar]
- [8].Luo F., Poslad S., and Bodanese E., “Kitchen activity detection for healthcare using a low-power radar-enabled sensor network,” in Proc. IEEE Int. Conf. Commun. (ICC), May 2019, pp. 1–7. [Google Scholar]
- [9].Abbasi Q. H., Abbas H. T., Alomainy A., and Imran M. A., Backscattering and RF Sensing for Future Wireless Communication. Hoboken, NJ, USA: Wiley, 2021. [Google Scholar]
- [10].Qian K., Wu C., Yang Z., Liu Y., He F., and Xing T., “Enabling contactless detection of moving humans with dynamic speeds using CSI,” ACM Trans. Embedded Comput. Syst., vol. 17, no. 2, pp. 1–18, Apr. 2018. [Google Scholar]
- [11].Di Domenico S., De Sanctis M., Cianca E., and Ruggieri M., “WiFi-based through-the-wall presence detection of stationary and moving humans analyzing the Doppler spectrum,” IEEE Aerosp. Electron. Syst. Mag., vol. 33, nos. 5–6, pp. 14–19, May 2018. [Google Scholar]
- [12].Al-qaness M. and Li F., “WiGeR: WiFi-based gesture recognition system,” ISPRS Int. J. Geo-Inf., vol. 5, no. 6, p. 92, Jun. 2016. [Google Scholar]
- [13].Wang C., Lin Z., Xie Y., Guo X., Ren Y., and Chen Y., “WiEat: Fine-grained device-free eating monitoring leveraging Wi-Fi signals,” 2020, arXiv:2003.09096. [Online]. Available: http://arxiv.org/abs/2003.09096 [Google Scholar]
- [14].Cheng L. and Wang J., “Walls have no ears: A non-intrusive WiFi-based user identification system for mobile devices,” IEEE/ACM Trans. Netw., vol. 27, no. 1, pp. 245–257, Feb. 2019. [Google Scholar]
- [15].Gu Y., Wang Y., Liu Z., Li J.u, and Li J., “SleepGuardian: An RF-based healthcare system guarding your sleep from afar,” IEEE Netw., vol. 34, no. 2, pp. 164–171, Mar. 2020. [Google Scholar]
- [16].Liu M., Zhang L., Yang P., Lu L., and Gong L., “Wi-run: Device-free step estimation system with commodity Wi-Fi,” J. Netw. Comput. Appl., vol. 143, pp. 77–88, Oct. 2019. [Google Scholar]
- [17].Savazzi S., Sigg S., Nicoli M., Rampa V., Kianoush S., and Spagnolini U., “Device-free radio vision for assisted living: Leveraging wireless channel quality information for human sensing,” IEEE Signal Process. Mag., vol. 33, no. 2, pp. 45–58, Mar. 2016. [Google Scholar]
- [18].Pu Q., Gupta S., Gollakota S., and Patel S., “Whole-home gesture recognition using wireless signals,” in Proc. 19th Annu. Int. Conf. Mobile Comput. Netw., Miami, FL, USA, 2013, pp. 27–38. [Google Scholar]
- [19].Wang G., Zou Y., Zhou Z., Wu K., and Ni L. M., “We can hear you with Wi-Fi!,” IEEE Trans. Mobile Comput., vol. 15, no. 11, pp. 2907–2920, Nov. 2016. [Google Scholar]
- [20].Li W., Tan B., and Piechocki R., “Passive radar for opportunistic monitoring in E-health applications,” IEEE J. Transl. Eng. Health Med., vol. 6, 2018, Art. no. 2800210. [DOI] [PMC free article] [PubMed] [Google Scholar]
- [21].Li W., Tan B., and Piechocki R. J., “Non-contact breathing detection using passive radar,” in Proc. IEEE Int. Conf. Commun. (ICC), May 2016, pp. 1–6. [Google Scholar]
- [22].Liu J., Chen Y., Wang Y., Chen X., Cheng J., and Yang J., “Monitoring vital signs and postures during sleep using WiFi signals,” IEEE Internet Things J., vol. 5, no. 3, pp. 2071–2084, Jun. 2018. [Google Scholar]
- [23].Wang X., Yang C., and Mao S., “Resilient respiration rate monitoring with realtime bimodal CSI data,” IEEE Sensors J., vol. 20, no. 17, pp. 10187–10198, Sep. 2020. [Google Scholar]
- [24].Haider D.et al. , “Utilizing a 5G spectrum for health care to detect the tremors and breathing activity for multiple sclerosis,” Trans. Emerg. Telecommun. Technol., vol. 29, no. 10, p. e3454, Oct. 2018. [Google Scholar]
- [25].Zhang Q., Haider D., Wang W., Shah S., Yang X., and Abbasi Q., “Chronic obstructive pulmonary disease warning in the approximate ward environment,” Appl. Sci., vol. 8, no. 10, p. 1915, Oct. 2018. [Google Scholar]
- [26].Yang X.et al. , “S-band sensing-based motion assessment framework for cerebellar dysfunction patients,” IEEE Sensors J., vol. 19, no. 19, pp. 8460–8467, Oct. 2019. [Google Scholar]
- [27].Shah S. A., Yang X., and Abbasi Q. H., “Cognitive health care system and its application in pill-rolling assessment,” Int. J. Numer. Model., Electron. Netw., Devices Fields, vol. 32, no. 6, Nov. 2019. [Google Scholar]
- [28].Shah S. A., Fan D., Ren A., Zhao N., Yang X., and Tanoli S. A. K., “Seizure episodes detection via smart medical sensing system,” J. Ambient Intell. Hum. Comput., vol. 11, no. 11, pp. 4363–4375, Nov. 2020. [Google Scholar]
- [29].Barua A., Zhang Z.-Y., Al-Turjman F., and Yang X., “Cognitive intelligence for monitoring fractured post-surgery ankle activity using channel information,” IEEE Access, vol. 8, pp. 112113–112129, 2020. [Google Scholar]
- [30].Al-hababi M. A. M., Khan M. B., Al-Turjman F., Zhao N., and Yang X., “Non-contact sensing testbed for post-surgery monitoring by exploiting artificial-intelligence,” Appl. Sci., vol. 10, no. 14, p. 4886, Jul. 2020. [Google Scholar]
- [31].Tabik S.et al. , “COVIDGR dataset and COVID-SDNet methodology for predicting COVID-19 based on chest X-ray images,” IEEE J. Biomed. Health Informat., vol. 24, no. 12, pp. 3595–3605, Dec. 2020. [DOI] [PMC free article] [PubMed] [Google Scholar]
- [32].Jiang Y., Chen H., Loew M., and Ko H., “COVID-19 CT image synthesis with a conditional generative adversarial network,” IEEE J. Biomed. Health Informat., vol. 25, no. 2, pp. 441–452, Feb. 2021. [DOI] [PMC free article] [PubMed] [Google Scholar]
- [33].Shi F.et al. , “Review of artificial intelligence techniques in imaging data acquisition, segmentation, and diagnosis for COVID-19,” IEEE Rev. Biomed. Eng., vol. 14, pp. 4–15, 2021. [DOI] [PubMed] [Google Scholar]
- [34].Shi W., Tong L., Zhu Y., and Wang M. D., “COVID-19 automatic diagnosis with radiographic imaging: Explainable AttentionTransfer deep neural networks,” IEEE J. Biomed. Health Inform., early access, Apr. 21, 2021, doi: 10.1109/JBHI.2021. [DOI] [PMC free article] [PubMed]
- [35].John C. C., Ponnusamy V., and Chandrasekaran S. K., “A survey on mathematical, machine learning and deep learning models for COVID-19 transmission and diagnosis,” IEEE Rev. Biomed. Eng., early access, Mar. 26, 2021, doi: 10.1109/RBME.2021. [DOI] [PMC free article] [PubMed]
- [36].Awoseyila A., Kasparis C., and Evans B., “Robust time-domain timing and frequency synchronization for OFDM systems,” IEEE Trans. Consum. Electron., vol. 55, no. 2, pp. 391–399, May 2009. [Google Scholar]
- [37].van de Beek J.-J.et al. , “A time and frequency synchronization scheme for multiuser OFDM,” IEEE J. Sel. Areas Commun., vol. 17, no. 11, pp. 1900–1914, Nov. 1999. [Google Scholar]
- [38].Vital Signs 101. Accessed: Jan. 7, 2021. [Online]. Available: https://www.hopkinsmedicine.org
- [39].Schrumpf F., Sturm M., Bausch G., and Fuchs M., “Derivation of the respiratory rate from directly and indirectly measured respiratory signals using autocorrelation,” Current Directions Biomed. Eng., vol. 2, no. 1, pp. 241–245, Sep. 2016. [Google Scholar]


