

Abstract
The translation of time-dependent drug-target occupancy to extended pharmacological activity at low drug concentration depends on factors such as target vulnerability and the rate of target turnover. Previously we demonstrated that the post-antibiotic effect (PAE) caused by inhibitors of bacterial drug targets could be used to assess target vulnerability, and that high levels of target vulnerability coupled with relatively low rates of target resynthesis resulted in a strong correlation between drug-target residence time and the PAE following compound washout. Although the residence time of inhibitors on UDP-3-O-acyl-N-acetylglucosamine deacetylase (LpxC) in Pseudomonas aeruginosa (paLpxC) result in significant PAE, inhibitors of the equivalent enzyme in Escherichia coli (ecLpxC) do not cause a PAE. Hyperactivity of the fatty acid biosynthesis enzyme FabZ or the inclusion of sub-MIC levels of azithromycin lead to the observation of a PAE for three inhibitors of ecLpxC. FabZ hyperactivity has been shown to stabilize ecLpxC and using mass spectrometry we demonstrate that the appearance of a PAE can be directly linked to a 3-fold increase in the stability of ecLpxC. These studies substantiate the importance of target turnover in time-dependent drug activity.
Keywords: Target vulnerability, LpxC, residence time, post-antibiotic effect, target turnover
Graphical Abstract
Antibacterial drug discovery primarily involves the development of compounds that inhibit targets that are essential for bacteria survival. The identification of these targets can stem from deconvoluting the mode of action of natural product antibacterial agents or of compounds discovered in phenotypic assays, or through ever more sophisticated genetic approaches that alter the amount of target either through knockout or inducible knockdown. However, the difficulty in exploiting essential targets for the development of new antibiotics indicates that essentiality is not sufficient.1 In addition to traditional challenges faced by antibacterial drug discovery,2–3 such as drug penetration/efflux, the rapid emergence of resistance, and the lack of target conservation across pathogens, the growth conditions used for establishing the importance of a target for bacterial growth may differ from the environment experienced by the bacteria during human infection. In addition, we and others have posited that target vulnerability plays a major role in the context of target druggability and may have a direct impact on the drug levels required for in vivo antibacterial activity.4–8
Target vulnerability quantifies the level of target occupancy required to induce the desired physiological response, such as bacterial cell death.7–9 High vulnerability targets are those that require low levels of occupancy to trigger the desired outcome while low vulnerability targets require high levels of occupancy. Target vulnerability is thus an important factor in the determining the drug exposure required for the pharmacodynamic response, and the lower drug levels required for a high vulnerability target is expected to translate into lower, less frequent drug doses and a widening of the therapeutic window. Since antibiotics are often given at high levels for sustained periods of time, approaches that reduce the required drug exposure are likely to improve the success rate of new drug approvals.10 Most approaches to assessing target vulnerability have focused on examining the phenotypic response to reducing target levels, either by genetic knockdown or selected proteolysis of the target.5–6 However, reducing enzyme activity by removing the protein from the cell is fundamentally different to inhibiting the enzyme using a small molecule, a difference recognized in the field of targeted protein degradation where the former leads to the event-driven pharmacology and the latter to occupancy-driven pharmacology.11
Recently we demonstrated that the post-antibiotic effect (PAE), which is the delay in bacterial growth following compound washout, could provide insight into target vulnerability and specifically whether an increase in the residence time of the compound on the target translates to an increase in PAE.7–8 Using this approach, we demonstrated that the bacterial ribosome and the Pseudomonas aeruginosa LpxC (paLpxC) both exhibit a strong correlation between residence time and PAE, indicating that both are highly vulnerable.7, 10 In the present work we extend the analysis to the LpxC enzyme from Escherichia coli (ecLpxC). LpxC (UDP-3-O-acyl-N-acetylglucosamine deacetylase) catalyzes the first committed step in lipopolysaccharide biosynthesis and is a validated antibacterial target in Gram-negative pathogens.12–13 In contrast to paLpxC, inhibitors of ecLpxC show no PAE in Escherichia coli. Building on the work of Ogura, Narberhaus and coworkers, who demonstrated that the half-life of LpxC in P. aeruginosa is 90 min,14 compared to 9-10 min in E. coli,15–17 we use genetic tools and mass spectrometry to analyze the role of target turnover in the translation of target occupancy to the delay in bacterial regrowth following compound washout. These studies show that ecLpxC is resynthesized rapidly in wild-type E. coli but that a PAE can be induced if the rate of ecLpxC resynthesis is reduced either by a hyperactive mutant of the fatty acid biosynthesis β-hydroxyacyl-ACP dehydratase FabZ (FabZ*),15 or by the addition of sub-MIC levels of a macrolide antibiotic. These studies provide insight into how target vulnerability might be modulated and the potential role of protein synthesis inhibitors in combination therapy.
RESULTS
Post-antibiotic effect of LpxC inhibitors in wild type E. coli:
Previously we described a correlation between the residence time of inhibitors on P. aeruginosa LpxC (paLpxC) and the post-antibiotic effect resulting from treatment of P. aeruginosa PA01.10 We selected three LpxC inhibitors for analysis with ecLpxC that included PT805, an LpxC inhibitor developed by Pfizer (17hh),18 PT810, a compound from our LpxC inhibitor discovery program, and CHIR-090, an LpxC inhibitor first described by Raetz and colleagues, that binds to ecLpxC through a two-step induced-fit mechanism (Figure 1).19
Figure 1:
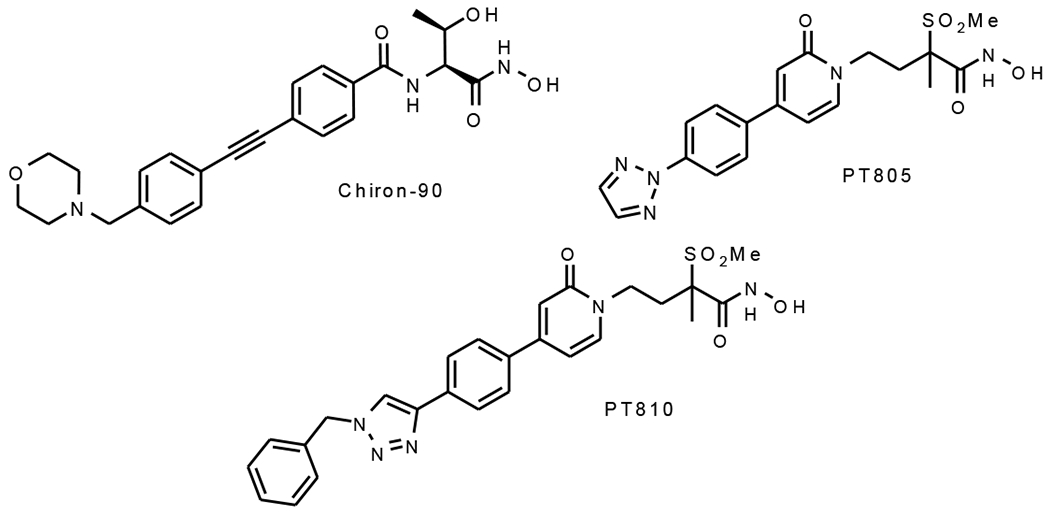
The ecLpxC inhibitors
We first measured the residence times of the three inhibitors on ecLpxC using a Penefsky column-based method.20–21 Compounds were preincubated with ecLpxC and then mixed with a fluorescent LpxC inhibitor PT900. The enzyme was then rapidly separated from unbound ligand using a SpinTrap G-25 column at different times after adding the fluorescent competitor, and the fluorescence intensity of the eluate was quantified on a BioTek plate reader using λex 315 nm and λem 420 nm. This approach gave residence times of 17±7 min, 6±3 min and 66±30 min for PT805, PT810 and CHIR-090 (Table 1, Figure S1).
Table 1:
Kinetic and microbiological activity
| Wild-typea | FabZ*a | ||||||||||
|---|---|---|---|---|---|---|---|---|---|---|---|
| tR (min)b | MIC (μM)c | PAE (h)d | PAE (h) (sub-MIC AZ)e | MIC (μM)c | PAE (h)d | ||||||
| 1x | 4x | 16x | 16x(0.2) | 16x(0.4) | 1x | 4x | 16x | ||||
| PT805 | 17±7 | 0.16 | 0 | 0 | 0 | 1.4±0.1 | 2.4±0.1 | 0.019 | 0.8±0.1 | 1.5±0.1 | 2.1±0.2 |
| PT810 | 6±3 | 0.17 | 0 | 0 | 0 | 1.9±0.8 | 2.6±0.8 | 0.080 | 0.7±0.2 | 0.8±0.2 | 0.9±0.2 |
| CHIR-090 | 66±30 | 0.62 | 0 | 0 | 0 | 2.8±0.3 | 3.7±0.2 | 0.010 | 0.5±0.1 | 1.3±0.3 | 2.4±0.2 |
| Erythromycin | ND | 50 | NDf | 0.7±0.1 | 1.4±0.4 | ND | ND | 6.25 | ND | 0.8±0.2 | 1.5±0.4 |
| Cefamandole | ND | 6.25 | ND | 0 | 0 | 0 | 0 | 1.6 | ND | 0 | 0 |
| Trimethoprim | ND | 2.5 | ND | 0 | 0 | ND | ND | 2.5 | ND | 0 | 0 |
Wild-type, E. coli strain (K-12, MG1655); FabZ*, hyperactive FabZ strain (L85P)
Residence times were determined at 25°C by monitoring the rate of inhibitor displacement using a fluorescent ligand. The reported values are the average of two independent experiments where the errors represent the standard deviation from the mean.
MIC values were determined by the microbroth dilution method. Experiments were performed in triplicate and the reported values are the average of the three independent experiments.
The PAE was calculated using standard procedure, where the time required by the bacteria to recover 1 log after washing out of the inhibitor was compared to the culture having no inhibitor (DMSO) was used as a vehicle.7 Experiments were performed in triplicate and the reported values are the average of the three independent experiments with the errors representing the standard deviation from the mean.
PAE values for wild-type E. coli in media containing sub-MIC concentrations of azithromycin at 37 °C. MIC values of azithromycin were first determined for bacteria exposed to 16xMIC of the ecLpxC inhibitor and then diluted into media containing azithromycin of various concentrations. The control MIC was 12 μM whereas the MIC values for bacteria pre-exposed to 16xMIC ecLpxC inhibitor were 3.2 μM, while the MIC following pre-exposure to 16x cefamandole was 6.25 μM. The number in parentheses represents the sub-MIC azithromycin concentration (0.2x or 0.4xMIC) used in the post-exposure phase. Experiments were performed in triplicate and the reported values are the average of the three independent experiments with the errors representing the standard deviation from the mean.
ND, not determined.
We also examined the antimicrobial activity of the compounds. Each ecLpxC inhibitor had potent activity towards a wild-type E. coli strain (K-12 MG1655) with MIC values between 0.2-0.6 μM (Table 1). Time kill assays also revealed that the compounds were bactericidal, reducing the starting log CFU/mL of the bacterial culture by greater than 3 logs (Figure S2).22 We then measured the post-antibiotic effect (PAE) of the inhibitors by monitoring the regrowth of bacteria following compound washout. Wild-type E. coli cells were exposed to 1x, 4x and 16x MIC of the inhibitors for 1 h, after which the bacteria were diluted 1:1000 fold into fresh media. Bacterial regrowth was monitored by plating samples as a function of time after wash-out and enumerating CFUs. The PAE was calculated by determining the time required for a 1 log increase in CFU after inhibitor wash-out compared to a culture treated with vehicle (DMSO).7 No PAE could be observed for any of the inhibitors (Figure 2, Table 1).
Figure 2: Post-antibiotic effect of the ecLpxC inhibitors on wild-type and FabZ* E. coli.
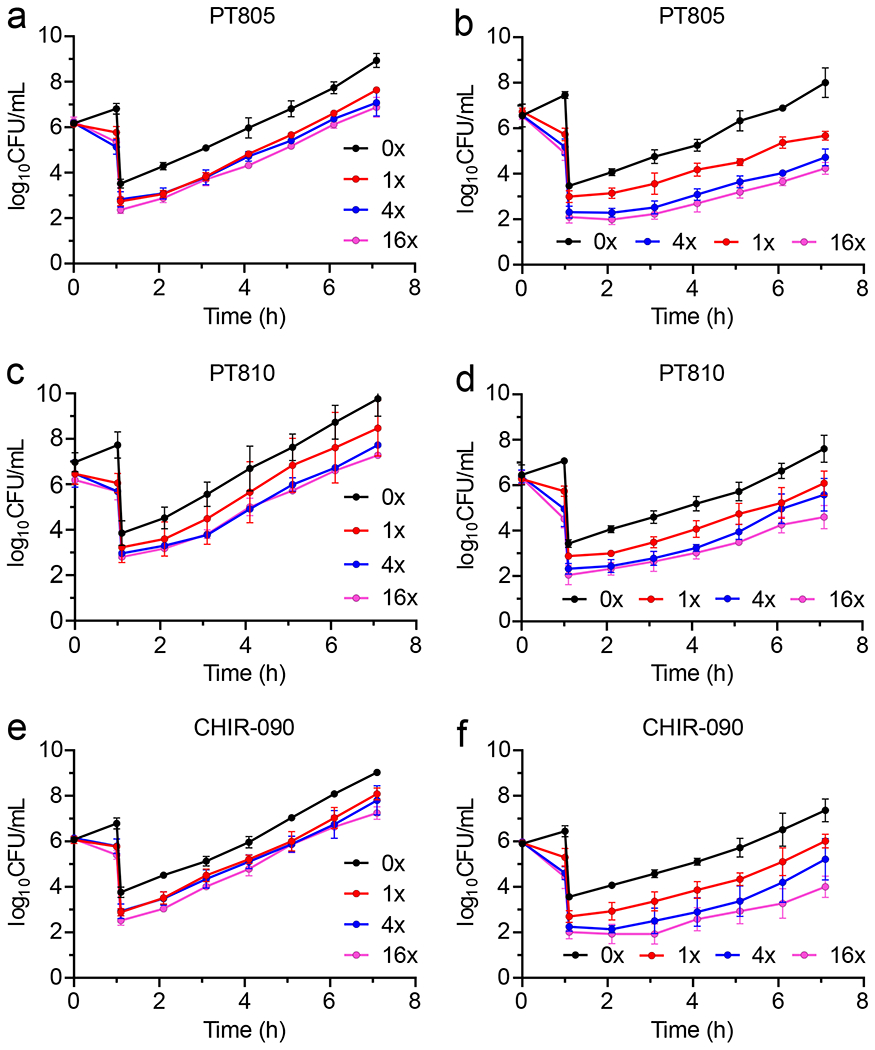
Cultures of wild-type or FabZ* E. coli (106 CFU/mL) were treated with 1x, 4x or 16x MIC of inhibitor for 1 h followed by 1:1000-fold dilution into fresh cation-adjusted Mueller-Hinton (CaMH) media at 37 °C. Samples (100 μL) of the diluted cultures were then plated on Muller-Hinton agar plates every hour and CFUs enumerated following incubation of the plates at 37 °C for 16 h. PAE data for wild-type E. coli are in panels (a) PT805, (c) PT810 and (e) CHIR-090, and for FabZ* E. coli in (b) PT805, (d) PT810 and (f) CHIR-090. The experimental data points are the mean values from triplicate, independent measurements and the error bars represent the standard deviation from the mean.
Post-antibiotic effect of LpxC inhibitors in the FabZ E. coli strain and in the presence of macrolides
Based on the hypothesis that the lack of PAE for the ecLpxC inhibitors in wild-type E. coli was due to rapid turnover of the target, we determined PAEs under conditions designed to increase the stability of ecLpxC. This included use of an E. coli strain (FabZ*) containing a hyperactive mutant of the fatty acid biosynthesis β-hydroxyacyl-ACP enzyme (FabZ), and determination of PAEs for wild-type E. coli in the presence of sub-MIC concentrations of macrolides.
We first measured the MIC values for PT805, PT810 and CHIR-090 in the FabZ* strain, which were ~2-60 fold lower than the corresponding MICs for the wild-type strain, and then determined the PAEs at 1x, 4x and 16x MIC (Figure 2). In contrast to wild-type E. coli, PAEs of 0.5-2.4 h were observed: for instance, at 4xMIC the PAEs were 1.53±0.13 h, 0.76±0.19 h and 1.34±0.04 for PT805, PT810 and CHIR-090, respectively (Table 1). We also determined PAEs of three antibiotics with different mechanisms of action. In contrast to the ecLpxC inhibitors, no difference in PAE was observed between the wild-type and FabZ* strains for erythromycin, which had a PAE of 0.8±0.05 h in both strains, or cefamandole and trimethoprim which failed to generate a PAE in either strain (Figure S3, Table 1).
We then repeated the PAE measurements for wild-type E. coli in the presence of sub-MIC levels of the protein synthesis inhibitor azithromycin. First, we determined if azithromycin showed a significant shift in MIC if wild-type E. coli was first exposed to 16x MIC of the inhibitors prior to dilution into media containing azithromycin. In each case the MIC of azithromycin decrease 4-fold from 12 μM to 3.25 μM following pre-treatment with the ecLpxC inhibitors or 2-fold from 12 μM to 6.2 μM following pre-treatment with cefamandole, which was included as a control. The shifted MIC was then used to calculate the sub-MIC concentrations of azithromycin used in the subsequent experiments.
Following exposure of bacteria to 16x MIC of each ecLpxC inhibitor or cefamandole, cultures were diluted 1:1000-fold into media containing 0, 0.2 or 0.4xMIC azithromycin. Whereas no PAE was observed in the absence of macrolides, significant PAEs were observed in the presence of sub-MIC azithromycin for PT805, PT810, and CHIR-090, but not for the control antibiotic cefamandole (Figure 3, Table 1). For example, the PAE values at 0.4xMIC azithromycin were 2.4±0.1, 2.6±0.8 and 3.7±0.2 h for PT805, PT810 and CHIR-090, respectively (Table 1).
Figure 3: Post-antibiotic effect in the presence of sub-MIC azithromycin.
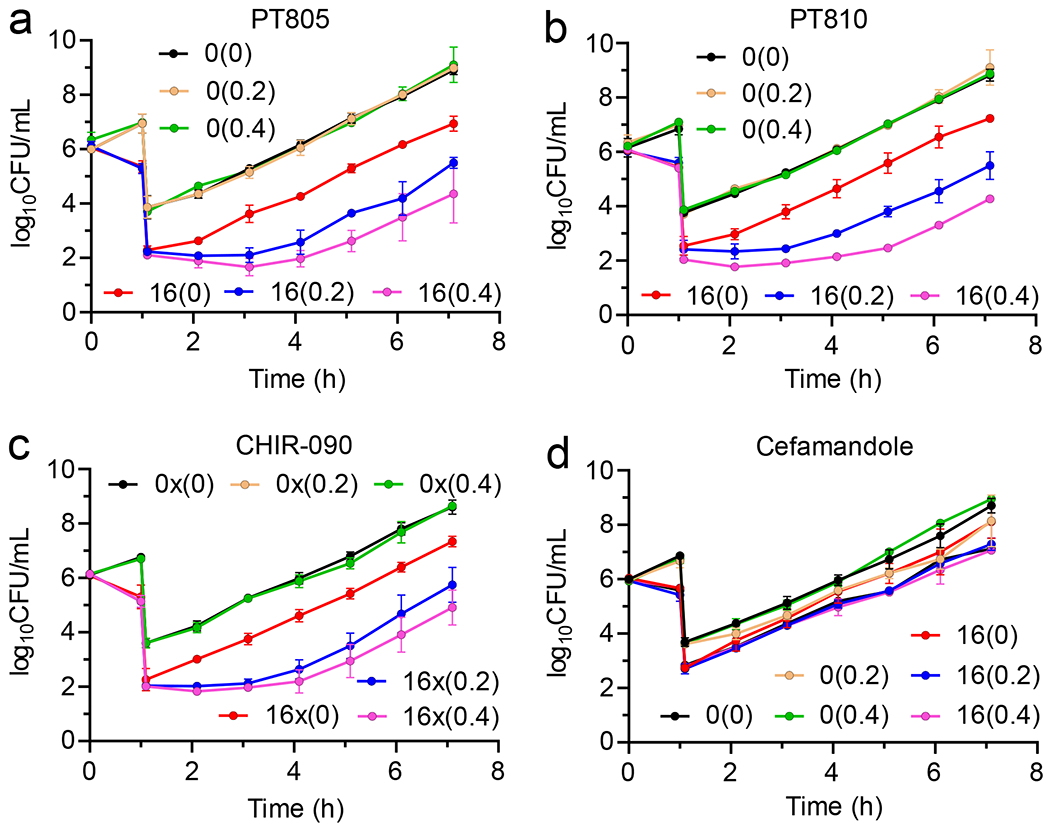
Cultures of wild-type E. coli (K12 MG1655) 106 CFU/mL were treated with 0x or 16x MIC of inhibitor for 1 h followed by 1:1000-fold dilution into fresh CaMH media containing 0x, 0.2x or 0.4xMIC azithromycin at 37 °C. Samples (100 μL) of the diluted cultures were then plated on Muller-Hinton agar plates every hour and CFUs were enumerated following incubation of the plates at 37 °C for 16 h. PAE data are shown for (a) PT805, (b) PT810 and (c) CHIR-090 and (d) cefamandole. Values in parenthesis are the concentration of azithromycin in the media (0x, 0.2x or 0.4x MIC). The experimental data points are the mean values from triplicate, independent measurements and the error bars represent the standard deviation from the mean.
Rate of ecLpxC turnover
To quantify protein turnover rates, we metabolically labelled E. coli cells with isotopically-labelled “heavy” lysine 13C6,15N2 (Lys8) and diluted the cells into media containing normal “light” lysine (Lys0). The 0-time point sample taken from purely “heavy” labelled media indicated the starting point of the experiment and also the percent incorporation of the “heavy” label. Subsequently the decay of the heavy label over time was analyzed by a high-resolution mass spectrometry-based method. After harvesting and lysing bacterial cells, ecLpxC was then enriched from the lysate using an antibody-based pull-down method, because we were unable to identify peptides specific to ecLpxC directly from the lysate. The enrichment method increased the coverage, and we were able to identify 20 unique peptides in each of the three biological replicates of which 5 peptides showed lysine incorporation consistently. However, with the enrichment process, other proteins were also present in the enriched sample, which bound non-specifically to the beads (Table S1).23
The incorporation of the heavy label in both the wild-type and the mutant strain was ~90% as determined by Relative Isotopic Abundance (RIA) values.24–25 We measured time points ranging from 5 to 80 min after transfer to “light” labelled lysine media. For ecLpxC in wild-type E. coli biological replicates showed high reproducibility, although for the wild-type the first 5 min time point showed variability which could be due to the low abundance of the protein.26 The data plotted in Figure 4 shows a faster decay of the label for ecLpxC in wild-type E. coli as compared to that of the FabZ* mutant giving half-lives of 12 and 35 min, respectively (Table 2).
Figure 4: Protein turnover by pSILAC mass spectrometry.
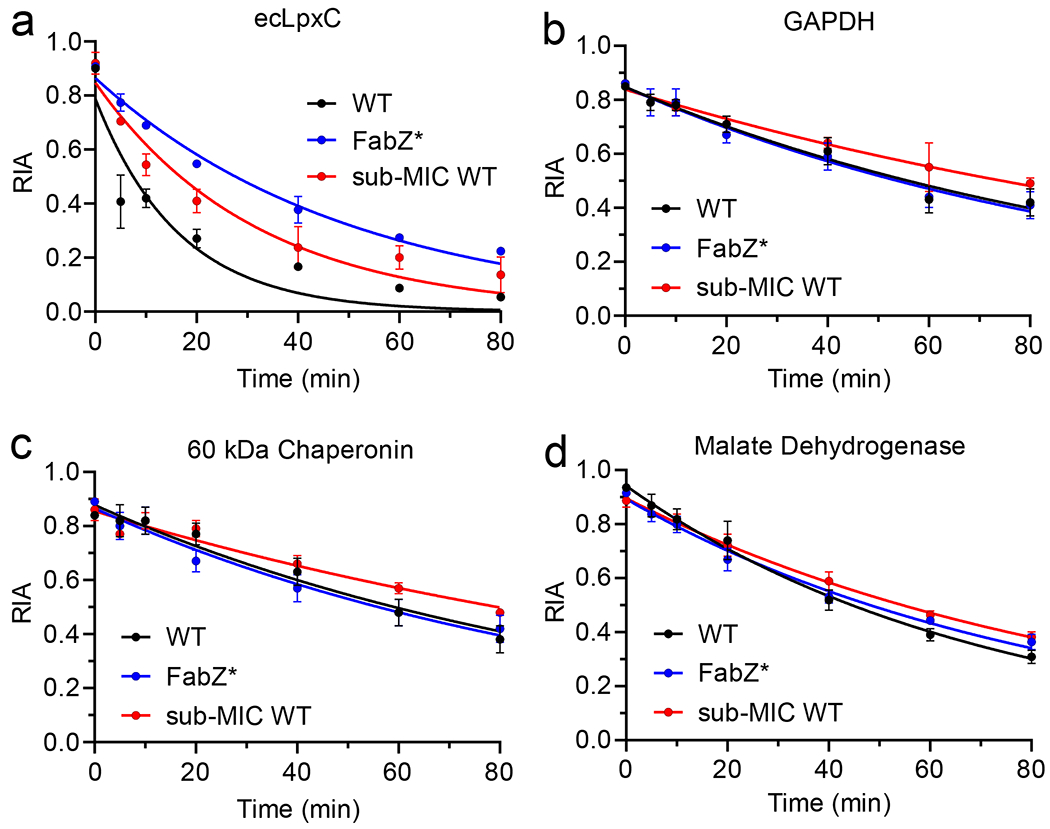
Protein turnover was quantified in the wild-type strain of E. coli (black), the FabZ* mutant strain (blue), and in the wild-type strain grown in media containing sub-MIC concentration of azithromycin (0.4xMIC) (red). In each case the relative isotopic abundance (RIA) was determined as a function of time after transferring bacterial cultures grown in media containing “heavy” lysine to media containing normal “light” lysine. The RIA was calculated by quantifying the isotopic abundance of peptides generated by trypsin digest using mass spectrometry. ecLpxC (A) was enriched using antibody pull-down with beads coated with the ecLpxC antibody. This method also led to the enrichment of several other proteins that were used as controls including GAPDH (B), 60 kDa chaperonin (C), and malate dehydrogenase (D). Each point represents average of three independent biological replicates where the error bars represent the standard deviation from the mean.
Table 2:
Protein turnover rates from pSILAC mass spectrometry
| Wild-Typea | FabZ*a | |||||
|---|---|---|---|---|---|---|
| (sub-MIC AZ)b | ||||||
| k (min−1) | Half-life (min) | k (min−1) | Half-life (min) | k (min−1) | Half-life (min) | |
| ecLpxC | 0.06±0.01 | 12±2 | 0.03±0.01 | 23±2 | 0.02±0.01 | 35±1 |
| Glyceraldehyde-3-phosphate dehydrogenase | 0.009±0.001 | 77±6 | 0.007±0.001 | 99±7 | 0.009±0.001 | 71±7 |
| 60 kDa Chaperonin | 0.009±0.001 | 73±10 | 0.006±0.001 | 103±18 | 0.009±0.001 | 71±9 |
| Malate dehydrogenase | 0.014±0.005 | 50±1 | 0.011±0.002 | 65±3 | 0.012±0.006 | 57±3 |
| Glutamine synthase | 0.010±0.001 | 69±3 | 0.008±0.001 | 86±11 | 0.009±0.001 | 77±6 |
| Outer membrane protein A | 0.009±0.001 | 77±6 | 0.011±0.001 | 63±8 | 0.011±0.001 | 64±9 |
| 30S ribosomal protein S16 | 0.010±0.001 | 68±5 | 0.008±0.001 | 83±12 | 0.010±0.001 | 68±10 |
| 30S ribosomal protein S5 | 0.010±0.001 | 68±3 | 0.007±0.001 | 93±16 | 0.010±0.001 | 68±10 |
Turn-over SILAC experiments were performed in M9 media with wild-type K12 MG1655 E. coli strain and the FabZ hyperactive mutant E. coli strain.
0.4xMIC azithromycin was included in the media containing normal “light” lysine.
Each experiment was performed in three independent biological replicates with errors representing the standard deviation from the mean.
To assess whether the FabZ* mutant strain specifically affects the turn-over of LpxC, we took advantage of other proteins that were being enriched by the pull-down experiment including several housekeeping proteins that should not be affected by the genetic mutation that specifically targets LpxC turn-over.27 Consistent with our expectations, proteins such as GAPDH, 60 kDa chaperonin, malate synthase, glutamine synthase, outer membrane protein A, and the 30S ribosomal proteins S16 and S5, had similar half-lives and degradation constants in both the wild-type and the mutant strains (Figure 4, Figure S4, Table 2).
We also assessed the rate of protein turnover in the presence of sub-MIC concentrations of azithromycin. pSILAC in the presence of 0.4x(1.25μM) azithromycin gave a half-life of ecLpxC of 22 min, which was 2-fold higher than the rate in the absence of macrolide. Other proteins detected in the pull-down experiment were similarly affected and showed increased half-lives in the presence of sub-MIC azithromycin (Figure 4, Figure S4, Table 2).
Discussion
Drug selectivity has both thermodynamic and kinetic components enabling compound selection and optimization to be guided by both the affinity for the target as well as the rate constants for formation and breakdown of the drug-target complex.9–10, 28–33 In our efforts to delineate the factors that underly the implementation of kinetic selectivity, we identified target vulnerability and target turnover as critical factors in modulating the translation of extended target occupancy to prolonged drug activity.7–8 In antibacterial space, time-dependent drug activity can be assessed using the post-antibiotic effect (PAE), which is the delay in bacterial growth following compound washout.34 While several mechanisms can be responsible for the PAE, we previously described correlations between drug-target residence time and PAE demonstrating that the ribosome and the LpxC enzyme from P. aeruginosa were highly vulnerable targets in contrast to, for example, the penicillin binding proteins (PBPs) from several bacterial species.35–36 In an extension of this work have now explored the vulnerability of LpxC in E. coli and demonstrate that no PAE can be observed of inhibitors of E. coli LpxC. Using a strategy to stabilize ecLpxC, we now directly link the lack of a PAE in E. coli with the rapid turnover of ecLpxC.
We chose three ecLpxC inhibitors for analysis with residence times on the enzyme ranging from 6-66 min at 25 °C. In contrast to inhibitors of paLpxC in P. aeruginosa,10 no PAE was observed for the ecLpxC inhibitors in a wild-type strain of E. coli. In both cases the LpxC inhibitors are cidal, and in P. aeruginosa even paLpxC inhibitors with short residence time gave a PAE of ~ 1 h.10 Cognizant of studies which showed that ecLpxC was much less stable than the corresponding enzyme in P. aeruginosa, we hypothesized that the lack of PAE in E. coli might be due to rapid target turnover, which we have proposed is the reason why β-lactam antibiotics do not generate a PAE in E. coli despite being covalent inhibitors of PBPs.7
The stability and intracellular levels of ecLpxC are controlled by the essential AAA protease FtsH.14, 16–17, 37 Using pulse chase labelling with 35S, Ogura et al. determined the half-life of ecLpxC to be 5.8 min at 37 °C and demonstrated that LpxC stability was dramatically increased (t1/2 > 60 min) in an E. coli strain with a mutation that resulted in hyperactivity of the fatty acid biosynthesis enzyme β-hydroxyacyl-ACP dehydrase FabZ (L85P, FabZ*).15 Both LPS and fatty acid biosynthesis use a common precursor, R-3-hydroxymyristoyl-ACP, and the increase in stability of ecLpxC in the FabZ* strain is thought to compensate for hyperactivity of FabZ and ensure that fatty acid and LPS biosynthesis remains balanced.15 Subsequently, Narberhaus and co-workers analysed the susceptibility of LpxC to FtsH degradation in different bacterial species and concluded that the C-terminus of LpxC serves as a degradation signal for FtsH. By monitoring the degradation of LpxC following inhibition of protein synthesis, ecLpxC and paLpxC were found to have half-lives of 4 min and 93 min, respectively,14, 16, 37 and that overexpression of FabZ was found to increase the half-life of ecLpxC to 69 min.17
Our studies reveal that whereas the ecLpxC inhibitors do not give a PAE in wild-type E. coli, PAE values of 0.9-2.4 h were observed at 16x MIC in the FabZ* strain. This effect appeared to be LpxC-specific since the control antibiotics erythromycin (macrolide), cefamandole (β-lactam) and trimethoprim (folate biosynthesis) had the same PAE values in both wild-type and FabZ* strains (Table 1). Consistent with previous findings, neither cefamandole nor trimethoprim showed a PAE with the wild-type strain,34 a result that was reproduced in the FabZ* strain. Similarly, erythromycin gave a PAE of 0.7-1.4 h (4x and 16xMIC) in both strains, again consistent with previous reports.34, 38–39
We subsequently used pSILAC to quantify ecLpxC turnover and measured half-lives of 12 min and 35 min in wild-type and FabZ* E. coli, respectively (Table 2), in general agreement with previous studies.15, 17 The ecLpxC antibody pull-down method also resulted in the enrichment of several other proteins that served as controls for the pSILAC experiments and revealed that hyperactivity of FabZ only affected the stability of ecLpxC. While the control proteins all had significantly longer half-lives than ecLpxC in wild-type E. coli to begin with (12 compared to 50-80 min), the results support a specific effect on LpxC stability.
To further explore the relationship between protein stability and PAE, we measured PAE values and the rate of protein turnover in the presence of sub-MIC concentrations of azithromycin (0.2-0.4xMIC). Sub-MIC concentrations of the macrolides azithromycin and erythromycin are known to reduce the rate of protein synthesis, generally without affecting viability39–40,41 We therefore surmised that the presence of sub-MIC macrolide in the PAE phase would reduce the rate of ecLpxC biosynthesis, and or of the protease FtsH that regulates levels or ecLpxC, thereby resulting in an increase in protein stability. Indeed, whereas no PAE was observed for wild-type E. coli in the absence of macrolide, introduction of even 0.2xMIC azithromycin resulted in a robust (1.4-2.8 h) PAE for the ecLpxC inhibitors. To validate if sub-MIC macrolide had indeed increased the stability of ecLpxC, we performed pSILAC experiments which revealed a 2-fold increase in the half-life of ecLpxC (t1/2 12 to 23 min) in the presence of 0.4xMIC azithromycin. Consistent with a general effect on protein synthesis, the sub-MIC macrolide also resulted in an increase in the half-lives of the control proteins (1.2-1.4-fold) with the exception of OmpA which showed a slight decrease in stability (Table 2).
CONCLUSION
The impact of molecular approaches that stabilize LpxC in E. coli highlight the central role that protein turnover plays in controlling the translation of sustained target occupancy to prolonged drug activity. Using the PAE as a metric for time-dependent antibacterial activity, we show that rapid target turnover masks the effect of drug-target residence time. A reduction in the rate of target turnover restores the coupling between target occupancy and PAE, with only a relatively small (2-3-fold) change in stability needed to generate a robust PAE. At a wider level, the data reinforce that covalent inhibitor discovery should focus on targets that turnover slowly and that approaches to increase target stability,33 for example using transcription/translation inhibitors, are likely to result in a significant widening of the therapeutic window derived from kinetic selectivity.
METHODS
Compounds:
CHIR-090 was purchased from Apexbio and azithromycin was purchased from Sigma-Aldrich. 13C6,99%;15N2 (heavy) L-Lysine:2HCl was purchased from Cambridge Isotopes Laboratories. The synthesis of PT805, PT810 and PT900 are described in the supporting information. PT805 was first reported by Montgomery et al,18 and PT900 was a generous gift from AstraZeneca.
Bacterial Strains:
Wild-type E. coli strain K12 sub strain MG1655 was obtained from ATCC (ATCC 700926). The FabZ hyperactive E. coli strain (FabZ*) was a generous gift from Professor Ogura, Kumamoto University.15 The FabZ* strain is a derivative of W3110 E.coli K12 in which there is a mutation in the sfhc21 gene (position 202101-202556) leading to the L85P mutation in FabZ. Whole genome sequencing (Admera Health) verified the single base T to C mutation at position 202354, confirming published reports.15 The frameshift mutation in the rph gene was also confirmed.42
Cloning, Expression and Purification of E. coli LpxC (ecLpxC):
The E. coli lpxC gene was amplified from the E. coli MG1655 genomic DNA using Phusion High-Fidelity DNA Polymerase (NEB) and the primers:
ecLpxC forward: 5’- AT CATATGATCAAACAAAGGACACTTAAACGTA −3’
ecLpxC reverse: 5’- AT GAATTCTTATGCCAGTACAGCTGAAGGCGCTTTGAA −3’
The PCR product was digested with NdeI and EcoR1 and inserted into doubled-digested pET-24a plasmid using T4 DNA ligase (NEB). Positive clones were identified by PCR screening using T7 promoter and T7 reverse primers. The correct construct was confirmed by DNA sequencing.43
The purification of LpxC from E. coli was performed following the method reported by Clements et al.43 Briefly, a 2 L culture of BL21(DE3) E. coli cells transformed with the pET-24a/LpxC plasmid was grown to an (OD600) of 0.6. IPTG was then added to a final concentration of 1 mM and the cells were incubated at 18 °C over-night in an orbital shaker. The cells were then harvested by centrifugation at 5000xg (15 min), and the cell pellet was re-suspended and washed once with 50 mL of ice-cold 10 mM K2HPO4, pH 8.0 buffer (Buffer A) and stored at −80 °C. The cell pellet was then resuspended in 100-120 mL of Buffer A and sonicated on ice for 10 min with 30 s interval by using a medium probe at 90% power (Fisher Scientific Sonic Dismembrator 100). The cell debris was pelleted by ultracentrifugation at 40,000xg for 1 h and the lysate was filtered with a 0.22 μm filter. The lysate was then loaded onto a Hi-Trap Q-Sepharose Fast Flow anion exchange column (14.7 × 29.8 mm) pre-equilibrated with Buffer A and using a flow rate of 5 mL/min. The column was washed with the same buffer until the A280 returned to baseline after which the protein was eluted using a gradient from 0-1M NaCl in Buffer A. The protein eluted at around 0.45 M NaCl and was analyzed by SDS-PAGE. The fractions containing the protein were pooled and concentrated to around 3 mL using a 30 kDa-cutoff Centricon ultracentrifugation device (Millipore, Watford, UK). The protein sample was loaded onto a Hi Trap™16/600 Superdex 75 column pre-equilibrated with Buffer A, and the protein was eluted at 1 mL/min with Buffer A at 4 °C. The fractions showing UV absorbance were collected, concentrated, and analyzed by SDS-PAGE. The concentration of the protein was determined at A280, using a calculated extinction coefficient of 24,500 M−1cm−1.
Residence Time Measurements:
Inhibitor residence times were determined by monitoring the rate of association of a fluorescent probe to the enzyme-inhibitor complexes using a Penefsky column-based method. Fifty μL of a solution containing 10 μM purified ecLpxC and 20 μM of LpxC inhibitor (CHIR-090, PT810 or PT805) in 25 mM NaH2PO4, pH 8.0 buffer containing 300 mM KCl and 0.1 mg/mL BSA, was incubated at 25 °C for 16 h. Then, 5 μL of the incubated mixture was rapidly diluted into 1 mL of the reaction buffer containing 1 μM fluorescence competitor PT900 at 25 °C. Subsequently, 100 μL aliquots of the diluted mixture were collected at different time points and loaded onto the spin-column (PD SpinTrap™ G-25, Cytiva), which was then centrifuged in a swinging bucket rotor (Eppendorf 5810R, 15-amp version) at 800xg for 2 min. One hundred μL aliquots of the eluate were dispensed into 96 well black bottom plates (Corning, NY) in duplicate, and the fluorescence intensity was quantified using a plate reader (BioTek, Gen5, 3.09) at λex 315 nm and λem 420 nm. The change in fluorescence as a function of time was fit to a one-phase association equation in GraphPad Prism 9.0. The rate of PT900 association to ecLpxC was taken to be equivalent to the overall off rate for dissociation of the inhibitor from ecLpxC (koff), and residence times (tR) were calculated by taking the reciprocal of koff (tR = 1/koff).
Minimum Inhibitory Concentration (MIC) measurements:
Antibacterial susceptibility tests for aerobically growing bacteria were performed with the microbroth dilution assay according to the Clinical and Laboratory Standard Institute, using visual inspection of cells grown in transparent 96-well plates.44 Briefly, bacteria were grown to mid log phase (OD600 of 0.6-0.7) in cation-adjusted Mueller-Hinton (CaMH) media at 37 °C in an orbital shaker. A final inoculum concentration of 106 CFU/mL per well was added to media containing 2-fold dilutions of inhibitors to give final concentrations ranging from 0.009 μM to 20 μM. The MIC was defined as the minimum concentration of inhibitor at which no visible growth could be detected after 24 h of incubation at 37 °C.
To determine the MIC of azithromycin following exposure of wild-type E. coli to the ecLpxC inhibitors, cultures of E. coli were treated with 16xMIC of the inhibitor for 1 h. Subsequently the drug-treated culture was diluted 1000-fold into media containing 2-fold dilutions of azithromycin to give final concentrations ranging from 0.05-100 μM. The MIC was defined as the minimum concentration of inhibitor at which no visible growth could be detected after 24 h incubation at 37 °C.
Post-antibiotic effect (PAE):
Bacteria were grown to mid log phase (OD600 of 0.6-0.7) in CaMH media at 37 °C and then exposed to different concentrations of ecLpxC inhibitors, antibiotics, or vehicle (DMSO). After shaking for 1 h at 37 °C, cultures were diluted 1000-fold into fresh CaMH media to remove unbound drug. Regrowth was monitored by taking 0.1 mL aliquots at 1 h time intervals and plating serial dilutions on Muller-Hinton agar plates. The CFUs were determined by counting colonies after overnight incubation at 37 °C. The post-antibiotic effect (PAE) was calculated as the time required for the antibiotic-treated cell population to increase 1 log10 CFU minus the time needed for the control population to increase by 1 log10 CFU.34 Each time point was performed in duplicate or triplicate and the entire PAE experiment was performed in triplicate.
The PAE in the presence of sub-MIC concentrations of azithromycin was determined using the same method except that the exposed cultures were diluted 1000-fold into CaMH media containing 0.2x or 0.4xMIC of azithromycin.
Time-kill assay:
Bacteria were grown to mid log phase (OD600 of 0.6-0.7) in CaMH media at 37 °C and then exposed to 16x concentration of ecLpxC inhibitors or vehicle (DMSO). Subsequently, 0.1 mL aliquots were taken at 1 h time intervals and plated in serial dilutions on Muller-Hinton agar plates. The CFUs were determined by counting colonies after overnight incubation at 37 °C. Bactericidal activity was defined as a reduction in CFUs of 3 log10 CFU/mL within the first 3 h.
pSILAC:
The E. coli wild type strain and FabZ* mutant strain were first inoculated overnight in 5 mL M9 minimal media (Sigma-Aldrich), consisting of M9 salts (6.78 g/L Na2HPO4, 3 g/L KH2PO4, 0.5 g/L NaCl, 1 g/L NH4Cl) supplemented with 0.5% (w/v) glucose, 33 μM thiamine, 1 mM MgSO4, 0.1 mM CaCl2, 1 mM trace metal solution and 100 μg/mL Minimum Essential Medium (MEM, Millipore Sigma). Afterwards, the culture media was replaced with 500 mL of M9 media containing 30 mg/L of “heavy” L-Lysine:2HCl (13C6,99%;15N2 Cambridge Isotopes Laboratories). The cells were allowed to grow at 37 °C in a shaking incubator (250 rpm) until an OD600 of 0.4-0.6 was reached (corresponding to mid-exponential growth). One hundred mL of the culture was then removed as the 0 min time point sample and the cells were harvested by pelleting at 3,900 rpm for 20 min. The remainder of the culture was also pelleted, washed three times with 1x Hank’s Blank Salt Solution (HBSS, Sigma Aldrich), and then transferred to M9 media containing 30 mg/L “light” L-Lysine:2HCl (unlabeled; Cambridge Isotope Laboratories), and incubated at 37 °C, in a shaking incubator (250 rpm). One hundred mL culture aliquots were removed at 5, 10, 20, 40, 60 and 80 min, and the cells were pelleted at 3,900 rpm for 15-20 min. After washing once with 1x HBSS, the cell pellets were flash frozen in liquid nitrogen and stored at −80 °C for further processing.45
Protein turnover in the presence of sub-MIC concentrations of azithromycin was performed by exposing the “heavy” labelled M9 culture to 0.4x shifted MIC of azithromycin (the same concentration used in the PAE experiments). The cells were then transferred from the “heavy” media to the “light” media containing the same sub-MIC concentration of azithromycin. The cells were thereafter processed similarly as described above.
Cell lysis and protein quantitation:
The pellets were lysed in 1-2 mL of Lysis Buffer (20mM Tris-HCl, 150 mM NaCl, 1% Glycerol ,1% Triton-X 100 and 2 mM EDTA pH 8.0), containing protease inhibitor cocktail at a final 1x concentration (cOmplete™, Mini, EDTA-free, Sigma), by sonication at 60% amplitude for 2 min. The debris was then removed by centrifugation at 3,900xg for 15 min and the lysate was transferred to clean microcentrifuge tubes. The total protein in the cell lysate was quantified by Bradford assay (Bio-Rad).
Affinity purification of ecLpxC and on-bead trypsin digestion:
ecLpxC was enriched through Protein G magnetic beads (GenScript) with unconjugated ecLpxC polyclonal antibody (Biomatik USA) according to the manufacturer’s protocol. The beads were washed once with 100 mM NH4HCO3 and then treated with 5 mM DTT in 50 mM NH4HCO3 at 60 °C for 30 min. Subsequently the beads were exposed to 12 mM iodoacetamide for 45 min at RT to alkylate the cysteines and then digested with trypsin at 37 °C (1:1000) overnight. Peptides were then desalted on C18 S-Trap cartridges, lyophilized and re-suspended in 0.1% formic acid prior to LC-MS/MS analysis.
Peptide identification and quantification by LC-Tandem MS:
Peptides were analyzed by nano LC-MS/MS. Parent peptide mass, collision-induced fragment mass information and isotopically-encoded peptide abundance values were obtained by a liquid chromatography-electrospray ionization tandem mass spectrometry (LC-MS/MS), using an orbital trap instrument (Thermo Q-Exactive HF) followed by protein database searching against a target database of E. coli K12. HPLC C18 columns were prepared using P-2000 CO2 laser puller (Sutter Instruments) and silica tubing (75μm ID x ~15cm) and were self-packed with 3 μm Reprosil C 18 resin. Peptides were separated on the resolving column with a flow rate of 300 nL/min, using a gradient elution step 0-40% with acetonitrile (MeCN) and 0.1% formic acid (0.23%/min) over 40 min, followed by a 10 min wash with 90% MeCN and a 10 min wash step with isocratic 90% MeCN. Electrospray ionization was achieved using a spray voltage of ~2.2kV. Data-dependent MS and MS-MS acquisitions were made using a survey scan (m/z 400-1600) with maximum fill of 50 ms followed typically by 20 consecutive product ion scans (m/z 100-1800). Parent ion with charge states of 2+, 3+ and 4+ were selected with a 15 s exclusion period. MS data were collected using Xcaliber (Thermo).
Protein and peptide quantification and identification:
Proteins were identified from the survey and product ion spectra data using Proteome Discoverer 2.3 (Thermo). Three missed tryptic cleavages were allowed, and posttranslational modifications considered including cysteine carbamidomethylation, NQ-deamidation and MET-oxidation. Quantitation was based on heavy/light Lys incorporation. Database searches used E. coli UniProt FASTA database (including common contaminants). False discovery rates of protein identification were <1%.
Protein Turnover Calculation:
The protein turnover calculation was performed as described.46–47 Briefly, the relative isotopic abundance at time t (RIAt) was calculated by dividing the abundance of heavy isotope (AH) by the sum of the abundance of both light (AL) and heavy isotopes (AH) (equation 1).
| 1 |
The data obtained from SILAC were fit to a one phase exponential decay equation in GraphPad Prism 9 (equation 2),
| 2 |
where Y is RIAt (RIA at specific time point t), Y0 is RIA at t=0 (RIA0), NS is RIA at t= ∞ (RIA∞, tmax= 80 min; Plateau), k = kloss, and X is time (t). The above equation can be related to equation 3,
| 3 |
where RIA∞ is relative isotope abundance at infinite time after starting the experiment and RIA0 is the relative isotope abundance at the moment of starting the chase experiment. The half-life was calculated by dividing 0.693 by kloss
Supplementary Material
Synopsis.
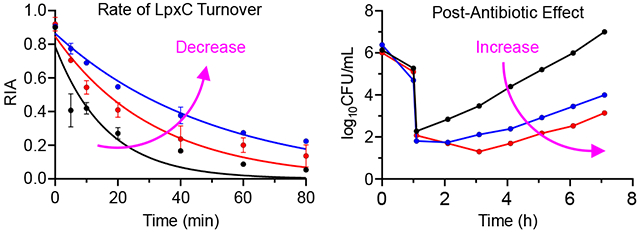
The TOC Graphic summarizes the relationship between the rate of LpxC turnover and the post-antibiotic effect (PAE) caused by inhibitors of LpxC. The PAE is the delay in bacterial growth following compound washout, and in wild-type E. coli the rate of LpxC turnover is sufficiently rapid so that there is no translation of drug-target residence time to a PAE. However a 2-3 fold decrease in the rate of LpxC turnover increases the vulnerability of LpxC sufficiently so that a robust PAE of 1-4 h is now observed. The data substantiate the critical role that target vulnerability plays in kinetic selectivity and time-dependent drug activity.
ACKNOWLEDGMENTS
This work was supported by NIH grant GM102864 to P.J.T.
Footnotes
Supporting Information
The Supporting Information is available free of charge on the ACS Publications website at DOI: 10.1021/acsinfecdis.1c00317.
Supporting figures for inhibitor off-rate measurements, time kill assays, post-antibiotic effect data, compound synthesis and characterization.
CONFLICT OF INTEREST STATEMENT
The authors declare the following competing financial interest(s): P.J.T. is the cofounder of Chronus Pharmaceuticals Inc.
REFERENCES
- 1.Payne DJ, Gwynn MN, Holmes DJ and Pompliano DL (2007) Drugs for bad bugs: confronting the challenges of antibacterial discovery. Nat Rev Drug Discov 6, 29–40. DOI: 10.1038/nrd2201. [DOI] [PubMed] [Google Scholar]
- 2.Silver LL (2011) Challenges of antibacterial discovery. Clin Microbiol Rev 24, 71–109. DOI: 10.1128/CMR.00030-10. [DOI] [PMC free article] [PubMed] [Google Scholar]
- 3.Tommasi R, Brown DG, Walkup GK, Manchester JI and Miller AA (2015) ESKAPEing the labyrinth of antibacterial discovery. Nat Rev Drug Discov 14, 529–542. DOI: 10.1038/nrd4572. [DOI] [PubMed] [Google Scholar]
- 4.Kaur P, Agarwal S and Datta S (2009) Delineating bacteriostatic and bactericidal targets in mycobacteria using IPTG inducible antisense expression. PLoS One 4, e5923. DOI: 10.1371/journal.pone.0005923. [DOI] [PMC free article] [PubMed] [Google Scholar]
- 5.Ramachandran V, Singh R, Yang X, Tunduguru R, Mohapatra S, Khandelwal S, Patel S and Datta S (2013) Genetic and chemical knockdown: a complementary strategy for evaluating an anti-infective target. Adv Appl Bioinform Chem 6, 1–13. DOI: 10.2147/AABC.S39198. [DOI] [PMC free article] [PubMed] [Google Scholar]
- 6.Wei JR, Krishnamoorthy V, Murphy K, Kim JH, Schnappinger D, Alber T, Sassetti CM, Rhee KY and Rubin EJ (2011) Depletion of antibiotic targets has widely varying effects on growth. Proc Natl Acad Sci U S A 108, 4176–81. DOI: 10.1073/pnas.1018301108. [DOI] [PMC free article] [PubMed] [Google Scholar]
- 7.Davoodi S, Daryaee F, Chang A, Walker SG and Tonge PJ (2020) Correlating Drug–Target Residence Time and Post-antibiotic Effect: Insight into Target Vulnerability. ACS Infect Dis 6, 629–636. DOI: 10.1021/acsinfecdis.9b00484. [DOI] [PMC free article] [PubMed] [Google Scholar]
- 8.Basak S and Tonge PJ, Drug Target Residence Time and the Pharmacodynamics of Antibacterial Agents. In Med Chem Rev, Bronson JJ, Ed. Medicinal Chemistry Division of the American Chemical Society: Washington, DC., 2020; Vol. 55, pp 367–380. [Google Scholar]
- 9.Tonge PJ (2018) Drug-Target Kinetics in Drug Discovery. ACS Chem Neurosci 9, 29–39. DOI: 10.1021/acschemneuro.7b00185. [DOI] [PMC free article] [PubMed] [Google Scholar]
- 10.Walkup GK, You Z, Ross PL, Allen EK, Daryaee F, Hale MR, O’Donnell J, Ehmann DE, Schuck VJ, Buurman ET, Choy AL, Hajec L, Murphy-Benenato K, Marone V, Patey SA, Grosser LA, Johnstone M, Walker SG, Tonge PJ and Fisher SL (2015) Translating slow-binding inhibition kinetics into cellular and in vivo effects. Nat Chem Biol 11, 416–23. DOI: 10.1038/nchembio.1796. [DOI] [PMC free article] [PubMed] [Google Scholar]
- 11.Schapira M, Calabrese MF, Bullock AN and Crews CM (2019) Targeted protein degradation: expanding the toolbox. Nat Rev Drug Discov 18, 949–963. DOI: 10.1038/s41573-019-0047-y. [DOI] [PubMed] [Google Scholar]
- 12.Whittington DA, Rusche KM, Shin H, Fierke CA and Christianson DW (2003) Crystal structure of LpxC, a zinc-dependent deacetylase essential for endotoxin biosynthesis. Proc Natl Acad Sci U S A 100, 8146–50. DOI: 10.1073/pnas.1432990100. [DOI] [PMC free article] [PubMed] [Google Scholar]
- 13.Barb AW, McClerren AL, Snehelatha K, Reynolds CM, Zhou P and Raetz CR (2007) Inhibition of lipid A biosynthesis as the primary mechanism of CHIR-090 antibiotic activity in Escherichia coli. Biochemistry 46, 3793–802. DOI: 10.1021/bi6025165. [DOI] [PMC free article] [PubMed] [Google Scholar]
- 14.Langklotz S, Schakermann M and Narberhaus F (2011) Control of lipopolysaccharide biosynthesis by FtsH-mediated proteolysis of LpxC is conserved in enterobacteria but not in all gram-negative bacteria. J Bacteriol 193, 1090–7. DOI: 10.1128/JB.01043-10. [DOI] [PMC free article] [PubMed] [Google Scholar]
- 15.Ogura T, Inoue K, Tatsuta T, Suzaki T, Karata K, Young K, Su LH, Fierke CA, Jackman JE, Raetz CR, Coleman J, Tomoyasu T and Matsuzawa H (1999) Balanced biosynthesis of major membrane components through regulated degradation of the committed enzyme of lipid A biosynthesis by the AAA protease FtsH (HflB) in Escherichia coli. Mol Microbiol 31, 833–44. DOI: 10.1046/j.1365-2958.1999.01221.x. [DOI] [PubMed] [Google Scholar]
- 16.Schakermann M, Langklotz S and Narberhaus F (2013) FtsH-mediated coordination of lipopolysaccharide biosynthesis in Escherichia coli correlates with the growth rate and the alarmone (p)ppGpp. J Bacteriol 195, 1912–9. DOI: 10.1128/JB.02134-12. [DOI] [PMC free article] [PubMed] [Google Scholar]
- 17.Thomanek N, Arends J, Lindemann C, Barkovits K, Meyer HE, Marcus K and Narberhaus F (2018) Intricate Crosstalk Between Lipopolysaccharide, Phospholipid and Fatty Acid Metabolism in Escherichia coli Modulates Proteolysis of LpxC. Front Microbiol 9, 3285. DOI: 10.3389/fmicb.2018.03285. [DOI] [PMC free article] [PubMed] [Google Scholar]
- 18.Montgomery JI, Brown MF, Reilly U, Price LM, Abramite JA, Arcari J, Barham R, Che Y, Chen JM, Chung SW, Collantes EM, Desbonnet C, Doroski M, Doty J, Engtrakul JJ, Harris TM, Huband M, Knafels JD, Leach KL, Liu S, Marfat A, McAllister L, McElroy E, Menard CA, Mitton-Fry M, Mullins L, Noe MC, O’Donnell J, Oliver R, Penzien J, Plummer M, Shanmugasundaram V, Thoma C, Tomaras AP, Uccello DP, Vaz A and Wishka DG (2012) Pyridone methylsulfone hydroxamate LpxC inhibitors for the treatment of serious gram-negative infections. J Med Chem 55, 1662–70. DOI: 10.1021/jm2014875. [DOI] [PubMed] [Google Scholar]
- 19.McClerren AL, Endsley S, Bowman JL, Andersen NH, Guan Z, Rudolph J and Raetz CR (2005) A slow, tight-binding inhibitor of the zinc-dependent deacetylase LpxC of lipid A biosynthesis with antibiotic activity comparable to ciprofloxacin. Biochemistry 44, 16574–83. DOI: 10.1021/bi0518186. [DOI] [PMC free article] [PubMed] [Google Scholar]
- 20.Penefsky HS (1979) A centrifuged-column procedure for the measurement of ligand binding by beef heart F1. Methods Enzymol 56, 527–30. DOI: 10.1016/0076-6879(79)56050-9. [DOI] [PubMed] [Google Scholar]
- 21.Yu W, Neckles C, Chang A, Bommineni GR, Spagnuolo L, Zhang Z, Liu N, Lai C, Truglio J and Tonge PJ (2015) A [(32)P]NAD(+)-based method to identify and quantitate long residence time enoyl-acyl carrier protein reductase inhibitors. Anal Biochem 474, 40–9. DOI: 10.1016/j.ab.2014.12.022. [DOI] [PMC free article] [PubMed] [Google Scholar]
- 22.Pankey GA and Sabath LD (2004) Clinical relevance of bacteriostatic versus bactericidal mechanisms of action in the treatment of Gram-positive bacterial infections. Clin Infect Dis 38, 864–70. DOI: 10.1086/381972. [DOI] [PubMed] [Google Scholar]
- 23.Keilhauer EC, Hein MY and Mann M (2015) Accurate protein complex retrieval by affinity enrichment mass spectrometry (AE-MS) rather than affinity purification mass spectrometry (AP-MS). Mol Cell Proteomics 14, 120–35. DOI: 10.1074/mcp.M114.041012. [DOI] [PMC free article] [PubMed] [Google Scholar]
- 24.Fröhlich F, Christiano R and Walther TC (2013) Native SILAC: Metabolic Labeling of Proteins in Prototroph Microorganisms Based on Lysine Synthesis Regulation. Mol Cell Proteomics 12, 1995. DOI: 10.1074/mcp.M112.025742. [DOI] [PMC free article] [PubMed] [Google Scholar]
- 25.Cargile BJ, Bundy JL, Grunden AM and Stephenson JL (2004) Synthesis/degradation ratio mass spectrometry for measuring relative dynamic protein turnover. Anal Chem 76, 86–97. DOI: 10.1021/ac034841a. [DOI] [PubMed] [Google Scholar]
- 26.Soufi B, Kumar C, Gnad F, Mann M, Mijakovic I and Macek B (2010) Stable Isotope Labeling by Amino Acids in Cell Culture (SILAC) Applied to Quantitative Proteomics of Bacillus subtilis. J Proteome Res 9, 3638–3646. DOI: 10.1021/pr100150w. [DOI] [PubMed] [Google Scholar]
- 27.Soares NC, Spät P, Krug K and Macek B (2013) Global Dynamics of the Escherichia coli Proteome and Phosphoproteome During Growth in Minimal Medium. J Proteome Res 12, 2611–2621. DOI: 10.1021/pr3011843. [DOI] [PubMed] [Google Scholar]
- 28.Copeland RA, Pompliano DL and Meek TD (2006) Drug-target residence time and its implications for lead optimization. Nat Rev Drug Discov 5, 730–9. DOI: 10.1038/nrd2082. [DOI] [PubMed] [Google Scholar]
- 29.Georgi V, Schiele F, Berger BT, Steffen A, Marin Zapata PA, Briem H, Menz S, Preusse C, Vasta JD, Robers MB, Brands M, Knapp S and Fernandez-Montalvan A (2018) Binding Kinetics Survey of the Drugged Kinome. J Am Chem Soc 140, 15774–15782. DOI: 10.1021/jacs.8b08048. [DOI] [PubMed] [Google Scholar]
- 30.Sykes DA, Dowling MR, Leighton-Davies J, Kent TC, Fawcett L, Renard E, Trifilieff A and Charlton SJ (2012) The Influence of receptor kinetics on the onset and duration of action and the therapeutic index of NVA237 and tiotropium. J Pharmacol Exp Ther 343, 520–8. DOI: 10.1124/jpet.112.194456. [DOI] [PubMed] [Google Scholar]
- 31.Daryaee F and Tonge PJ (2019) Pharmacokinetic-pharmacodynamic models that incorporate drug-target binding kinetics. Curr Opin Chem Biol 50, 120–127. DOI: 10.1016/j.cbpa.2019.03.008. [DOI] [PMC free article] [PubMed] [Google Scholar]
- 32.Berger BT, Amaral M, Kokh DB, Nunes-Alves A, Musil D, Heinrich T, Schroder M, Neil R, Wang J, Navratilova I, Bomke J, Elkins JM, Muller S, Frech M, Wade RC and Knapp S (2021) Structure-kinetic relationship reveals the mechanism of selectivity of FAK inhibitors over PYK2. Cell Chem Biol 28, 686–698 e7. DOI: 10.1016/j.chembiol.2021.01.003. [DOI] [PubMed] [Google Scholar]
- 33.Singh J, Petter RC, Baillie TA and Whitty A (2011) The resurgence of covalent drugs. Nat Rev Drug Discov 10, 307–17. DOI: 10.1038/nrd3410. [DOI] [PubMed] [Google Scholar]
- 34.Bundtzen RW, Gerber AU, Cohn DL and Craig WA (1981) Postantibiotic suppression of bacterial growth. Rev Infect Dis 3, 28–37. DOI: 10.1093/clinids/3.1.28. [DOI] [PubMed] [Google Scholar]
- 35.Daryaee F, Chang A, Schiebel J, Lu Y, Zhang Z, Kapilashrami K, Walker SG, Kisker C, Sotriffer CA, Fisher SL and Tonge PJ (2016) Correlating Drug-Target Kinetics and In vivo Pharmacodynamics: Long Residence Time Inhibitors of the FabI Enoyl-ACP Reductase. Chem Sci 7, 5945–5954. DOI: 10.1039/C6SC01000H. [DOI] [PMC free article] [PubMed] [Google Scholar]
- 36.Tuomanen E (1986) Newly made enzymes determine ongoing cell wall synthesis and the antibacterial effects of cell wall synthesis inhibitors. J Bacteriol 167, 535–43. DOI: 10.1128/jb.167.2.535-543.1986. [DOI] [PMC free article] [PubMed] [Google Scholar]
- 37.Fuhrer F, Langklotz S and Narberhaus F (2006) The C-terminal end of LpxC is required for degradation by the FtsH protease. Mol Microbiol 59, 1025–36. DOI: 10.1111/j.1365-2958.2005.04994.x. [DOI] [PubMed] [Google Scholar]
- 38.Minguez F, Ramos C, Loscos A, Chiu ML and Prieto J (1993) In vitro killing kinetics and postantibiotic effect of josamycin and other macrolides on several bacteria. Chemotherapy 39, 163–8. DOI: 10.1159/000239121. [DOI] [PubMed] [Google Scholar]
- 39.Odenholt-Tornqvist I, Lowdin E and Cars O (1995) Postantibiotic effects and postantibiotic sub-MIC effects of roxithromycin, clarithromycin, and azithromycin on respiratory tract pathogens. Antimicrob Agents Chemother 39, 221–6. DOI: 10.1128/aac.39.1.221. [DOI] [PMC free article] [PubMed] [Google Scholar]
- 40.Champney WS and Tober CL (1999) Molecular investigation of the postantibiotic effects of clarithromycin and erythromycin on Staphylococcus aureus cells. Antimicrob Agents Chemother 43, 1324–8. DOI: 10.1128/AAC.43.6.1324. [DOI] [PMC free article] [PubMed] [Google Scholar]
- 41.Tateda K, Ishii Y, Matsumoto T, Kobayashi T, Miyazaki S and Yamaguchi K (2000) Potential of macrolide antibiotics to inhibit protein synthesis of Pseudomonas aeruginosa: suppression of virulence factors and stress response. J Infect Chemother 6, 1–7. DOI: 10.1007/s101560050042. [DOI] [PubMed] [Google Scholar]
- 42.Jensen KF (1993) The Escherichia coli K-12 “wild types” W3110 and MG1655 have an rph frameshift mutation that leads to pyrimidine starvation due to low pyrE expression levels. J Bacteriol 175, 3401–7. DOI: 10.1128/jb.175.11.3401-3407.1993. [DOI] [PMC free article] [PubMed] [Google Scholar]
- 43.Clements JM, Coignard F, Johnson I, Chandler S, Palan S, Waller A, Wijkmans J and Hunter MG (2002) Antibacterial activities and characterization of novel inhibitors of LpxC. Antimicrob Agents Chemother 46, 1793–9. DOI: 10.1128/AAC.46.6.1793-1799.2002. [DOI] [PMC free article] [PubMed] [Google Scholar]
- 44.CLSI, Methods for Dilution Antimicrobial Susceptibility Tests for Bacteria That Grow Aerobically. In CLSI Standard M07, 11 ed.; Clinical and Laboratory Standards Institute: Wayne, PA, 2018. [Google Scholar]
- 45.Soufi B and Macek B (2014) Stable isotope labeling by amino acids applied to bacterial cell culture. Methods Mol Biol 1188, 9–22. DOI: 10.1007/978-1-4939-1142-4_2. [DOI] [PubMed] [Google Scholar]
- 46.Pratt JM, Petty J, Riba-Garcia I, Robertson DH, Gaskell SJ, Oliver SG and Beynon RJ (2002) Dynamics of protein turnover, a missing dimension in proteomics. Mol Cell Proteomics 1, 579–91. DOI: 10.1074/mcp.m200046-mcp200. [DOI] [PubMed] [Google Scholar]
- 47.Heo S, Diering GH, Na CH, Nirujogi RS, Bachman JL, Pandey A and Huganir RL (2018) Identification of long-lived synaptic proteins by proteomic analysis of synaptosome protein turnover. Proc Natl Acad Sci U S A 115, E3827. DOI: 10.1073/pnas.1720956115. [DOI] [PMC free article] [PubMed] [Google Scholar]
Associated Data
This section collects any data citations, data availability statements, or supplementary materials included in this article.