

Abstract
Spatial partitioning is a propensity of biological systems orchestrating cell activities in space and time. The dynamic regulation of plasma membrane nano-environments has recently emerged as a key fundamental aspect of plant signaling, but the molecular components governing it are still mostly unclear. The receptor kinase FERONIA (FER) controls ligand-induced complex formation of the immune receptor kinase FLAGELLIN SENSING 2 (FLS2) with its co-receptor BRASSINOSTEROID-INSENSITIVE 1-ASSOCIATED KINASE 1 (BAK1), and perception of the endogenous peptide hormone RAPID ALKALANIZATION FACTOR 23 (RALF23) by FER inhibits immunity. Here, we show that FER regulates the plasma membrane nanoscale organization of FLS2 and BAK1. Our study demonstrates that akin to FER, leucine-rich repeat (LRR) extensin proteins (LRXs) contribute to RALF23 responsiveness and regulate BAK1 nanoscale organization and immune signaling. Furthermore, RALF23 perception leads to rapid modification of FLS2 and BAK1 nanoscale organization, and its inhibitory activity on immune signaling relies on FER kinase activity. Our results suggest that perception of RALF peptides by FER and LRXs actively modulates plasma membrane nanoscale organization to regulate cell surface signaling by other ligand-binding receptor kinases.
Research organism: A. thaliana
Introduction
Multicellular organisms evolved sophisticated surveillance systems to monitor changes in their environment. In plants, receptor kinases (RKs) and receptor proteins (RPs) are the main ligand-binding cell-surface receptors perceiving self, non-self, and modified-self molecules (Hohmann et al., 2017). For example, recognition of pathogen-associated molecular patterns (PAMPs) by pattern recognition receptors (PRRs) initiates signaling events, leading to pattern-triggered immunity (PTI) (DeFalco and Zipfel, 2021). The Arabidopsis thaliana (hereafter Arabidopsis) leucine-rich repeat receptor kinases (LRR-RKs) FLS2 and EFR recognize the bacterial PAMPs flagellin (or its derived epitope flg22) and elongation factor-Tu (or its derived epitope elf18), respectively (Gómez-Gómez and Boller, 2000; Zipfel et al., 2006). Both FLS2 and EFR form ligand-induced complexes with the co-receptor BAK1 (a LRR-RK also referred as SERK3) to initiate immune signaling, such as the production of apoplastic reactive oxygen species (ROS), and calcium influx (Chinchilla et al., 2007; Heese et al., 2007; Schulze et al., 2010; Roux, 2011; Sun et al., 2013; Thor et al., 2020).
We previously showed that the Catharanthus roseus RECEPTOR-LIKE PROTEIN KINASE 1-LIKE (CrRLK1L) FERONIA (FER) and the GPI-anchored protein LORELEI-LIKE GPI-ANCHORED PROTEIN 1 (LLG1) are required for flg22-induced FLS2-BAK1 complex formation (Stegmann et al., 2017; Xiao et al., 2019). Notably, the endogenous peptide hormone RALF23 is perceived by a LLG1-FER heterocomplex, which leads to inhibition of flg22-induced FLS2-BAK1 complex formation (Stegmann et al., 2017; Xiao et al., 2019). As such, although FER and LLG1 are positive regulator of PTI, RALF23 is a negative regulator. How these components regulate FLS2-BAK1 complex formation remains however unclear.
Several members of the CrLKL1L family are involved in RALFs perception (Haruta et al., 2014; Ge et al., 2017; Gonneau et al., 2018; Liu, 2021). Among them, FER plays a pivotal role in the perception of several Arabidopsis RALF peptides (Haruta et al., 2014; Stegmann et al., 2017; Gonneau et al., 2018; Zhao et al., 2018; Abarca et al., 2021; Liu, 2021). In addition, cell wall-associated LEUCINE-RICH REPEAT-EXTENSINs (LRXs) proteins are also involved in CrRLK1L-regulated pathways and were shown to bind RALFs with high affinity (Mecchia, 2017; Zhao et al., 2018; Dünser, 2019; Herger et al., 2020; Moussu, 2020). Structural and biochemical analyses indicate that RALF binding by CrRLK1L/LLG complexes and LRXs are mutually exclusive and mechanistically distinct from each other (Xiao et al., 2019; Moussu, 2020). While CrRLK1Ls and LRXs have emerged as important RALF-regulated signaling modules, it is still unknown whether LRXs are also involved in RALF23-mediated regulation of immune signaling.
Plasma membrane lipids and proteins dynamically organize into diverse membrane domains giving rise to fluid molecular patchworks (Gronnier et al., 2018; Ballweg et al., 2020; Jaillais and Ott, 2020). These domains are proposed to provide dedicated biochemical and biophysical environments to ensure acute, specific, and robust signaling events (Gronnier et al., 2019; Jacobson et al., 2019). For instance, FLS2 localizes in discrete and static structures proposed to specify immune signaling (Bücherl et al., 2017). The cell wall is thought to impose physical constraints on the plasma membrane, limiting the diffusion of its constituents (Feraru, 2011; Martinière, 2012). Indeed, alteration of cell wall integrity leads to aberrant protein motions at the plasma membrane (Martinière, 2012; McKenna, 2019). Notably, perturbation of the cell wall affects FLS2 nanoscale organization (McKenna, 2019). Despite its utmost importance, it remains largely unknown how the cell wall and its integrity modulate the organization of the plasma membrane. Interestingly, both CrRLK1Ls and LRXs are proposed cell wall integrity sensors and conserved modules regulating growth, reproduction, and immunity (Franck et al., 2018; Herger et al., 2019). However, their mode of action and potential links between cell wall integrity sensing and RALF perception are still poorly understood.
Here, we show that FER regulates the plasma membrane nanoscale organization of FLS2 and BAK1. Similarly, we show that LRXs contribute to RALF23 responsiveness and regulate BAK1 nanoscale organization and immune signaling. Importantly, our work reveals an unexpected uncoupling of FER and LRX modes of action in growth and immunity. We demonstrate that RALF23 perception leads to rapid modulation of FLS2 and BAK1 nanoscale organization and that its inhibitory activity on immune signaling requires FER kinase activity. We propose that the regulation of the plasma membrane nanoscale organization by RALF23 receptors underscores their role in the formation of protein complexes and initiation of immune signaling.
Results and discussion
FER regulates membrane nanoscale organization of FLS2 and BAK1
We combined variable angle total internal reflection fluorescence microscopy (VA-TIRFM) and single-particle tracking to analyze the lateral mobility of FLS2-GFP in transgenic Arabidopsis lines. Two lines expressing FLS2-GFP under the control of its native promoter were crossed with FER knock-out alleles fer-2 and fer-4. In line with previous reports (Bücherl et al., 2017; Tran et al., 2020), we observed that FLS2-GFP localized to laterally stable foci in wild-type (WT) (Figure 1—video 1). Consistently, FLS2-GFP single-particle trajectories exhibited a confined mobility behavior (Figure 1—figure supplement 1, Figure 1—video 1). Comparative analysis of the diffusion coefficient (D), which describes the diffusion properties of detected single particles (Kusumi et al., 1993), showed that FLS2-GFP was more mobile in fer mutants than in WT (Figure 1—figure supplement 1, Figure 1—figure supplement 2, and Figure 1—video 1). To analyze FLS2-GFP organization, we reconstructed images using a temporal averaging of FLS2-GFP fluorescence observed across VA-TIRFM time series. Furthermore, individual image sections were subjected to kymograph analysis. Using this approach, we found that FLS2-GFP fluorescence was maintained into well-defined and static structures in WT, while it appeared more disperse and more mobile in both fer mutants (Figure 1A and B, Figure 1—figure supplement 2). To substantiate these observations, we used the previously established spatial clustering index (SCI), which describes protein lateral organization (Gronnier et al., 2017; Tran et al., 2020). As expected, SCI of FLS2-GFP was lower in fer-4 than in WT (Figure 1C), indicating disturbance in FLS2-GFP lateral organization.
Figure 1. FER regulates the nanoscale organization of FLS2-GFP and BAK1-mCherry.
(A, E) FLS2-GFP and BAK1-mCherry nanodomain organization. Pictures are maximum projection of 20 variable angle total internal reflection fluorescence microscopy (VA-TIRFM) images obtained at 5 frames per second for FLS2-GFP (A) and 10 VA-TIRFM images obtained at 2.5 frames per second for BAK1-mCherry (E) in Col-0 and fer-4 cotyledon epidermal cells. (B, F) Representative kymograph showing lateral organization of FLS2-GFP (B) and BAK1-mCherry (F) overtime in Col-0 and fer-4. (C, G) Quantification of FLS2-GFP (C) and BAK1-mCherry (G) spatial clustering index. Graphs are notched box plots, scattered data points show measurements, colors indicate independent experiments, n = 16 cells for Col-0/pFLS2::FLS2-GFP; n = 31 cells for fer-4/pFLS2::FLS2-GFP, n = 23 cells for Col-0/pBAK1::BAK1-mCherry, n = 18 cells for fer-4/pBAK1::BAK1-mCherry. p-Values report two-tailed nonparametric Mann–Whitney test. (D, H) Graphical illustrations summarizing our observations for FLS2-GFP (D) and BAK1-mCherry (H) nanoscale dynamics.

Figure 1—figure supplement 1. Analysis of FLS2-GFP single-particle dynamics in fer-4.

Figure 1—figure supplement 2. Analysis of FLS2-GFP organization and dynamics in fer-2.

Figure 1—figure supplement 3. FLS2-GFP accumulation at the PM is altered in fer mutants.

Figure 1—video 1. Variable angle total internal reflection fluorescence microscopy (VA-TIRFM) imaging of FLS2-GFP in Col-0 and fer-4.
Figure 1—video 2. Variable angle total internal reflection fluorescence microscopy (VA-TIRFM) imaging of BAK1-mCherry in Col-0 and fer-4 with or without RALF23 treatment.
In Medicago truncatula and yeast, alteration of nanodomain localization has been linked to impaired protein accumulation at the plasma membrane due to increased protein endocytosis (Grossmann et al., 2008; Liang et al., 2018). To inquire for a potential defect in FLS2 plasma membrane accumulation, we observed subcellular localization of FLS2-GFP using confocal microscopy. The analysis revealed a decrease in FLS2-GFP accumulation in fer mutants (Figure 1—figure supplement 3). Whether the proposed role of FER in regulating endocytosis (Yu et al., 2020) accounts for this defect is unknown. Altogether, these results show that FER is genetically required to control FLS2-GFP nanoscale organization and accumulation at the plasma membrane.
To further characterize the impact of FER loss of function in RK organization, we analyzed the behavior of BAK1-mCherry at the plasma membrane. Fluorescence recovery after photobleaching experiments previously suggested that the vast majority of BAK1 molecules are mobile (Hutten et al., 2017). Consistent with this result, BAK1-mCherry was more mobile than FLS2-GFP in the WT (Figure 1—video 2). Given that BAK1 is a common co-receptor for multiple LRR-RK signaling pathways (Hohmann et al., 2017), we hypothesized that BAK1 might dynamically associate with various pre-formed signaling platforms, such as FLS2 nanodomains (Figure 1, Bücherl et al., 2017). Under our experimental conditions, we were not able to perform high-quality single-particle tracking analysis for BAK1-mCherry (Figure 1—video 2, see Materials and methods section). However, visual inspection of particles behavior suggested that BAK1-mCherry was less mobile in fer-4 than in WT (Figure 1—video 2). Accordingly, reconstructed VA-TIRFM images and kymographs showed that BAK1-mCherry fluorescence was more structured and static in fer-4 than in WT (Figure 1F). Furthermore, we observed an increase of BAK1-mCherry SCI in fer-4 (Figure 1G). Confocal microscopy analysis did not reveal significant differences in BAK1-mCherry plasma membrane accumulation between fer-4 and WT (Figure 2—figure supplement 1). Altogether, these data show that loss of FER perturbs FLS2 and BAK1 nanoscale organization, albeit in an opposite manner (Figure 1D and H). Previous reports have similarly shown that altering the composition of the cell wall can lead to opposed effects on the mobility of different proteins. For instance, inhibition of cellulose synthesis increases the mobility of HYPERSENSITIVE-INDUCED REACTION 1 (Daněk et al., 2020) but limits the mobility of LOW-TEMPERATURE-INDUCED PROTEIN 6B (Martinière, 2012; Daněk et al., 2020). Modification of pectin methyl esterification status of the cell wall increases the mobility of FLS2 (McKenna, 2019) but decreases the mobility of FLOTILIN 2 (Daněk et al., 2020). Collectively, these observations suggest that various membrane environments are differentially regulated by the cell wall and the proposed cell wall integrity sensor FER.
LRX3, LRX4, and LRX5 regulate BAK1 nanoscale organization and PTI signaling
LRXs are dimeric, cell wall-localized, high-affinity RALF-binding proteins suggested to monitor cell wall integrity in growth and reproduction (Baumberger et al., 2001; Mecchia, 2017; Dünser, 2019; Herger et al., 2019; Herger et al., 2020; Moussu, 2020). Their extensin domain confers cell wall anchoring, and their LRR domain mediates RALF binding (Herger et al., 2019; Moussu, 2020). Among the Arabidopsis 11-member LRX family, LRX3, LRX4, and LRX5 are the most expressed in vegetative tissues, and the lrx3 lrx4 lrx5 triple mutant (hereafter lrx3/4/5) shows stunted growth and salt hypersensitivity phenotypes reminiscent of fer-4 (Zhao et al., 2018; Dünser, 2019). Therefore, we hypothesized that LRXs also regulate immune signaling. Indeed, co-immunoprecipitation experiments showed that lrx3/4/5 was defective in flg22-induced FLS2-BAK1 complex formation (Figure 2A). Consistently, flg22-induced ROS production was reduced in lrx3/4/5 similar to the levels observed in fer-4 (Figure 2B). In addition, lrx3/4/5 was impaired in elf18-induced ROS production (Figure 2C), suggesting that, as for FLS2-BAK1 complex formation, LRX3/4/5 are required for complex formation between EFR and BAK1. Thus, we conclude that LRX3/4/5 are positive regulators of PTI signaling.
Figure 2. LRX3, LRX4, and LRX5 regulate pattern-triggered immunity (PTI) and BAK1-mCherry organization.
(A) flg22-induced FLS2-BAK1 complex formation. Immunoprecipitation of FLS2 in Arabidopsis Col-0 and lr3/4/5 seedlings either untreated or treated with 100 nM flg22 for 10 min. Blot stained with Coomassie brilliant blue (CBB) is presented to show equal loading. Western blots were probed with α-FLS2, α-BAK1, or α-FER antibodies. Numbers indicate quantification of BAK1 bands normalized based on the corresponding intensities of FLS2 bands and relative to the control Col-0. Similar results were obtained in at least three independent experiments. (B, C) Reactive oxygen species (ROS) production after elicitation with 100 nM elf18 (B) or 100 nM flg22 (C). Values are means of total photon counts over 40 min. Red crosses and red horizontal lines denote mean and SEM, n = 32. Conditions that do not share a letter are significantly different in Dunn’s multiple comparison test (p<0.0001). (D) BAK1-mCherry nanodomain organization. Pictures are maximum projection images (10 variable angle total internal reflection fluorescence microscopy [VA-TIRFM] images obtained at 2.5 frames per second) of BAK1-mCherry in Col-0, fer-4, and lrx3/4/5 cotyledon epidermal cells. (E) Representative kymograph showing lateral organization of BAK1-mCherry overtime in Col-0, fer-4, and lrx3/4/5. (F) Quantification of BAK1-mCherry spatial clustering index. Graphs are notched box plots, scattered data points show measurements, colors indicate independent experiments, n = 26 cells for Col-0/pBAK1::BAK1-mCherry, n = 31 cells for fer-4/pBAK1::BAK1-mCherry, n = 28 cells for lrx3/4/5/pBAK1::BAK1-mCherry. Conditions that do not share a letter are significantly different in Dunn’s multiple comparison test (p<0.0001). (G) Graphical illustration summarizing our observations for BAK1-mCherry nanoscale dynamics in lrx3/4/5.

Figure 2—figure supplement 1. Subcellular localization of BAK1-mCherry in fer-4 and lrx3/4/5.
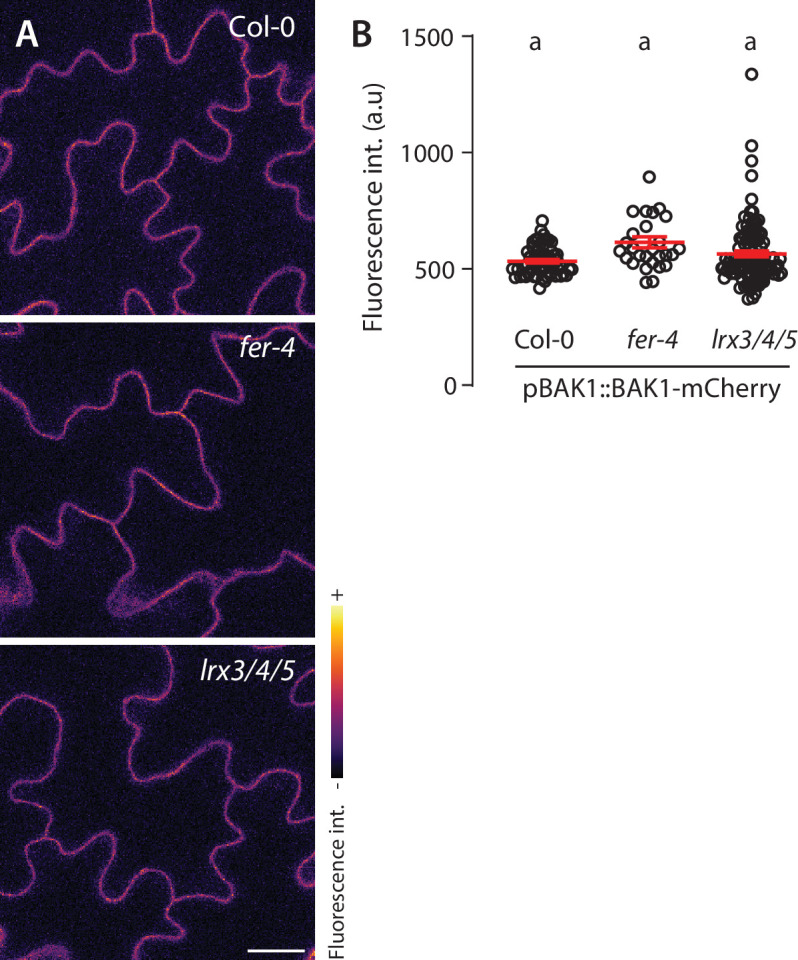
Figure 2—figure supplement 2. LRX3, LRX4, and LRX5 are dispensable for FER plasma membrane localization and accumulation.
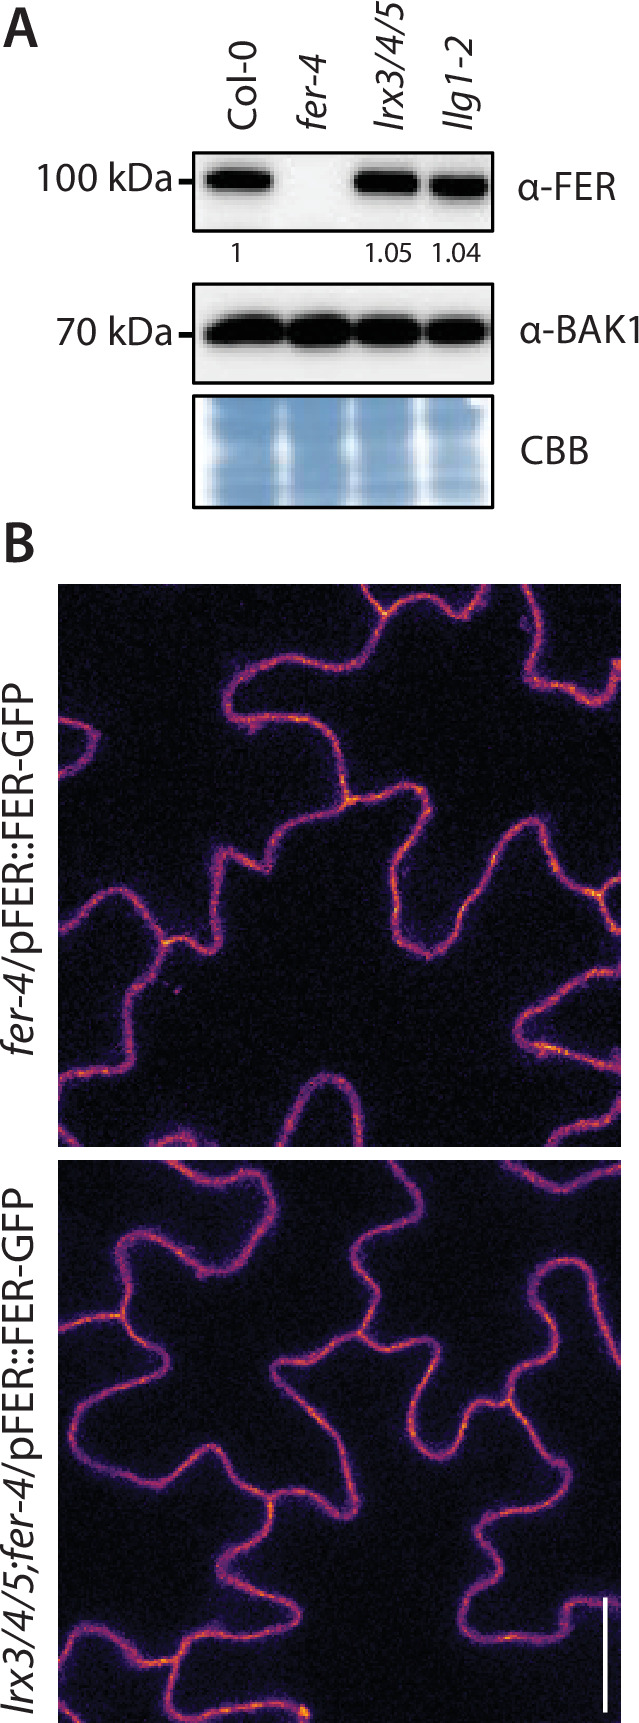
Figure 2—figure supplement 3. LRX3, LRX4, and LRX5 are dispensable for FER-GFP nanoscale organization.

Figure 2—figure supplement 4. LRX3, LRX4, and LRX5 contribute to RALF23 responsiveness.

Figure 2—figure supplement 5. RALF23 does not modulate constitutive association between FER and LRX4.
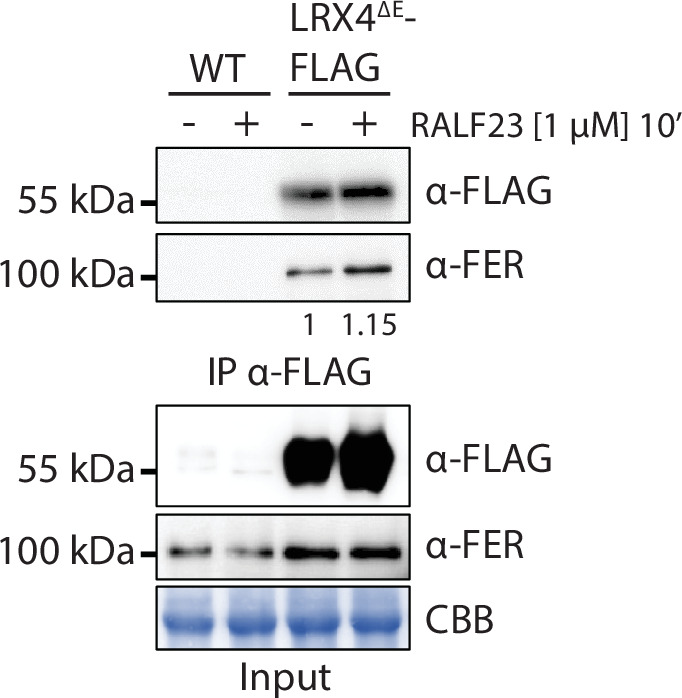
Figure 2—video 1. Variable angle total internal reflection fluorescence microscopy (VA-TIRFM) imaging of BAK1-mCherry in Col-0 and lrx3/4/5.
Figure 2—video 2. Variable angle total internal reflection fluorescence microscopy (VA-TIRFM) imaging of FER-GFP in fer-4 and fer-4;lrx3/4/5.
We then asked whether, similar to FER, LRX3/4/5 regulate plasma membrane nanoscale organization. We crossed lines expressing FLS2-GFP and BAK1-mCherry under the control of their respective native promoter with the lrx3/4/5 mutant. However, despite several attempts, we could not retrieve homozygous lrx3/4/5 lines expressing FLS2-GFP. Nonetheless, VA-TIRFM and confocal imaging showed that, like in fer-4, BAK1-mCherry was more organized and more static in lrx3/4/5 (Figure 2D and E, Figure 2—video 1), and that BAK1-mCherry plasma membrane localization was not affected by the loss of LRX3/4/5 (Figure 2—figure supplement 1). Thus, like in fer mutants, perturbation in PTI signaling observed in lrx3/4/5 correlates with alterations of plasma membrane RK organization.
LRX3, LRX4, and LRX5 have been proposed to sequester RALF peptides to prevent internalization of FER and inhibition of its function (Zhao et al., 2018). Following this logic, defects in PTI observed in lrx3/4/5 could be explained by a depletion of FER at the plasma membrane. However, our confocal microscopy analysis and western blotting with anti-FER antibodies indicated that FER accumulation and plasma membrane localization were not affected in lrx3/4/5 (Figure 2—figure supplement 2). Furthermore, VA-TIRFM revealed that FER-GFP transiently accumulated in dynamic foci, independently of LRX3/4/5 (Figure 2—figure supplement 3, Figure 2—video 2). Together, these results suggest that LRX3/4/5 do not prevent RALF association with FER to modulate PTI. Moreover, our results suggest that active monitoring by the proposed cell wall integrity sensors FER and LRXs regulates plasma membrane nanoscale dynamics of RKs.
The ability of LRX3/4/5 to associate with RALF23 in planta (Zhao et al., 2018) prompted us to test whether LRX3/4/5 are required for RALF23 responsiveness. Indeed, LRX3, LRX4, and LRX5 were required for RALF23-induced inhibition of elf18-triggered ROS production (Figure 2—figure supplement 4A). Similarly, we observed a decrease in RALF23-induced seedlings growth inhibition in lrx3/4/5 compared to WT (Figure 2—figure supplement 4B). Altogether, these data show that LRX3/4/5 contribute to RALF23 responsiveness (Figure 2—figure supplement 4C), and that LRXs and FER have analogous functions in regulating PTI.
We next asked whether FER and LRX3/4/5 form a complex. For this, we made use of a truncated version of LRX4 lacking its extensin domain (LRX4ΔE), previously used to assess protein complex formation (Dünser, 2019; Herger et al., 2020). Consistent with previous reports based on transient expression in Nicotiana benthamiana (Dünser, 2019; Herger et al., 2020), co-immunoprecipitation experiments with stable transgenic Arabidopsis showed that FER was constitutively associated with LRX4ΔE-FLAG, and that RALF23 treatment did not modulate this interaction (Figure 2—figure supplement 5). This suggests that direct monitoring of the cell wall mediated by a possible FER-LRX complex (Dünser, 2019; Herger et al., 2019) is not regulated by RALF23. In agreement with structural and biochemical analyses of RALF-binding by CrRLK1Ls/LLGs and LRXs (Moussu, 2020), FER-LLG1 and LRX3/4/5 may form distinct RALF23 receptor complexes. Similar to their roles in pollen tube and root hair growth and integrity (Ge et al., 2017; Mecchia, 2017; Moussu, 2020; Dünser, 2019; Herger et al., 2020), future investigations are thus needed to understand the exact molecular link between RALF-binding LRXs and CrRLK1s.
Functional dichotomy of FER and LRXs in regulating growth and immunity
In line with previous reports, our data show that FER and LRXs can form a complex (Dünser, 2019; Herger et al., 2019, Figure 2—figure supplement 5). Moreover, they are known to associate with the cell wall (Baumberger et al., 2001; Feng, 2018) and are proposed to cooperatively relay its properties (Dünser, 2019; Herger et al., 2019). We thus asked if direct cell wall sensing underlies FER and LRXs function in PTI. In the context of growth and cell expansion, plants overexpressing LRX4ΔE are phenotypically reminiscent of lrx3/4/5 and fer-4 mutants (Dünser, 2019). This dominant negative effect is proposed to be caused by competition of the overexpressed truncated LRX4ΔE with endogenous LRXs and consequent loss of cell wall anchoring (Dünser, 2019). Similarly, overexpression of LRX1ΔE inhibits root hair elongation, phenocopying LRX1/LRX2 loss of function (Herger et al., 2020). By contrast, we observed that LRX4ΔE overexpression did not affect flg22-induced interaction between FLS2 and BAK1 (Figure 3—figure supplement 1A). In good agreement with this notion, overexpression of LRX4ΔE did not affect flg22- nor elf18-induced ROS production (Figure 3—figure supplement 1B and C). To corroborate these results, we tested inhibition of root growth triggered by flg22 treatment. Consistent with the positive role of FER and LRX3/4/5 in PTI, we observed that fer-4 and lrx3/4/5 were hyposensitive to flg22 treatment (Figure 3—figure supplement 1D). By contrast, overexpression of LRX4ΔE did not affect inhibition of root growth by flg22 (Figure 3—figure supplement 1D). In addition, we observed that LRX4ΔE overexpression did not impact RALF23 responsiveness (Figure 3—figure supplement 1E). Altogether, these data suggest that the function of LRX3/4/5 in PTI is distinct from their role during growth.
The ectodomain of FER contains two malectin-like domains, malA and malB (Figure 3A), which share homology with malectin, a carbohydrate-binding protein from Xenopus laevis (Boisson-Dernier et al., 2011). Despite lacking the canonical carbohydrate-binding site of malectin (Moussu, 2018; Xiao et al., 2019), malA and malB were proposed to bind pectin (Feng, 2018; Lin et al., 2021), and FER-mediated cell wall sensing regulates pavement cell and root hair morphogenesis (Duan, 2010; Lin et al., 2021). To investigate if direct cell wall sensing underlies FER’s function in regulating PTI, we used transgenic lines expressing a FER truncated mutant, lacking the malA domain, C-terminally fused to YFP (FER∆malA-YFP) in the fer-4 mutant background (Figure 3B). We observed that FER∆malA-YFP did not complement the cell shape and root hair elongation defects of fer-4 (Figure 3C and D), emphasizing the importance of malA in FER-regulated cell morphogenesis. In contrast, immunoprecipitation assays showed that FER∆malA-YFP fully complemented flg22-induced complex formation between endogenous FLS2 and BAK1 (Figure 3E) as well as ROS production in response to flg22 and elf18 (Figure 3F and G). Altogether, these data suggest that malA-mediated cell wall sensing underlies specific function(s) of FER in regulating growth and cell morphology, but is dispensable for FER’s role in PTI. Interestingly, we observed that expression of FER∆malA-YFP restored inhibition of growth triggered by RALF23, suggesting that malB is sufficient for RALF responsiveness (Figure 3H), as suggested by its physical interaction with RALF23 (Xiao et al., 2019). While we cannot formally exclude the implication of pectin-binding by malB in regulating immunity, the contrasted context-dependent functionality of FER∆malA-YFP suggests that FER’s function in PTI is primarily mediated by RALF perception. Altogether, our data indicate molecular and functional dichotomy of FER and LRXs in regulating growth and immunity.
Figure 3. FER malectin A domain regulates cell morphogenesis not pattern-triggered immunity (PTI).
(A) Graphical representation of RALF23 perception by FER-LLG1 complex. (B) Morphology of 4-week-old Arabidopsis plants; scale bar indicates 5 cm. (C, D) Confocal microscopy pictures of 5-day-old seedlings cotyledon (C) and root (D) epidermal cells stained with propidium iodide. 3–4 seedlings per genotypes were observed per experiment. For each seedling, we observed the center of both cotyledons, and at the initiation site of root hairs. Similar results were obtained in at least three independent experiments. (E) Flg22-induced FLS2-BAK1 complex formation. Immunoprecipitation of FLS2 in Arabidopsis Col-0, fer-4, and fer-4/p35S::FER∆MalA-YFP seedlings that were either untreated or treated with 100 nM flg22 for 10 min. Blot stained with Coomassie brilliant blue (CBB) is presented to show equal loading. Western blots were probed with α-FLS2, α-BAK1, or α-FER antibodies. Numbers indicate quantification of BAK1 bands normalized based on the corresponding intensities of FLS2 bands and relative to the control Col-0 + flg22. Similar results were obtained in at least three independent experiments. (F, G) Reactive oxygen species (ROS) production after elicitation with 100 nM flg22 (F) or 100 nM elf18 (G). Values are means of total photon counts over 40 min, n = 8. Red crosses and red horizontal lines denote mean and SEM, respectively. Conditions that do not share a letter are significantly different in Dunn’s multiple comparison test (p<0.0001). (H) Fresh weight of 12-day-old seedlings grown in the absence (mock) or presence of 1 µM of RALF23 peptide. Fresh weight is expressed as relative to the control mock treatment for each genotype. Similar results were obtained in at least three independent experiments. Conditions that do not share a letter are significantly different in Dunn’s multiple comparison test (p<0.001).

Figure 3—figure supplement 1. Overexpression of LRX4ΔE does not affect pattern-triggered immunity (PTI).

RALF23 alters FLS2 and BAK1 organization and function through active FER signaling
We next asked whether RALF23 activity is mediated by active FER signaling. We used a kinase-dead mutant (FERK565R) C-terminally fused to GFP, expressed in fer knock-out backgrounds (Chakravorty et al., 2018), and selected lines showing comparable accumulation to endogenous FER in WT (Figure 4—figure supplements 1 and 2). Interestingly, we observed that FERK565R-GFP complemented fer’s defect in FLS2-BAK1 complex formation (Figure 4—figure supplement 1A) and PAMP-induced ROS production (Figure 4—figure supplement 1B and C). In contrast, we observed that inhibition of FLS2-BAK1 complex formation by RALF23 depended on FER kinase activity (Figure 4—figure supplement 2B). Similarly, inhibition of elf18-induced ROS production and seedling growth inhibition by RALF23 depended on FER kinase activity (Figure 4—figure supplement 2C). Overall, these data show that inhibition by RALF23 is mediated by active FER signaling while FER’s positive role in immune signaling is kinase activity-independent.
We next asked whether inhibition of FLS2-BAK1 complex formation by RALF23 correlates with a modulation of FLS2 or BAK1 nanoscale organization. VA-TIRFM imaging showed an increase of FLS2-GFP mobility and an alteration of FLS2-GFP nanodomain organization within minutes of RALF23 treatment (Figure 4—figure supplements 3 and 4, Figure 4—videos 1–3, imaging performed 2–30 min post treatment; Figure 4—figure supplement 5). In addition, we observed that RALF23 treatment stabilized BAK1-mCherry nanoscale organization (Figure 4, Figure 4—figure supplement 6, Figure 1—video 2). These data suggest that RALF23 perception leads to rapid modification of FLS2 and BAK1 membrane organization and thereby potentially inhibits their association. In addition, these data, based on short-term RALF23 treatment, demonstrate that the aforementioned defects in FLS2 and BAK1 organization observed in fer and lrx3/4/5 mutant plants are not caused by their pleiotropic growth defects.
Figure 4. RALF23 perception regulates BAK1-mCherry organization.
(A) BAK1-mCherry nanodomain organization (pBAK1::BAK1-mCherry). Pictures are maximum projection images (10 variable angle total internal reflection fluorescence microscopy [VA-TIRFM] images obtained at 2.5 frames per second) of BAK1-mCherry in Col-0 and fer-4 cotyledon epidermal cells with or without 1 µM RALF23 treatment (2–30 min). (B) Representative kymograph showing lateral organization of BAK1-mCherry overtime in Col-0 and fer-4 with or without 1 µM RALF23 treatment. (C) Quantification of BAK1-mCherry spatial clustering index. Graphs are notched box plots, scattered data points show measurements, colors indicate independent experiments, n = 21 and n = 23 cells for Col-0/pBAK1::BAK1-mCherry with and without RALF23, respectively, n = 20 and n = 21 cells for fer-4/pBAK1::BAK1-mCherry with and without RALF23, respectively. Conditions that do not share a letter are significantly different in Dunn’s multiple comparison test (p<0.0001). (D) Graphical illustration summarizing our observations for BAK1-mCherry nanoscale dynamics upon RALF23 treatment.

Figure 4—figure supplement 1. FER kinase activity is dispensable to support pattern-triggered immunity (PTI) signaling.

Figure 4—figure supplement 2. Inhibition of pattern-triggered immunity (PTI) signaling by RALF23 requires FER kinase activity.

Figure 4—figure supplement 3. Analysis of FLS2-GFP single-particle dynamics upon RALF23 treatment.

Figure 4—figure supplement 4. Analysis of FLS2-GFP organization upon RALF23 treatment.

Figure 4—figure supplement 5. Time-resolved analysis of the spatial clustering index.
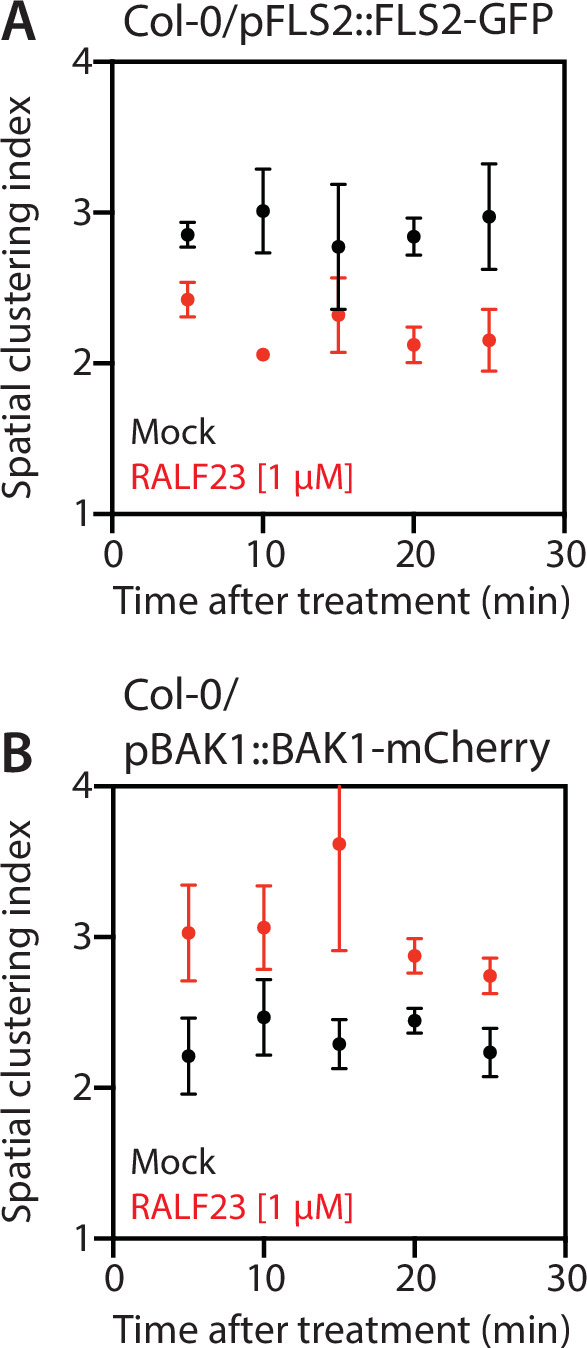
Figure 4—figure supplement 6. Working model for the regulation of FLS2 and BAK1 nanoscale organization by RALFs receptor complexes.

Figure 4—figure supplement 7. Linear regression analysis of the relationship between the spatial clustering index and fluorescence intensity.
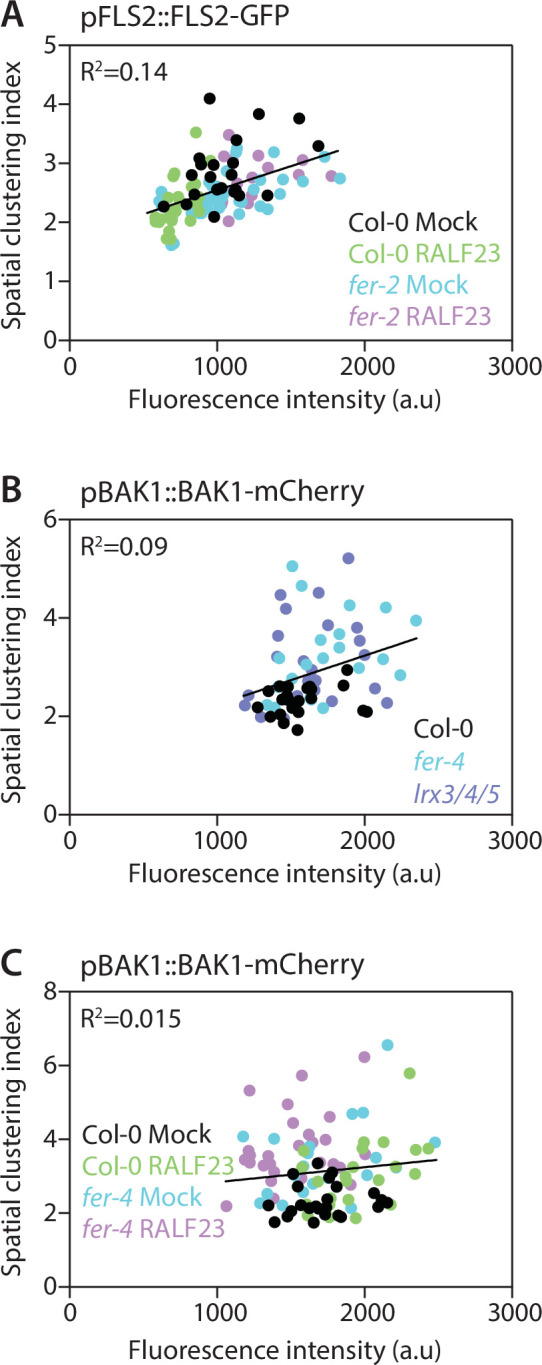
Figure 4—figure supplement 8. Replicates of co-immunoprecipitation experiments.

Figure 4—video 1. Variable angle total internal reflection fluorescence microscopy (VA-TIRFM) imaging of FLS2-GFP in Col-0 with or without RALF23 treatment.
Figure 4—video 2. Variable angle total internal reflection fluorescence microscopy (VA-TIRFM) imaging of FLS2-GFP in fer-4 with or without RALF23 treatment.
Figure 4—video 3. Variable angle total internal reflection fluorescence microscopy (VA-TIRFM) imaging of FLS2-GFP in Col-0 and fer-2 with or without RALF23 treatment.
Our study unravels the regulation of FLS2 and BAK1 nanoscale organization by the RALF receptors FER and LRX3/4/5 (Figure 4—figure supplement 6). The function of RALF receptors in other processes might similarly rely on the regulation of RK nanoscale dynamics, and the identification of the corresponding regulated RKs is an exciting prospect for future investigation. Further work will be required to decipher how FLS2 and BAK1 associate in a ligand-dependent manner within the plasma membrane and to understand how FER and LRXs control this process. While FER associate with LLG1 to perceive RALF peptides, whether perception of these peptides by LRXs involves additional unknown components remains open. For both FER-LLG1 and LRXs, it will be important in the future to identify the components mediating RALF23 signaling and modification of FLS2 and BAK1 nanoscale dynamics. Because FER-LLG1 and LRX3/4/5 – components of distinct RALFs receptor complexes – are genetically required to control FLS2 and BAK1 nanoscale dynamics, we hypothesize that perception of additional RALF peptides may be involved in regulating this process (Figure 4—figure supplement 6). Plants have evolved coordinated RK protein-protein interaction networks to process extracellular signals into specific responses (Smakowska-Luzan et al., 2018), and thus may have co-evolved mechanisms to regulate these interactions in both space and time. Our results suggest that perception of endogenous peptides by distinct receptor complexes actively modulates the plasma membrane nanoscale organization to regulate cell surface signaling by other RKs.
Materials and methods
Key resources table.
| Reagent type (species) or resource | Designation | Source or reference | Identifiers | Additional information |
|---|---|---|---|---|
| Genetic reagent (Arabidopsis thaliana) | Col-0/pFLS2::FLS2-GFP#1 | Göhre et al., 2008 | See Materials and methods | |
| Genetic reagent (A. thaliana) | Col-0/pFLS2::FLS2-GFP#2 | This paper | See Materials and methods | |
| Genetic reagent (A. thaliana) | fer-2/pFLS2::FLS2-GFP#1 | Stegmann et al., 2017 | See Materials and methods | |
| Genetic reagent (A. thaliana) | fer-4/pFLS2::FLS2-GFP#2 | This paper | See Materials and methods | |
| Genetic reagent (A. thaliana) | fer-4 | Duan, 2010 | See Materials and methods | |
| Genetic reagent (A. thaliana) | fer-4/pFER::FER-GFP | Duan, 2010 | See Materials and methods | |
| Genetic reagent (A. thaliana) | fer-4/pFER::FERKD-GFP | Chakravorty et al., 2018 | See Materials and methods | |
| Genetic reagent (A. thaliana) | lrx3/4/5 | Dünser, 2019 | See Materials and methods | |
| Genetic reagent (A. thaliana) | p35S::LRX4ΔE-Citrine | Dünser, 2019 | See Materials and methods | |
| Genetic reagent (A. thaliana) | p35S::LRX4ΔE-FLAG | Dünser, 2019 | See Materials and methods | |
| Genetic reagent (A. thaliana) | Col-0/pBAK1::BAK1-mCherry | Bücherl et al., 2013 | See Materials and methods | |
| Genetic reagent (A. thaliana) | fer-4/ pBAK1::BAK1-mCherry | This paper | See Materials and methods | |
| Genetic reagent (A. thaliana) | lrx3/4/5/ pBAK1::BAK1-mCherry | This paper | See Materials and methods | |
| Genetic reagent (A. thaliana) | lrx3/4/5/ pFER::FER-GFP | This paper | See Materials and methods | |
| Antibody | anti-FLAG-HRP | Sigma-Aldrich | A8592 | WB (1:4000 dilution) |
| Antibody | Monoclonal rabbit anti-FLS2 | Chinchilla et al., 2007 | WB (1:1000 dilution) | |
| Antibody | Polyclonal rabbit anti-BAK1 | Roux, 2011 | WB (1:5000 dilution) | |
| Antibody | Polyclonal rabbit anti-BAK1 pS612 | Perraki, 2018 | WB (1:3000 dilution) | |
| Antibody | Polyclonal rabbit anti-FER | Xiao et al., 2019 | WB (1:2000 dilution) | |
| Antibody | Anti-rabbit IgG-HRP Trueblot | Rockland | 18-8816-31 | WB (1:10,000 dilution) |
| Peptide, recombinant protein | Flg22 | Synthesized by EZBiolab(purity >95%) | See Materials and methods | |
| Peptide, recombinant protein | Elf18 | Synthesized by EZBiolab(purity >95%) | See Materials and methods | |
| Peptide, recombinant protein | RALF23 | Synthesized by EZBiolab(purity >95%) | See Materials and methods | |
| Chemical compound, drug | GFP-Trap agarose beads | ChromoTek | See Materials and methods | |
| Chemical compound, drug | M2 anti-Flag affinity gel | Sigma-Aldrich | A2220-5ML | See Materials and methods |
| Chemical compound, drug | Anti-rabbit Trueblot agarose beads | eBioscience | SML1656 | See Materials and methods |
| Software, algorithm | Fiji | https://imagej.net/Fiji | See Materials and methods |
Plant materials and growth
A. thaliana ecotype Columbia (Col-0) was used as WT control. The fer-4, fer-4/pFER::FER-GFP (Duan, 2010), fer-4/pFER::FERKD-GFP (Chakravorty et al., 2018), fer-4/p35S::FER∆MalA-GFP (Lin, 2018), Col-0/pFLS2::FLS2-GFP#1 (Göhre et al., 2008), Col-0/pFLS2::FLS2-GFP#2 (this study), fer-2/pFLS2::FLS2-GFP (Stegmann et al., 2017), lrx3/4/5, p35S::LRX4ΔE-Citrine and p35S::LRX4ΔE-FLAG (Dünser, 2019) lines were previously published. Col-0/pFLS2::FLS2-GFP (Göhre et al., 2008) was crossed with fer-4 to obtain fer-4/pFLS2::FLS2-GFP. Col-0/pBAK1::BAK1-mCherry (Bücherl et al., 2013) was crossed with fer-4 and lrx3/4/5 to obtain fer-4/pBAK1::BAK1-mCherry and lrx3/4/5/pBAK1::BAK1-mCherry. fer-4/pFER::FER-GFP was crossed with lrx3/4/5 to obtain fer-4/lrx3/4/5;pFER::FER-GFP. For the VA-TIRFM imaging, we initially used a line expressing pFLS2::FLS2-GFP in fer-2 we previously generated (Stegmann et al., 2017). Despite that both alleles are well-characterized null allele of FER, for consistent and direct comparison of our biochemical, physiological, and imaging experiments, we also crossed another Col-0/pFLS2::FLS2-GFP with fer-4. To further facilitate the single-particle tracking analysis, we choose a Col-0/pFLS2::FLS2-GFP line expressing less FLS2-GFP. For ROS burst assays, plants were grown in individual pots at 20–21°C with a 10 hr photoperiod in environmentally controlled growth rooms. For seedling-based assays, seeds were surface-sterilized using chlorine gas for 5 hr and grown at 22°C and a 16 hr photoperiod on Murashige and Skoog (MS) medium supplemented with vitamins, 1% sucrose and 0.8% agar.
Synthetic peptides and chemicals
The flg22 (QRLSTGSRINSAKDDAAGLQIA), elf18 (SKEKFERTKPHVNVGTIG), and RALF23 (ATTKYISYGALRRNTVPCSRRGASYYNCRRGAQANPYSRGCSAITRCRR) peptides were synthesized by EZBiolab (USA) with a purity of >95%. All peptides were dissolved in sterile purified water.
ROS burst measurement
ROS burst measurements were performed as previously documented (Kadota et al., 2014). At least eight leaf discs (4 mm in diameter) per individual genotype were collected in 96-well plates containing sterile water and incubated overnight. The next day the water was replaced by a solution containing 17 μg/mL luminol (Sigma-Aldrich), 20 μg/mL horseradish peroxidase (HRP, Sigma-Aldrich), and the peptides in the appropriate concentration. Luminescence was measured for the indicated time period using a charge-coupled device camera (Photek Ltd., East Sussex, UK). The effect of RALF23 on elf18-triggered ROS production was performed as previously described (Stegmann et al., 2017). 8–10 leaf discs per treatment and/or genotype were collected in 96-well plates containing water and incubated overnight. The following day the water was replaced by 75 µL of 2 mM MES-KOH pH 5.8 to mimic the apoplastic pH. Leaf discs were incubated further for 4–5 hr before adding 75 μL of a solution containing 40 μg/mL HRP, 1 μM L-O12 (Wako Chemicals, Germany), and 2× elicitor RALF peptide solution (final concentration 20 μg/mL HRP, 0.5 µM L-O12, 1× elicitors). ROS production is displayed as the integration of total photon counts.
Root growth inhibition assay
Three-day-old Col-0, fer-4, lrx3/4/5, and 35S::LRR4-Cit seedlings (n = 9–12) were transferred for additional 3 days to 3 mL liquid ½ MS medium containing different concentrations (100 nM, 300 nM, or 1 µM) of flg22 or the appropriate amount of solvent. The seedlings were then placed on solid MS plates before scanning. Root length was measured using ImageJ.
Live-cell imaging
For confocal microscopy and VA-TIRF microscopy experiments, surface-sterilized seeds were individually placed in line on square Petri dishes containing 1/2 MS 1% sucrose, 0.8% phytoagar, stratified 2 days in the dark at 4°C, then placed in a growth chamber at 22°C and a 16 hr photoperiod for 5 days. Seedlings were mounted between a glass slide and a coverslip in liquid 1/2 MS, 1% sucrose medium. For VA-TIRF microscopy experiments, 2–4 seedlings were sequentially imaged for each genotype and/or condition. To test the effect of RALF23 on FLS2-GFP dynamics and nanodomain organization, seedlings were preincubated in 2 mM MES-KOH pH 5.8 for 3–4 hr prior treatment. Seedlings were imaged 2–30 min after treatment.
Confocal laser scanning microscopy (CLSM)
Confocal microscopy was performed using a Leica SP5 CLSM system (Leica, Wetzlar, Germany) equipped with Argon, DPSS, He-Ne lasers, hybrid detectors, and using a 63 × 1.2 NA oil immersion objective. GFP was excited using 488 nm argon laser, and emission wavelengths were collected between 495 and 550 nm. mCherry was excited using 561 nm He/Ne laser, and emission wavelengths were collected between 570 and 640 nm. Propidium iodide was imaged using 488 nm and 500–550 nm excitation and emission wavelengths, respectively. In order to obtain quantitative data, experiments were performed using strictly identical confocal acquisition parameters (e.g., laser power, gain, zoom factor, resolution, and emission wavelengths reception), with detector settings optimized for low background and no pixel saturation. Pseudo-color images were obtained using look-up-table (LUT) of Fiji software (Schindelin et al., 2012).
Total internal reflection fluorescence (TIRF) microscopy
TIRF microscopy was performed using an inverted Leica GSD equipped with a ×160 objective (NA = 1.43, oil immersion), and an Andor iXon Ultra 897 EMCCD camera. Images were acquired by illuminating samples with a 488 nm solid-state diode laser set at 15 mW using a cube filter with an excitation filter 488/10 and an emission filter 535/50 for FLS2-GFP and FER-GFP. Optimum critical angle was determined as giving the best signal-to-noise for our sample and was kept fixed for each experiment. Images time series were recorded at 20 frames per second (50 ms exposure time) for Figure 1—figure supplement 2 and Figure 4—figure supplements 3 and 4; 5 frames per second for Figure 1A–C and Figure 2—figure supplement 3. To observe BAK1-mCherry, we could only use a 532 nm solid-state diode laser (ca. 40% of maximum excitation for mCherry) using a cube filter with an excitation filter 532/10 and an emission filter 600/100. To obtain a sufficient signal-to-noise ratio, image time series were recorded at 2.5 frames per second (Figures 1, 2 and 4). Due to apparent high mobility of BAK1 and relatively slow acquisition rate, we could not asses with confidence the identity of fluorescent particles from one time frame to another and therefore did not perform particle tracking analysis of BAK1-mCherry. VA-TIRFM images were subjected to background subtraction (30 rolling pixel radius) and smoothing. Kymographs were generated using Orthogonal views in Fiji (Schindelin et al., 2012).
Single-particle tracking analysis
To analyze single-particle tracking experiments, we used the plugin TrackMate 2.7.4 (Tinevez et al., 2017) in Fiji (Schindelin et al., 2012). Single particles were segmented frame-by-frame by applying a Laplacian of Gaussian (LoG) filter and estimated particle size of 0.4 μm. Individual single particles were localized with sub-pixel resolution using a built-in quadratic fitting scheme. Then, single-particle trajectories were reconstructed using a simple linear assignment problem (Jaqaman et al., 2008) with a maximal linking distance of 0.4 μm and without gap closing. Thresholds were empirically determined for optimal single-particle detection and linking. Only tracks with at least 10 successive points (tracked for 500 ms) were selected for further analysis. Diffusion coefficients of individual particles were determined using TraJClassifier (Wagner et al., 2017). For each particle, the slope of the first four time points of their mean square displacement (MSD) plot was used to calculate their diffusion coefficient according to the following equation: MSD = (x – x0)2 + (y – y0)2 and D = MSD/4t, where x0 and y0 are the initial coordinates, and x and y are the coordinates at any given time, and t is the time frame.
Quantification of SCI
Genotype and/or treatment-dependent variation in fluorescence intensity of FLS2-GFP and fluorescence pattern of FLS2-GFP and BAK1-mCherry compromised the use of a unique set of parameters to compute nanodomain size and density across the different experiments. To uniformly quantify differences in membrane organization of both FLS2 and BAK1 across all experiments, we used the SCI that was shown to be largely insensitive to variation in fluorescence intensity (Gronnier et al., 2017). Quantifications were performed as previously described (Gronnier et al., 2017). Briefly, fluorescence intensity was plotted along an 8-µm-long line on maximum projection of VA-TIRFM images. Three plots were randomly recorded per cell and at least eight cells per condition per experiment were analyzed. For each line plot, the SCI was calculated by dividing the mean of the 5% highest values by the mean of 5% lowest values. Because the absence of correlation between fluorescence intensity and SCI was assessed on confocal microscopy images and for a single protein (Gronnier et al., 2017), we tested whether this was also the case in our experimental conditions. Indeed, we consistently observed poor to no correlation between variation in fluorescence intensity and values of SCI (Figure 4—figure supplement 7).
Co-immunoprecipitation experiments
20–30 seedlings per plate were grown in wells of a 6-well plate for 2 weeks, transferred to 2 mM MES-KOH, pH 5.8, and incubated overnight. The next day flg22 (final concentration 100 nM) and/or RALF23 (final concentration 1 µM) were added and incubated for 10 min. Seedlings were then frozen in liquid N2 and subjected to protein extraction. To analyze FLS2-BAK1 receptor complex formation, proteins were isolated in 50 mM Tris-HCl pH 7.5, 150 mM NaCl, 10% glycerol, 5 mM dithiothreitol, 1% protease inhibitor cocktail (Sigma-Aldrich), 2 mM Na2MoO4, 2.5 mM NaF, 1.5 mM activated Na3VO4, 1 mM phenylmethanesulfonyl fluoride, and 0.5% IGEPAL. For immunoprecipitations, α-rabbit Trueblot agarose beads (eBioscience) coupled with α-FLS2 antibodies (Chinchilla et al., 2007) or GFP-Trap agarose beads (ChromoTek) were used and incubated with the crude extract for 3–4 hr at 4°C. Subsequently, beads were washed three times with wash buffer (50 mM Tris-HCl pH 7.5, 150 mM NaCl, 1 mM phenylmethanesulfonyl fluoride, 0,1% IGEPAL) before adding Laemmli sample buffer and incubating for 10 min at 95°C. Analysis was carried out by SDS-PAGE and immunoblotting. To test the association between Flag-LRX4 and FER, total protein from 60 to 90 seedlings per treatment per genotype was extracted as previously described. For immunoprecipitations, M2 anti-Flag affinity gel (Sigma A2220-5ML) was used and incubated with the crude extract for 2–3 hr at 4°C. Subsequently, beads were washed three times with wash buffer (50 mM Tris-HCl pH 7.5, 150 mM NaCl, 1 mM phenylmethanesulfonyl fluoride, 0.1% IGEPAL) before adding Laemmli sample buffer and incubating for 10 min at 95°C. Analysis was carried out by SDS-PAGE and immunoblotting. The replicates of the co-immunoprecipitation are presented in Figure 4—figure supplement 8.
Immunoblotting
Protein samples were separated in 10% bisacrylamide gels at 150 V for approximately 2 hr and transferred into activated PVDF membranes at 100 V for 90 min. Immunoblotting was performed with antibodies diluted in blocking solution (5% fat-free milk in TBS with 0.1% [v/v] Tween-20). Antibodies used in this study were α-BAK1 (1:5000; Roux, 2011), α-FLS2 (1:1000; Chinchilla et al., 2007), α-FER (1:2000; Xiao et al., 2019), α-BAK1 pS612 (1:3000; Perraki, 2018), α-FLAG-HRP (Sigma-Aldrich, A8592, dilution 1:4000), and α -GFP (sc-9996, Santa Cruz, used at 1:5000). Blots were developed with Pierce ECL/ECL Femto Western Blotting Substrate (Thermo Scientific). The following secondary antibodies were used: anti-rabbit IgG-HRP Trueblot (Rockland, 18-8816-31, dilution 1:10,000) for detection of FLS2-BAK1 co-immunoprecipitation or anti-rabbit IgG (whole molecule)–HRP (A0545, Sigma, dilution 1:10,000) for all other western blots.
Statistical analysis
Statistical analyses were carried out using Prism 6.0 software (GraphPad). As mentioned in the figure legends, statistical significances were assessed using nonparametric Kruskal–Wallis bilateral tests combined with post-hoc Dunn’s multiple pairwise comparisons or using a two-way nonparametric Student’s t-test Mann–Whitney test.
Accession numbers
FER (AT3G51550), LRX3 (AT4G13340), LRX4 (AT3G24480), LRX5 (AT4G18670), RALF23 (AT3G16570), FLS2 (AT5G46330), BAK1 (AT4G33430).
Acknowledgements
We thank all present and past members of the Zipfel laboratory for fruitful discussions and comments on the manuscript. We thank the members of the Grossniklaus, Ringli, Sanchez-Rodriguez, and Keller laboratories for sharing results and comments during our stimulating CCWI meetings. We thank Vera Gorelova, Yvon Jaillais, Alexandre Martinière, and Birgit Kemmerling for comments on the manuscript. This research was funded by the Gatsby Charitable Foundation (CZ), the University of Zürich (CZ), the European Research Council under the Grant Agreements 309858 and 773153 (grants PHOSPHinnATE and IMMUNO-PEPTALK to CZ) and 639678 (grant AuxinER to JK-V), the Swiss National Science Foundation (grant no. 31003A_182625 to CZ and 31003A_166577/1 to CR), and the Austrian science fund (FWF; P33044 to JK-V). JG, CMF, and TAD were supported by Long-Term Fellowships from the European Molecular Biology Organization (EMBO) (numbers 438-2018, 512-2019, and 100-2017, respectively), while MS was supported by a postdoctoral fellowship (STE 2448/1) from the Deutsche Forschungsgemeinschaft (DFG) and KD by a doctoral fellowship from the Austrian Academy of Sciences (ÖAW). We thank Sarah Assman, Sacco de Vries, Silke Robatzek, and Nana Keinath for kindly providing segregating lines of fer-4/pFER::FERK565R-GFP, Col-0/pBAK1::BAK1-mCherry, Col-0/pFLS2::FLS2-GFP, and fer-2/pFER::FERK565R-GFP, respectively.
Funding Statement
The funders had no role in study design, data collection and interpretation, or the decision to submit the work for publication.
Contributor Information
Julien Gronnier, Email: julien.gronnier@zmbp.uni-tuebingen.de.
Cyril Zipfel, Email: cyril.zipfel@botinst.uzh.ch.
Dominique C Bergmann, Stanford University, United States.
Jonathan A Cooper, Fred Hutchinson Cancer Research Center, United States.
Funding Information
This paper was supported by the following grants:
Gatsby Charitable Foundation to Cyril Zipfel.
University of Zurich to Cyril Zipfel.
H2020 European Research Council 309858 to Cyril Zipfel.
H2020 European Research Council 773153 to Cyril Zipfel.
European Molecular Biology Organization LTF 438-2018 to Julien Gronnier.
European Molecular Biology Organization LTF 512-2019 to Christina M Franck.
European Molecular Biology Organization LTF 100-2017 to Thomas A DeFalco.
H2020 European Research Council 639678 to Jürgen Kleine-Vehn.
Swiss National Science Foundation 31003A_182625 to Cyril Zipfel.
Swiss National Science Foundation 31003A_166577/1 to Christoph Ringli.
Austrian Science Fund P 33044 to Jürgen Kleine-Vehn.
Deutsche Forschungsgemeinschaft STE 2448/1 to Martin Stegmann.
Austrian Academy of Sciences Doctoral fellowship to Kai Dünser.
Additional information
Competing interests
No competing interests declared.
No competing interests declared.
Senior editor, eLife.
Author contributions
Conceptualization, Formal analysis, Funding acquisition, Investigation, Supervision, Visualization, Writing – original draft, Writing – review and editing.
Investigation, Writing – review and editing.
Investigation, Writing – review and editing.
Investigation, Writing – review and editing.
Investigation, Writing – review and editing.
Investigation.
Investigation.
Resources.
Resources.
Conceptualization, Funding acquisition, Project administration, Writing – review and editing.
Resources, Writing – review and editing.
Conceptualization, Funding acquisition, Project administration, Supervision, Writing – original draft, Writing – review and editing.
Additional files
Data availability
All data generated or analysed during this study are included in the manuscript and supporting files.
The following previously published datasets were used:
The Arabidopsis Genome Initiative 2000. Locus: AT3G51550. The Arabidopsis Information Resource. AT3G51550
The Arabidopsis Genome Initiative 2000. Locus: AT4G13340. The Arabidopsis Information Resource. AT4G13340
The Arabidopsis Genome Initiative 2000. Locus: AT3G24480. The Arabidopsis Information Resource. AT3G24480
The Arabidopsis Genome Initiative 2000. Locus: AT4G18670. The Arabidopsis Information Resource. AT4G18670
The Arabidopsis Genome Initiative 2000. Locus: AT3G16570. The Arabidopsis Information Resource. AT3G16570
The Arabidopsis Genome Initiative 2000. Locus: AT5G46330. The Arabidopsis Information Resource. AT5G46330
The Arabidopsis Genome Initiative 2000. Locus: AT4G33430. The Arabidopsis Information Resource. AT4G33430
References
- Abarca A, Franck CM, Zipfel C. Family-wide evaluation of RAPID ALKALINIZATION FACTOR peptides. Plant Physiology. 2021;187:996–1010. doi: 10.1093/plphys/kiab308. [DOI] [PMC free article] [PubMed] [Google Scholar]
- Ballweg S, Sezgin E, Doktorova M, Covino R, Reinhard J, Wunnicke D, Hänelt I, Levental I, Hummer G, Ernst R. Regulation of lipid saturation without sensing membrane fluidity. Nature Communications. 2020;11:756. doi: 10.1038/s41467-020-14528-1. [DOI] [PMC free article] [PubMed] [Google Scholar]
- Baumberger N, Ringli C, Keller B. The chimeric leucine-rich repeat/extensin cell wall protein LRX1 is required for root hair morphogenesis in Arabidopsis thaliana. Genes & Development. 2001;15:1128–1139. doi: 10.1101/gad.200201. [DOI] [PMC free article] [PubMed] [Google Scholar]
- Boisson-Dernier A, Kessler SA, Grossniklaus U. The walls have ears: the role of plant CrRLK1Ls in sensing and transducing extracellular signals. Journal of Experimental Botany. 2011;62:1581–1591. doi: 10.1093/jxb/erq445. [DOI] [PubMed] [Google Scholar]
- Bücherl CA, van Esse GW, Kruis A, Luchtenberg J, Westphal AH, Aker J, van Hoek A, Albrecht C, Borst JW, de Vries SC. Visualization of BRI1 and BAK1(SERK3) membrane receptor heterooligomers during brassinosteroid signaling. Plant Physiology. 2013;162:1911–1925. doi: 10.1104/pp.113.220152. [DOI] [PMC free article] [PubMed] [Google Scholar]
- Bücherl CA, Jarsch IK, Schudoma C, Segonzac C, Mbengue M, Robatzek S, MacLean D, Ott T, Zipfel C. Plant immune and growth receptors share common signalling components but localise to distinct plasma membrane nanodomains. eLife. 2017;6:e25114. doi: 10.7554/eLife.25114. [DOI] [PMC free article] [PubMed] [Google Scholar]
- Chakravorty D, Yu Y, Assmann SM. A kinase-dead version of FERONIA receptor-like kinase has dose-dependent impacts on rosette morphology and RALF1-mediated stomatal movements. FEBS Letters. 2018;592:3429–3437. doi: 10.1002/1873-3468.13249. [DOI] [PMC free article] [PubMed] [Google Scholar]
- Chinchilla D, Zipfel C, Robatzek S, Kemmerling B, Nürnberger T, Jones JDG, Felix G, Boller T. A flagellin-induced complex of the receptor FLS2 and BAK1 initiates plant defence. Nature. 2007;448:497–500. doi: 10.1038/nature05999. [DOI] [PubMed] [Google Scholar]
- Daněk M, Angelini J, Malínská K, Andrejch J, Amlerová Z, Kocourková D, Brouzdová J, Valentová O, Martinec J, Petrášek J. Cell wall contributes to the stability of plasma membrane nanodomain organization of Arabidopsis thaliana FLOTILLIN2 and HYPERSENSITIVE INDUCED REACTION1 proteins. The Plant Journal. 2020;101:619–636. doi: 10.1111/tpj.14566. [DOI] [PubMed] [Google Scholar]
- DeFalco TA, Zipfel C. Molecular mechanisms of early plant pattern-triggered immune signaling. Molecular Cell. 2021;81:3449–3467. doi: 10.1016/j.molcel.2021.07.029. [DOI] [PubMed] [Google Scholar]
- Duan Q. FERONIA receptor-like kinase regulates RHO GTPase signaling of root hair development. PNAS. 2010;107:17821–17826. doi: 10.1073/pnas.1005366107. [DOI] [PMC free article] [PubMed] [Google Scholar]
- Dünser K. Extracellular matrix sensing by FERONIA and Leucine‐Rich Repeat Extensins controls vacuolar expansion during cellular elongation in Arabidopsis thaliana. The EMBO Journal. 2019;38:7. doi: 10.15252/embj.2018100353. [DOI] [PMC free article] [PubMed] [Google Scholar]
- Feng W. The FERONIA Receptor Kinase Maintains Cell-Wall Integrity during Salt Stress through Ca 2+ Signaling. Current Biology. 2018;28:666–675. doi: 10.1016/j.cub.2018.01.023. [DOI] [PMC free article] [PubMed] [Google Scholar]
- Feraru E. PIN polarity maintenance by the cell wall in Arabidopsis. Current Biology. 2011;21:338–343. doi: 10.1016/j.cub.2011.01.036. [DOI] [PubMed] [Google Scholar]
- Franck CM, Westermann J, Boisson-Dernier A. Plant Malectin-Like Receptor Kinases: From Cell Wall Integrity to Immunity and Beyond. Annual Review of Plant Biology. 2018;69:301–328. doi: 10.1146/annurev-arplant-042817-040557. [DOI] [PubMed] [Google Scholar]
- Ge Z, Bergonci T, Zhao Y, Zou Y, Du S, Liu MC, Luo X, Ruan H, García-Valencia LE, Zhong S, Hou S, Huang Q, Lai L, Moura DS, Gu H, Dong J, Wu HM, Dresselhaus T, Xiao J, Cheung AY, Qu LJ. Arabidopsis pollen tube integrity and sperm release are regulated by RALF-mediated signaling. Science. 2017;358:1596–1600. doi: 10.1126/science.aao3642. [DOI] [PMC free article] [PubMed] [Google Scholar]
- Göhre V, Spallek T, Häweker H, Mersmann S, Mentzel T, Boller T, de Torres M, Mansfield JW, Robatzek S. Plant pattern-recognition receptor FLS2 is directed for degradation by the bacterial ubiquitin ligase AvrPtoB. Current Biology. 2008;18:1824–1832. doi: 10.1016/j.cub.2008.10.063. [DOI] [PubMed] [Google Scholar]
- Gómez-Gómez L, Boller T. FLS2: an LRR receptor-like kinase involved in the perception of the bacterial elicitor flagellin in Arabidopsis. Molecular Cell. 2000;5:1003–1011. doi: 10.1016/s1097-2765(00)80265-8. [DOI] [PubMed] [Google Scholar]
- Gonneau M, Desprez T, Martin M, Doblas VG, Bacete L, Miart F, Sormani R, Hématy K, Renou J, Landrein B, Murphy E, Van De Cotte B, Vernhettes S, De Smet I, Höfte H. Receptor Kinase THESEUS1 Is a Rapid Alkalinization Factor 34 Receptor in Arabidopsis. Current Biology. 2018;28:2452–2458. doi: 10.1016/j.cub.2018.05.075. [DOI] [PubMed] [Google Scholar]
- Gronnier J, Crowet JM, Habenstein B, Nasir MN, Bayle V, Hosy E, Platre MP, Gouguet P, Raffaele S, Martinez D, Grelard A, Loquet A, Simon-Plas F, Gerbeau-Pissot P, Der C, Bayer EM, Jaillais Y, Deleu M, Germain V, Lins L, Mongrand S. Structural basis for plant plasma membrane protein dynamics and organization into functional nanodomains. eLife. 2017;6:e26404. doi: 10.7554/eLife.26404. [DOI] [PMC free article] [PubMed] [Google Scholar]
- Gronnier J, Gerbeau-Pissot P, Germain V, Mongrand S, Simon-Plas F. Divide and Rule: Plant Plasma Membrane Organization. Trends in Plant Science. 2018;23:899–917. doi: 10.1016/j.tplants.2018.07.007. [DOI] [PubMed] [Google Scholar]
- Gronnier J, Legrand A, Loquet A, Habenstein B, Germain V, Mongrand S. Mechanisms governing subcompartmentalization of biological membranes. Current Opinion in Plant Biology. 2019;52:114–123. doi: 10.1016/j.pbi.2019.08.003. [DOI] [PubMed] [Google Scholar]
- Grossmann G, Malinsky J, Stahlschmidt W, Loibl M, Weig-Meckl I, Frommer WB, Opekarová M, Tanner W. Plasma membrane microdomains regulate turnover of transport proteins in yeast. The Journal of Cell Biology. 2008;183:1075–1088. doi: 10.1083/jcb.200806035. [DOI] [PMC free article] [PubMed] [Google Scholar]
- Haruta M, Sabat G, Stecker K, Minkoff BB, Sussman MR. A peptide hormone and its receptor protein kinase regulate plant cell expansion. Science. 2014;343:408–411. doi: 10.1126/science.1244454. [DOI] [PMC free article] [PubMed] [Google Scholar]
- Heese A, Hann DR, Gimenez-Ibanez S, Jones AME, He K, Li J, Schroeder JI, Peck SC, Rathjen JP. The receptor-like kinase SERK3/BAK1 is a central regulator of innate immunity in plants. PNAS. 2007;104:12217–12222. doi: 10.1073/pnas.0705306104. [DOI] [PMC free article] [PubMed] [Google Scholar]
- Herger A, Dünser K, Kleine-Vehn J, Ringli C. Leucine-Rich Repeat Extensin Proteins and Their Role in Cell Wall Sensing. Current Biology. 2019;29:R851–R858. doi: 10.1016/j.cub.2019.07.039. [DOI] [PubMed] [Google Scholar]
- Herger A, Gupta S, Kadler G, Franck CM, Boisson-Dernier A, Ringli C. Overlapping functions and protein-protein interactions of LRR-extensins in Arabidopsis. PLOS Genetics. 2020;16:e1008847. doi: 10.1371/journal.pgen.1008847. [DOI] [PMC free article] [PubMed] [Google Scholar]
- Hohmann U, Lau K, Hothorn M. The Structural Basis of Ligand Perception and Signal Activation by Receptor Kinases. Annual Review of Plant Biology. 2017;68:109–137. doi: 10.1146/annurev-arplant-042916-040957. [DOI] [PubMed] [Google Scholar]
- Hutten SJ, Hamers DS, Aan den Toorn M, van Esse W, Nolles A, Bücherl CA, de Vries SC, Hohlbein J, Borst JW. Visualization of BRI1 and SERK3/BAK1 Nanoclusters in Arabidopsis Roots. PLOS ONE. 2017;12:e0169905. doi: 10.1371/journal.pone.0169905. [DOI] [PMC free article] [PubMed] [Google Scholar]
- Jacobson K, Liu P, Lagerholm BC. The Lateral Organization and Mobility of Plasma Membrane Components. Cell. 2019;177:806–819. doi: 10.1016/j.cell.2019.04.018. [DOI] [PMC free article] [PubMed] [Google Scholar]
- Jaillais Y, Ott T. The Nanoscale Organization of the Plasma Membrane and Its Importance in Signaling: A Proteolipid Perspective. Plant Physiology. 2020;182:1682–1696. doi: 10.1104/pp.19.01349. [DOI] [PMC free article] [PubMed] [Google Scholar]
- Jaqaman K, Loerke D, Mettlen M, Kuwata H, Grinstein S, Schmid SL, Danuser G. Robust single-particle tracking in live-cell time-lapse sequences. Nature Methods. 2008;5:695–702. doi: 10.1038/nmeth.1237. [DOI] [PMC free article] [PubMed] [Google Scholar]
- Kadota Y, Sklenar J, Derbyshire P, Stransfeld L, Asai S, Ntoukakis V, Jones JD, Shirasu K, Menke F, Jones A, Zipfel C. Direct regulation of the NADPH oxidase RBOHD by the PRR-associated kinase BIK1 during plant immunity. Molecular Cell. 2014;54:43–55. doi: 10.1016/j.molcel.2014.02.021. [DOI] [PubMed] [Google Scholar]
- Kusumi A, Sako Y, Yamamoto M. Confined lateral diffusion of membrane receptors as studied by single particle tracking (nanovid microscopy). Effects of calcium-induced differentiation in cultured epithelial cells. Biophysical Journal. 1993;65:2021–2040. doi: 10.1016/S0006-3495(93)81253-0. [DOI] [PMC free article] [PubMed] [Google Scholar]
- Liang P, Stratil TF, Popp C, Marín M, Folgmann J, Mysore KS, Wen J, Ott T. Symbiotic root infections in Medicago truncatula require remorin-mediated receptor stabilization in membrane nanodomains. PNAS. 2018;115:5289–5294. doi: 10.1073/pnas.1721868115. [DOI] [PMC free article] [PubMed] [Google Scholar]
- Lin W. FERONIA’s Sensing of Cell Wall Pectin Activates ROP GTPase Signaling in Arabidopsis. bioRxiv. 2018 doi: 10.1101/269647. [DOI]
- Lin W, Tang W, Pan X, Huang A, Gao X, Anderson CT, Yang Z. Arabidopsis pavement cell morphogenesis requires FERONIA binding to pectin for activation of ROP GTPase signaling. Current Biology. 2021;0:30. doi: 10.1016/j.cub.2021.11.030. [DOI] [PubMed] [Google Scholar]
- Liu C. Pollen PCP-B peptides unlock a stigma peptide–receptor kinase gating mechanism for pollination. Science. 2021;372:171–175. doi: 10.1126/SCIENCE.ABC6107. [DOI] [PubMed] [Google Scholar]
- Martinière A. Cell wall constrains lateral diffusion of plant plasma-membrane proteins. PNAS. 2012;109:12805–12810. doi: 10.1073/pnas.1202040109. [DOI] [PMC free article] [PubMed] [Google Scholar]
- McKenna JF. The cell wall regulates dynamics and size of plasma-membrane nanodomains in Arabidopsis. PNAS. 2019;116:12857–12862. doi: 10.1073/pnas.1819077116. [DOI] [PMC free article] [PubMed] [Google Scholar]
- Mecchia MA. RALF4/19 peptides interact with LRX proteins to control pollen tube growth in Arabidopsis. Science. 2017;358:1600–1603. doi: 10.1126/science.aao5467. [DOI] [PubMed] [Google Scholar]
- Moussu S. Crystal structures of two tandem malectin-like receptor kinases involved in plant reproduction. Acta Cryst. 2018;74:671–680. doi: 10.1107/S205979831800774X. [DOI] [PMC free article] [PubMed] [Google Scholar]
- Moussu S. Structural basis for recognition of RALF peptides by LRX proteins during pollen tube growth. PNAS. 2020;117:7494–7503. doi: 10.1073/pnas.2000100117. [DOI] [PMC free article] [PubMed] [Google Scholar]
- Perraki A. Phosphocode-dependent functional dichotomy of a common co-receptor in plant signalling. Nature. 2018;561:248–252. doi: 10.1038/s41586-018-0471-x. [DOI] [PMC free article] [PubMed] [Google Scholar]
- Roux M. The Arabidopsis leucine-rich repeat receptor-like kinases BAK1/SERK3 and BKK1/SERK4 are required for innate immunity to hemibiotrophic and biotrophic pathogens. The Plant Cell. 2011;23:2440–2455. doi: 10.1105/tpc.111.084301. [DOI] [PMC free article] [PubMed] [Google Scholar]
- Schindelin J, Arganda-Carreras I, Frise E, Kaynig V, Longair M, Pietzsch T, Preibisch S, Rueden C, Saalfeld S, Schmid B, Tinevez J-Y, White DJ, Hartenstein V, Eliceiri K, Tomancak P, Cardona A. Fiji: an open-source platform for biological-image analysis. Nature Methods. 2012;9:676–682. doi: 10.1038/nmeth.2019. [DOI] [PMC free article] [PubMed] [Google Scholar]
- Schulze B, Mentzel T, Jehle AK, Mueller K, Beeler S, Boller T, Felix G, Chinchilla D. Rapid heteromerization and phosphorylation of ligand-activated plant transmembrane receptors and their associated kinase BAK1. The Journal of Biological Chemistry. 2010;285:9444–9451. doi: 10.1074/jbc.M109.096842. [DOI] [PMC free article] [PubMed] [Google Scholar]
- Smakowska-Luzan E, Mott GA, Parys K, Stegmann M, Howton TC, Layeghifard M, Neuhold J, Lehner A, Kong J, Grünwald K, Weinberger N, Satbhai SB, Mayer D, Busch W, Madalinski M, Stolt-Bergner P, Provart NJ, Mukhtar MS, Zipfel C, Desveaux D, Guttman DS, Belkhadir Y. An extracellular network of Arabidopsis leucine-rich repeat receptor kinases. Nature. 2018;553:342–346. doi: 10.1038/nature25184. [DOI] [PMC free article] [PubMed] [Google Scholar]
- Stegmann M, Monaghan J, Smakowska-Luzan E, Rovenich H, Lehner A, Holton N, Belkhadir Y, Zipfel C. The receptor kinase FER is a RALF-regulated scaffold controlling plant immune signaling. Science. 2017;355:287–289. doi: 10.1126/science.aal2541. [DOI] [PubMed] [Google Scholar]
- Sun Y, Li L, Macho AP, Han Z, Hu Z, Zipfel C, Zhou J-M, Chai J. Structural basis for flg22-induced activation of the Arabidopsis FLS2-BAK1 immune complex. Science. 2013;342:624–628. doi: 10.1126/science.1243825. [DOI] [PubMed] [Google Scholar]
- Thor K, Jiang S, Michard E, George J, Scherzer S, Huang S, Dindas J, Derbyshire P, Leitão N, DeFalco TA, Köster P, Hunter K, Kimura S, Gronnier J, Stransfeld L, Kadota Y, Bücherl CA, Charpentier M, Wrzaczek M, MacLean D, Oldroyd GED, Menke FLH, Roelfsema MRG, Hedrich R, Feijó J, Zipfel C. The calcium-permeable channel OSCA1.3 regulates plant stomatal immunity. Nature. 2020;585:569–573. doi: 10.1038/s41586-020-2702-1. [DOI] [PMC free article] [PubMed] [Google Scholar]
- Tinevez J-Y, Perry N, Schindelin J, Hoopes GM, Reynolds GD, Laplantine E, Bednarek SY, Shorte SL, Eliceiri KW. TrackMate: An open and extensible platform for single-particle tracking. Methods. 2017;115:80–90. doi: 10.1016/j.ymeth.2016.09.016. [DOI] [PubMed] [Google Scholar]
- Tran TM, Ma Z, Triebl A, Nath S, Cheng Y, Gong BQ, Han X, Wang J, Li JF, Wenk MR, Torta F, Mayor S, Yang L, Miao Y. The bacterial quorum sensing signal DSF hijacks Arabidopsis thaliana sterol biosynthesis to suppress plant innate immunity. Life Science Alliance. 2020;3:10. doi: 10.26508/lsa.202000720. [DOI] [PMC free article] [PubMed] [Google Scholar]
- Wagner T, Kroll A, Haramagatti CR, Lipinski H-G, Wiemann M. Classification and Segmentation of Nanoparticle Diffusion Trajectories in Cellular Micro Environments. PLOS ONE. 2017;12:e0170165. doi: 10.1371/journal.pone.0170165. [DOI] [PMC free article] [PubMed] [Google Scholar]
- Xiao Y, Stegmann M, Han Z, DeFalco TA, Parys K, Xu L, Belkhadir Y, Zipfel C, Chai J. Mechanisms of RALF peptide perception by a heterotypic receptor complex. Nature. 2019;572:270–274. doi: 10.1038/s41586-019-1409-7. [DOI] [PubMed] [Google Scholar]
- Yu M, Li R, Cui Y, Chen W, Li B, Zhang X, Bu Y, Cao Y, Xing J, Jewaria PK, Li X, Bhalerao RP, Yu F, Lin J. The RALF1-FERONIA interaction modulates endocytosis to mediate control of root growth in Arabidopsis Development. Development. 2020;147:dev189902. doi: 10.1242/dev.189902. [DOI] [PubMed] [Google Scholar]
- Zhao C, Zayed O, Yu Z, Jiang W, Zhu P, Hsu CC, Zhang L, Tao WA, Lozano-Durán R, Zhu JK. Leucine-rich repeat extensin proteins regulate plant salt tolerance in Arabidopsis. PNAS. 2018;115:13123–13128. doi: 10.1073/pnas.1816991115. [DOI] [PMC free article] [PubMed] [Google Scholar]
- Zipfel C, Kunze G, Chinchilla D, Caniard A, Jones JDG, Boller T, Felix G. Perception of the bacterial PAMP EF-Tu by the receptor EFR restricts Agrobacterium-mediated transformation. Cell. 2006;125:749–760. doi: 10.1016/j.cell.2006.03.037. [DOI] [PubMed] [Google Scholar]