Abstract
In this study, we propose a surface plasmon resonance (SPR)-based biosensor using silicon nitride (Si3N4), black phosphorous (BP), and thiol-tethered DNA as a ligand for fast detection of the SARS-CoV-2 virus. In the proposed biosensor, we have deposited silver (Ag), Si3N4, and BP on the base of the BK-7 prism and investigated the performance parameters on the probe in different combinations of the mentioned materials. Herein, three (Ag, Si3N4, and BP) different configurations are introduced and compared for the detection of SARS-CoV-2. Furthermore, with the help of the transfer matrix method (TMM), all the three configurations have been analyzed. Notably, the combination of Ag, Si3N4, and BP shows better sensitivity (154°/RIU) when compared with other configurations for the detection of SARS-CoV-2. This work may facilitate a new sensing device to detect SARS-CoV-2, based on the hybrid materials.
Keywords: Surface plasmon resonance, Coronavirus disease, SARS-CoV-2, Silicon nitride, Sensitivity, Detection accuracy
Introduction
The outbreak of the coronavirus disease (COVID-19) pandemic has become a worldwide health problem investigated by severe cute respiratory syndrome coronavirus-2 (SARS-CoV-2). Countries are battling to slow the spread of this virus by testing and treating patients. However, the testing procedure to detect this virus is tedious. Today’s world has been facing corona virus disease since December 2019 [1, 2], and it has also been called COVID-19. The first cases were identified in the City of Wuhan, in the Hubei Province of China. The World Health Organization (WHO) declared the outbreak a public health emergency of international concern for the human-to-human transferrable severe acute respiratory syndrome (SARS-CoV-2) virus a global pandemic [3–6]. The SARS-CoV-2 virus has contained mainly four significant proteins, i.e., spike proteins (S), membrane proteins (M), envelop proteins (E), and nucleoprotein (NPs), that have been used for detecting this virus [7–9]. It is essential for sensitive, quick-test results and low-cost with high accuracy analytical tools to monitor affected people for effective quarantine and timely treatment. There is various conventional technique to detect the COVID-19 virus which induces the reverse transcription polymerase chain reaction (RT-PCR) [10, 11], reverse transcription loop-mediated isothermal amplification (RT-LAMP) [12, 13], enzyme-linked immunosorbent assay (ELISA) [14], and chest computed tomography (CT) [15, 16].
A lot of research work has been done for the detection of SARS-CoV-2 virus using different types of advanced materials. Gold nanoparticle was based on fluorine with a detection scheme of Mehari et al. [17]. Zhang et al. also reported a graphene-based, highly sensing mechanism for the detection of SARS-CoV-2 virus with the help of antibody-antigen interaction [18]. Nowadays SPR-based detection technique has been involved for detection of SARS-CoV-2 virus [19]. It is a very easy, fast, sensitive, real-time, and label-free detection technique and used for the many types of viruses like dengue [20], influenzas [21], H1N1 [22], and EV71 virus [23]. Due to above advantages, a lot of various research work has been carried out for detection of SARS-CoV-2. Moznuzzaman et al. using MoSe2 have reported the SPR detection technique [24]. To enhance the sensitivity, 2D material-based SPR biosensors have good and important role in the detection of SARS-CoV-2 virus, generating ultra-high detection sensitivity [18, 25]. Many reported works have been done based on 2D material such as graphene [26], MoS2, BP, and MoSe2 [27].
SPR sensing techniques are useful tools which are widely used in various areas like medical diagnostic, environmental science, and food technology over the other techniques [28, 29]. The SPs are the collective oscillation of free electrons at the interface between metal and dielectric and are excited using the p-polarized light beam at the interface of one side of a glass prism. This results in the generation of the evanescent wave at the interface that decays exponentially. This collective phenomenon is known as SPR. SPR sensing is the label-free sensing that works on the principle of the shift of the resonance angle when there is a variation in the refractive index (RI) of the sensing medium [30]. In the prism-based SPR sensing approach, the excitation of the SPs is carried out by the Kretschmann-based attenuated total reflection (ATR) method. The angle of the incident light in the ATR method can be best controlled by the angular interrogation approach [31].
To date, two-dimensional (2D) material based on SPR sensors, generating ultra-high detection sensitivity [18, 25]. Owing to mutual Van der Waals interactions, stacking different 2D material layers to create Van der Waals generates some unprecedented physical and electric properties. However, most of 2D materials enhanced sensor wavelength [26]. Recently, some transition metal dichalcogenide (TMDC) materials used in the SPR biosensor have been discovered. These TMDCs act as plasmonic supporting materials that improve the performance of the sensor [32]. A new 2D material, BP, has also been seen in research in biosensor applications, optoelectronics, and electronic field [33].
The thiol ssDNA is used as a receptor of sensing, which exhibited a binding affinity to SARS-CoV-2 immobilized on the surface of ssDNA layer. The SPR biosensor is usually used for detection of biological or chemical samples. The objective of this study is to propose a theoretical design of a surface plasmon resonance (SPR)-based biosensor that could detect SARS-CoV-2 through an easy and fast manner. In the proposed biosensor, thiol ssDNA is used as a ligand layer for the selective detection of SARS-CoV-2. In many research papers, it is found that the ssDNA layer shows excellent properties as a receptor for SARS-CoV-2 [34–36]. In many research works, single-layer ssDNA is considered for the attachment of SARS-Cov2 for biosensing application [37–40]. In present work, we have investigated the effect of the ssDNA layer on the performance parameters.
In this paper, we present in the three configurations that Si3N4 and BP have shown thereon performance in the detection of virus especially in case of SARS-CoV-2 due to their excellent performance. These materials as deposited on the base of the prism according to Kretschmann configuration of SPR devices, in structure-I Bk-7 Prism-Ag-Si3N4-ssDNA, structure-II Bk-7 Prism-Ag-BP-ssDNA, and structure-III Bk-7 Prism-Ag-Si3N4-BP-ssDNA. With the help of TMM method, a theoretical investigation has been done in all three cases. The reflectance spectrum curve is plotted with the help using above method, and its comparison made between all the three configurations for the detection of SARS-CoV-2. The performance parameter (sensitivity (S), detection accuracy (DA), quality factor (QF)) of proposed biosensors is investigated, which is summarized in Table 1. It is found that the sensitivity is maximum in structure-III (152°/RIU) as comparison structure-II (144°/RIU) and structure-I (127°/RIU), respectively. It shows that structure III is more sensitive for the detection for SARS-CoV-2 in comparison to other two structures. It also indicated that Si3N4 and BP hybrid materials are more responsible to enhance sensitivity of the SPR biosensor for the detection for SARS-CoV-2 virus. This study may be very fruitful for enhancing the sensitivity of the SPR biosensor.
Table 1.
SPR biosensor structures
| Serial no | Structures | Design specification |
|---|---|---|
| 1 | Structure-I | Bk-7 Prism-Ag-Si3N4-ssDNA layer |
| 2 | Structure-II | Bk-7 Prism-Ag-BP-ssDNA layer |
| 3 | Structure-III | Bk-7 Prism-Ag-Si3N4-BP-ssDNA |
The Design and Modeling of the Proposed Sensor
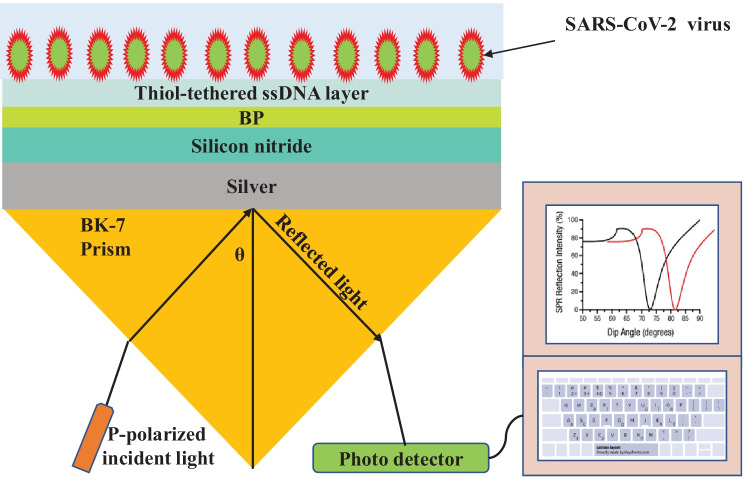
The schematic view of the proposed SPR biosensor for the rapid detection of the SARS-CoV-2 virus configuration is shown in Fig. 1. This novel structure contains four different layers and is based on the Kretschmann configuration as shown in Fig. 1. The choice of BK-7 prism is for enhancement of sensitivity, quality factor, and detection accuracy. We use BK-7 prism as a coupling prism followed by an Ag layer. Ag has been proven to demonstrate better sensitivity as a substrate layer due to higher SPR ratio [33]. However, due to oxidation of the silver layer with the biomolecules, it reduces the lifetime of the SPR biosensor [41]. To overcome the oxidation problem of this material, the anti-reflection coating of the Si3N4 layer can be deposited over the silver layer. Si3N4 has come to attention because of its excellent thermal and chemical stability with a large band gap of ~ 5 eV [32, 33]. In our proposed design, we overcome this problem by employing three layers comprising Si3N4, BP, and thiol-tethered ssDNA, respectively, on top of the Ag layer. Such configuration also aids in Sensitivity enhancement. In recent research, Si3N4 has shown good promise in improving sensitivity. BP improves the adsorption rates of the analyte with the biosensor, due to its direct band gap, higher carrier mobility, and interesting electrical and optical properties [32]. The thiol-tethered ssDNA is used as a ligand layer for sensing medium as it has shown excellent properties as a receptor of SARS-CoV-2 [37, 42]. Having decided on the composition of various layers of our sensor design, the next step is to model them properly to simulate their response. We model each layer as a homogeneous continuous medium up to the next layer interface where in the layer is represented by its refractive index. Hence, the next subsection focuses on modeling the refractive indices of the layers under consideration. The refractive indices of different layers of our structure are each calculated separately. The first layer is a coupling prism of BK-7 prism. The refractive index of BK-7 prism can be calculated from the following relation [43]:
where λ is the wavelength of incident light in micrometer. This equation is only applicable for wavelengths between 0.37 and 2.5 μm.
Fig. 1.
Proposed configuration BK-7 prism-Ag-Si3N4-BP-ssDNA and PBS solution as sensing medium having optimized thickness
The refractive index of the Ag layer can be defined using the well-known Drude model for metal [43].
where and are the plasma and collision wavelength of metallic layer. For silver = (1.7614 × 10⁻⁵ m) and = (1.4541 × 10⁻⁵ m), respectively. Furthermore, the anti-reflection coating of the Si3N4 layer of the optimized thickness (Si3N4 = 5 nm) is grown over the Ag layer that is the second layer. The refractive index value of this Si3N4 layer is calculated by [44]
The next layer is BP followed by Si3N4 layer with monolayer thickness and the corresponding refractive indices, respectively, are shown in Table 1. The final layer before the sensing layer is thiol-tethered ssDNA. The monolayer thickness is 3.2 nm and refractive index 1.462 nm. The corresponding data is obtained from experimental results [37]. Finally, for the sensing layer, phosphate-buffered solution (PBS) can be used as a RI of PBS that is deliberated as ns = 1.334 + ∆ns, where ∆ns is fluctuating due to the ligand-analyte interaction on the sensing surface. Previous literature reported that HEPES 10 mM and 120 mM NaCl solution can dissolve in a PBS buffer composed of SARS-CoV-2 S glycoprotein and the refractive index of PBS can be experimentally measured. When used, different concentrations of HEPES solution were added into 120 mM NaCl solution, and a good linear relationship between the refractive index of PBS and HEPES concentration ranging from 0 to 20 mM, which can be given as an equation as [42]
| 1 |
where y is the refractive index of PBS and x is the HEPES solution (mM), respectively. In this study, various concentrations of HEPES solution were given in 10 mM, so the refractive index of the sensing medium was assumed to be 1.334 [45]. When a sample is flown through the sensing channel, SARS-CoV-2 virus is bonded with thiol-tethered DNA.
Theoretical Framework
We have performed numerical analysis to determine the reflectance for multilayer structure using transfer matrix method and Fresnel equation [28]. Our proposed model consists of three layers with BK-7 prism, Si3N4, BP, and thiol-tethered ssDNA being placed in parallel one after another. The thickness of each layer varies in perpendicular direction denoted as z-axis. The boundary condition at the interface of first layer and the last layer are considered as Z = Z1 = 0 and Z = Zn−1, respectively. The dielectric constant of path layer equals to the square of its refractive index. These methods adopt no approximation allowing them to give accurate results rapidly. The transfer matrix expresses a relationship among the tangential components of electric and magnetic fields of the first layer and the last layer, and the relation is given as [31]
| 2 |
where E1 and H1 represent the tangential components of electric and magnetic fields at the first layer interface. EL − 1 and HL − 1 represent the tangential components of electric and magnetic fields at the final layer interface. P is representing the characteristic matrix of multilayer structure with elements , defined as
where k represents an arbitrary number, represents the phase thickness, and represents the refractive indices of the corresponding layers, which are explained by
| 3 |
| 4 |
where θ0 is the angle of incidence, λ is the wavelength of incident light, and is the refractive index of the BK-7 prism (Table 2).
Table 2.
SPR biosensor thicknesses and RI at 633 nm
After some straightforward mathematical step, here we proposed of three-layer model, the reflection coefficient for p-polarized light is given by
| 5 |
Finally, the reflectance intensity for the p-polarized light is expressed as
| 6 |
Key Parameter of the Proposed SPR Sensor
The performance parameter of the SPR sensor is basically characterized by mainly three parameters as sensitivity (S), detection accuracy (DA), and quality parameter (Q). For the better performance of SPR sensor all of the above parameters should be greater as much as possible.
Sensitivity
The sensitivity is defined as the ratio of change resonance angle (), and change refractive index (∆ns) can be written mathematically as.
| 7 |
It is usually expressed in (°/RIU).
Detection Accuracy
Next, parameter of the SPR sensor is detection accuracy (DA) or signal-to-noise ratio (SNR). It is expressed in term of resonance angle change () and FWHM as given by.
| 8 |
where FWHM means full width at half maxima.
Quality Factor
Another important parameter of SPR sensor is quality factor (Q) or figure of merit (FOM) can be terms of sensitivity (S) and FWHM given as follows:
| 9 |
Its unit is usually expressed in (RIU−1). At resonance condition phase of the reflected light also changes. The phase change at resonance angle can be calculated by the following expression:
| 10 |
The electric field intensity enhancement factor (EFIEF), the ratio of square electric field at last interface to the first layer interface, can be calculated by the following expression [31]:
| 11 |
where ε1 and are the dielectric constants, respectively, and t is the transmission coefficient.
Limit of Detection (LOD)
Limit of detection (LOD) measures the concentration quantitatively of biomolecules/analyte in sensing medium and defined as.
| 12 |
LOD is calculated for very minute change in sensing medium; here, we take shift 0.005°.
Results and Discussion
Here, we have designed SPR biosensor in Kretschmann configuration, which consists of a prism to provide necessary momentum to the surface plasmons. In this work we have taken a BK-7 prism due to its unique property of low refractive index. In this method, surface plasmon (SP) coupling is achieved at the metal–dielectric interface by using a p-polarized light of wavelength 633 nm, as illustrated in Fig. 1. We observe the reflectance change due to the change in the sensing medium. At resonance condition, a sharp dip is observed in the reflectance curve (SPR curve). That means at resonance condition maximum energy is transferred to the surface plasmons. For maximum excitation of SPs, it is necessary to optimize the thickness of the metallic layer that means reflectance minimum should be near to zero. Figure 2 shows the optimization of the silver layer at the BK-7 prism. It is found that at 55-nm thickness of the silver layer, there is minimum reflectance at resonance angle due to loss of transfer energy from incident light to SPs. We can see that the silver layer shows low FWHM in the reflectance which further improved the detection accuracy as silver has less chemical stability due to its easily oxidizing nature. To overcome this problem, we have deposited the anti-reflection coating of the Si3N4 layer (5 nm) over the silver layer due to its unique property as chemical stability and large band gap (~ 5 eV) [32]. Furthermore, to improve the performance parameter of the proposed SPR biosensor, we have used monolayer BP over the Si3N4 layer. Because the BP layer has more characteristics, such as its precise stacking on metal coating and other unique properties like larger surface area, high charge carrier density, and high adsorption energies [41].
Fig. 2.
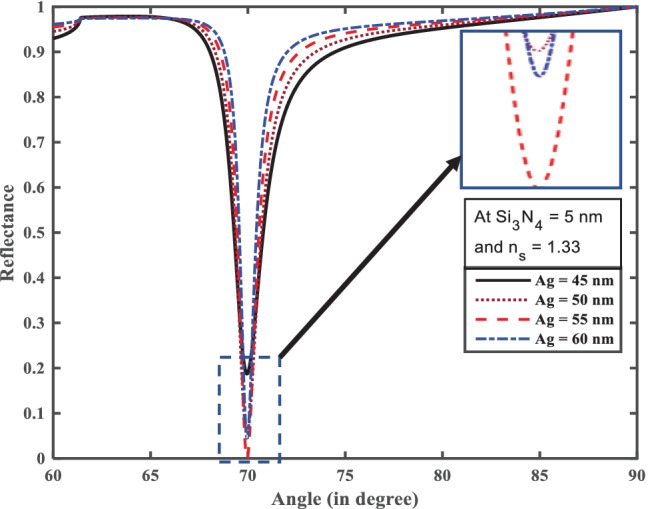
Resonance angle (°) versus reflectance for optimization of Ag and Si3N4
The performance parameter of the SPR biosensor gets affected on adding BP layers. The unique optical and electronic properties of these layered materials are responsible for changing SPR condition. After thickness optimization of silver and silicon nitride we have designed three hybrid structures for the performance analysis such as the Structure-I (BK-7 prism-Ag-Si3N4-ssDNA SPR sensor), Structure-II (BK-7 prism-Ag-BP-ssDNA SPR sensor), and Structure-III (BK-7 prism-Ag-Si3N4-BP-ssDNA SPR sensor). Furthermore, we have analyzed all structures one by one.
From Fig. 2, we first optimize silver (Ag) with silicon nitride (Si3N4) thickness for the efficient excitation of surface plasmons. The optimized thickness Ag and Si3N4 thickness layer at 55 nm and 5 nm, respectively, are shown in Fig. 2. It can be seen clearly from inset in Fig. 2 that with these thicknesses the reflectance curve has shown the minimum dip at the resonance angle. Furthermore, for Structure-I we have added a monolayer ssDNA layer with thickness 3.2 nm over the Si3N4 layer for the adsorption of SARS-CoV-2 as ss-DNA layer works as a bioreceptor layer for the SARS-CoV-2 as shown in Fig. 3a, which makes a better sensor for selective detection of SARS-CoV-2 viruses. Here we have taken phosphate-buffered solution (PBS) solution as a sensing medium in which SARS-CoV-2 viruses are present. After the addition of SARS-CoV-2 viruses in the PBS solution, the refractive index of PBS solution changes from 1.334 to 1.355. It is notable that SARS-CoV-2 S glycoprotein can dissolve in a running buffer composed of 10 mM hydroxy ethyl piperazine ethane sulfonic (HEPES) and 120 mM NaCl solution. In fact, the refractive index of the running buffer can be experimentally measured by an optical sensor. When various concentrations of HEPES solution were added into 120 mM NaCl solution, there is a good linear relationship between the refractive index of the running buffer and HEPES concentration ranging from 0 to 120 mM, which can be described as [18]. We have taken five different concentrations of SARS-CoV-2 values such as 150 mM, 275 mM, 400 mM, and 525 mM. For Structure-I the value of the minimum reflectivity is 6.158 × 10⁻⁵ and resonance angle 70.98° in a bare PBS solution with refractive index 1.334. After adding the SARS-CoV-2 with HEPES solution in sensing channel resonance angle shifts towards higher resonance angle 74.02° with minimum reflectivity 1.3 × 10⁻⁴. Thus, due to the addition of SARS-CoV-2 in the PBS solution, the resonance angle changed by 3.04°, with refractive index changes from 1.335 to 1.355 of the sensing mediums. Thus, for the structure-I the highest sensitivity, detection accuracy, and figure of merit (FOM) obtained reach to 144°/RIU, 2.57, and 122 RIU−1, respectively.
Fig. 3.
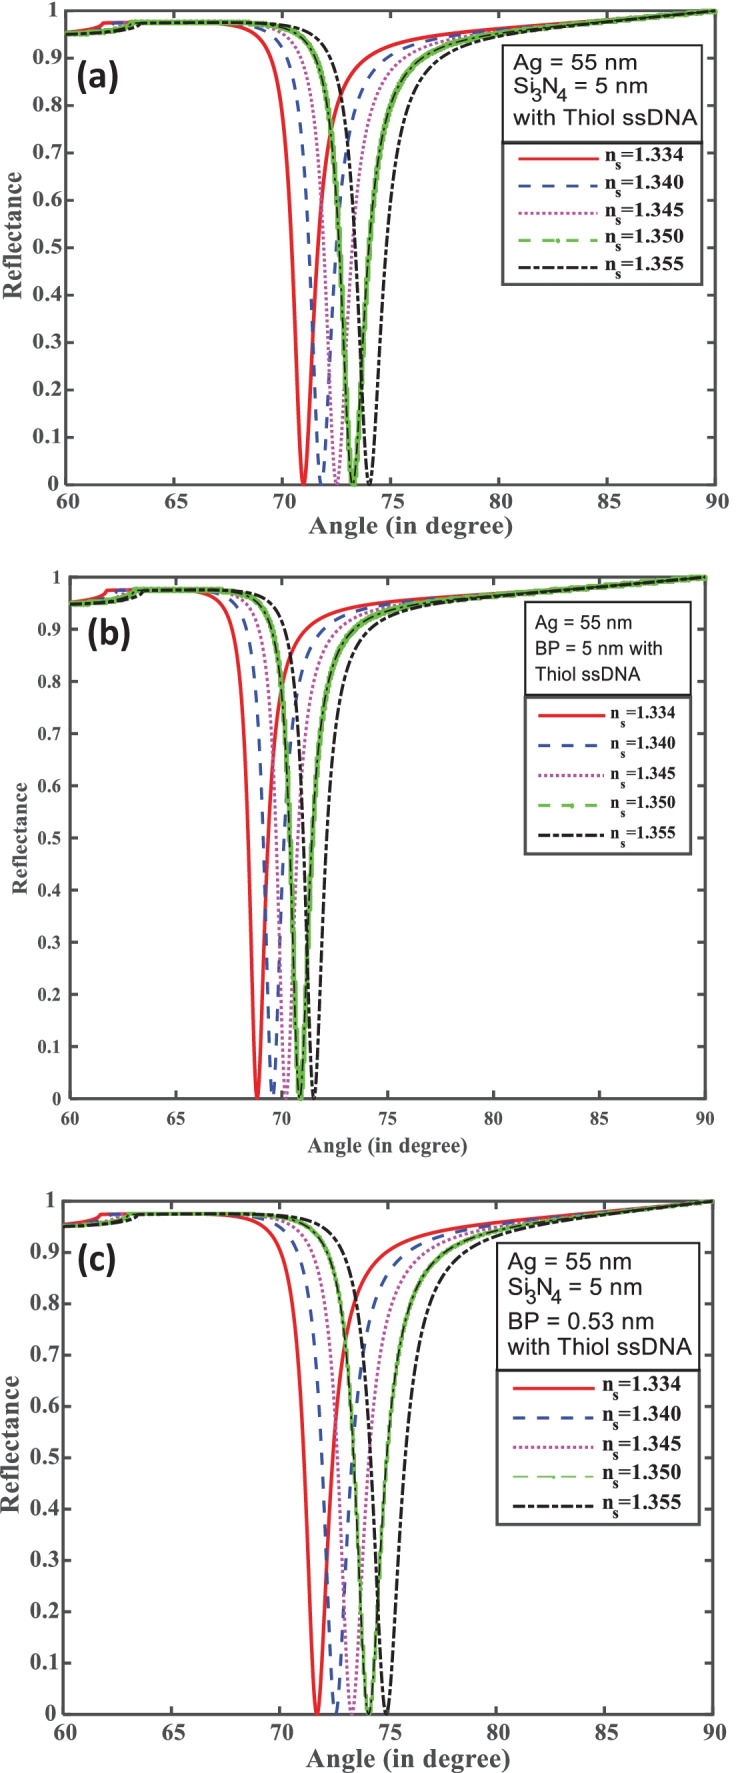
(a–c) Incidence angle (°) versus reflectance for structures I, II, and III
In Structure-II, Ag with BP and thiol ssDNA was based on SPR biosensor. After optimization the Ag layer for minimum reflectance is shown in Fig. 3b. Only the silver layer coated with SPR parameter is not sufficient to find a good result because Ag has less chemical stability and is easy to oxidize. The monolayer BP is directly transferred over the Ag layer for enhanced all-important parameter of the proposed SPR biosensor. The used monolayer BP has its thickness 0.53 nm, and after adding ssDNA layer coated on BP layer, the thickness of ssDNA is 3.2 nm. Due to adding the BP layer, the reflectance curve shows the sharp dip near to zero as shown in Fig. 3b. BP has a large surface area chemical stability and a large band gap. Finally, PBS is used as a sensing medium (refractive index 1.334). After, SARS-CoV-2 with HEPES and 10 mM NaCl solution was added in channel PBS buffer solution of the refractive index change. We have taken five different concentration values such as 0, 150, 275, 400, and 525 mM mixing in the buffer channel. The refractive index ranges from 1.334 to 1.355. For the bare PBS solution, the minimum reflectivity shows 9.687 × 10⁻⁵ and corresponding resonance angle 68.84°. Thus, due to the addition of SARS-CoV-2 in the PBS solution, the resonance angle is 71.51°, and the minimum reflectivity shows 2.719 × 10⁻⁵. The maximum resonance angle change is 2.67°. Figure 3b shows the result: the SPR biosensor has come to maximum sensitivity, and detection accuracy with quality factor obtained 127°/RIU, 2.90, and 138 RIU−1, respectively, and found result mention as shown in Table 3.
Table 3.
The performance parameters of the proposed SPR biosensors
| Serial no | Structure | ∆θ | FWHM | S (°/RIU) | DA | QF (RIU−1) | |
|---|---|---|---|---|---|---|---|
| 1 | Structure-I | 2.67 | 0.92 | 127 | 2.90 | 138 | |
| 2 | Structure-II | 3.04 | 1.18 | 144 | 2.57 | 122 | |
| 3 | Structure-III | 3.20 | 1.29 | 152 | 2.48 | 117 | |
For further improvement of performance parameters of above two configurations we have made a Structure-III for SPR biosensor which contains BK-7 prism-Ag-Si3N4-BP-ssDNA-sensing medium as shown in Fig. 3c. The ssDNA layer was used as a bioreceptor sensing layer for the selective attachment of the SARS-CoV-2 virus. We have taken different concentrations of SARS-CoV-2 solution (0 mM, 150 mM, 275 mM, 400 mM, and 525 mM) dissolved in PBS buffer solution which attached ssDNA layer and made a small change in refractive index 1.334 to 1.355. Figure 3c shows that the bare PBS buffer solution has the minimum reflectivity 8.832 × 10⁻⁸ and corresponding resonance angle 71.72°. After adsorption of the SARS-CoV-2 virus, the minimum reflectivity increased to 6.61 × 10⁻⁴ and the resonance angle shifted to higher angle 74.92°. The maximum resonance angle change is 3.20° due to a concentration change of 525 mM of the SARS-CoV-2 virus. For this configuration, achieved sensitivity is 152°/RIU with detection accuracy 2.48 and quality factor 117 RIU−1. It is observed that the structure-III is much better in comparison to structure-I and structure-II. Thus, the combination of Si3N4 and BP is responsible for sensitivity enhancement in structure-III as compared to structure-I and structure-II. The performance parameters of all the structures at wavelength 633 nm are summarized in Table 3.
Furthermore, we have analyzed the phase change of the reflected light vs incident angle at different concentrations of the analyte for all the structures as shown in Fig. 4a–c. It is noted that for all the structures an abrupt phase change occurs at the corresponding resonance angle. Also, the position of phase change is sensitive for the concentration of the analyte. As we change the concentration of the SARS-CoV-2, the corresponding phase changing position shifts to the higher angle side due to damping of surface plasmon resonance for all structures.
Fig. 4.
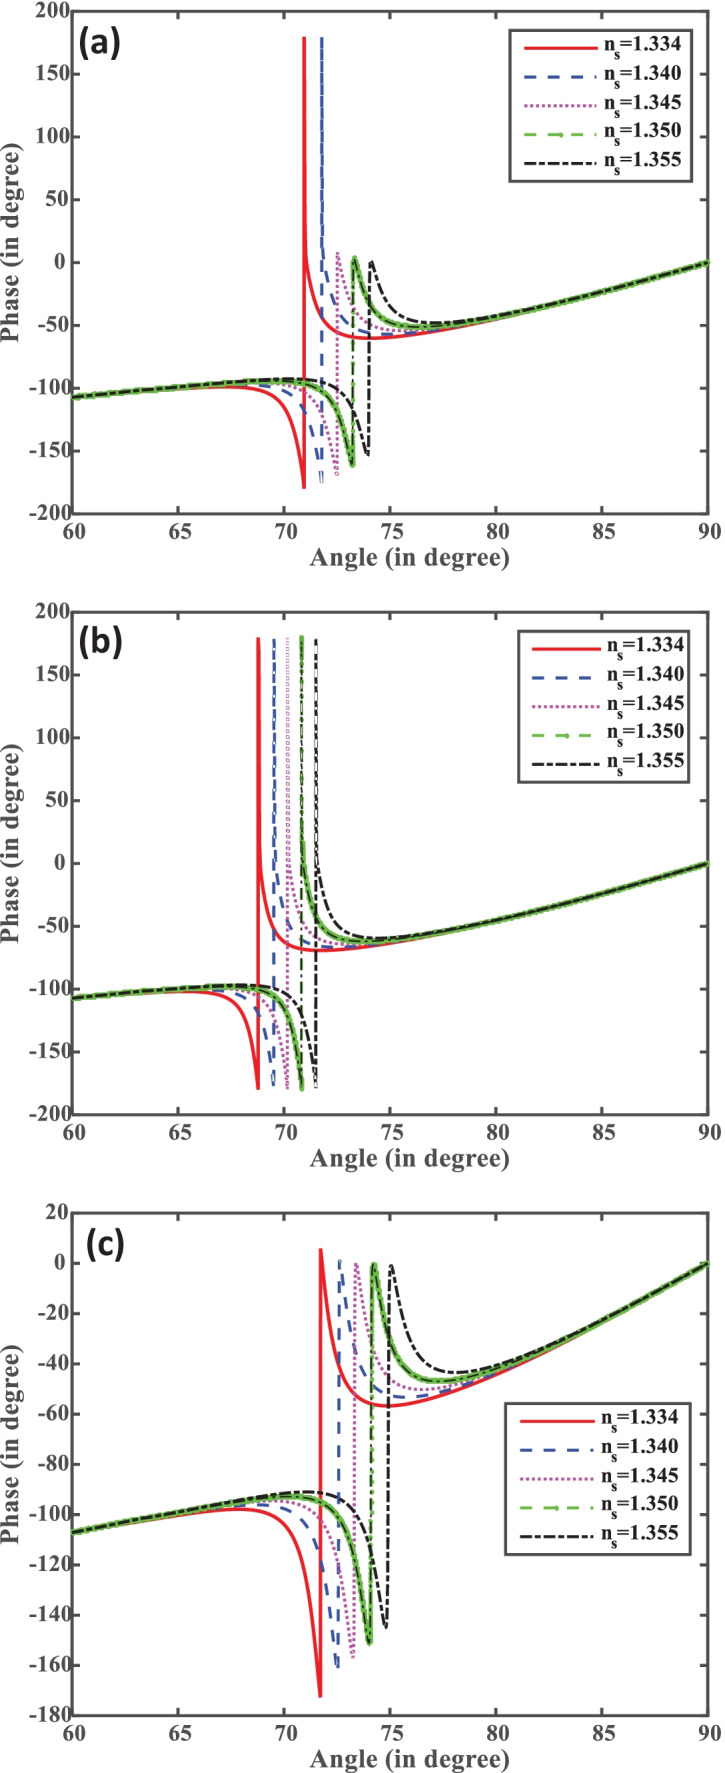
(a–c) Phase vs incident angle for structures I, II, and III.
The interaction of fields of the incident light with the SP field plays a crucial role for the performance of SPR biosensor. The electric field intensity enhancement factor (EFIEF) defines how much effectively the electric filed is confined at the sensing medium as compared to the metal–dielectric interface. In the sensing region, the interaction of the evanescent field with the ssDNA layer is very important. The EFIEF gives the field peak height at the resonance angle for each combination. This confirms the excitation of SPs because at the resonance angle, most of the incident light energy is transferred to the SPs. Mathematically, it is described by Eq. (11). From Fig. 5a, it is also clear that by increasing the concentration of SARS-CoV-2 virus the from ns = 1.334 to ns = 1.355, EFIEF decreases, which occurs due to the strong adsorption of SARS-CoV-2 at the sensing surface of the biosensor. The decrease in EFIEF with the concentration of SARS-CoV-2 virus occurs due to absorption of incident energy by the SARS-CoV-2 virus. In this study, we have taken fixed thickness of ssDNA layer and varied the concentration of SARS-CoV-2 virus. Figure 5a–c show the variation of EFIEF of the proposed biosensor with the refractive index of the sensing medium in all the structures I, II, and III.
Fig. 5.
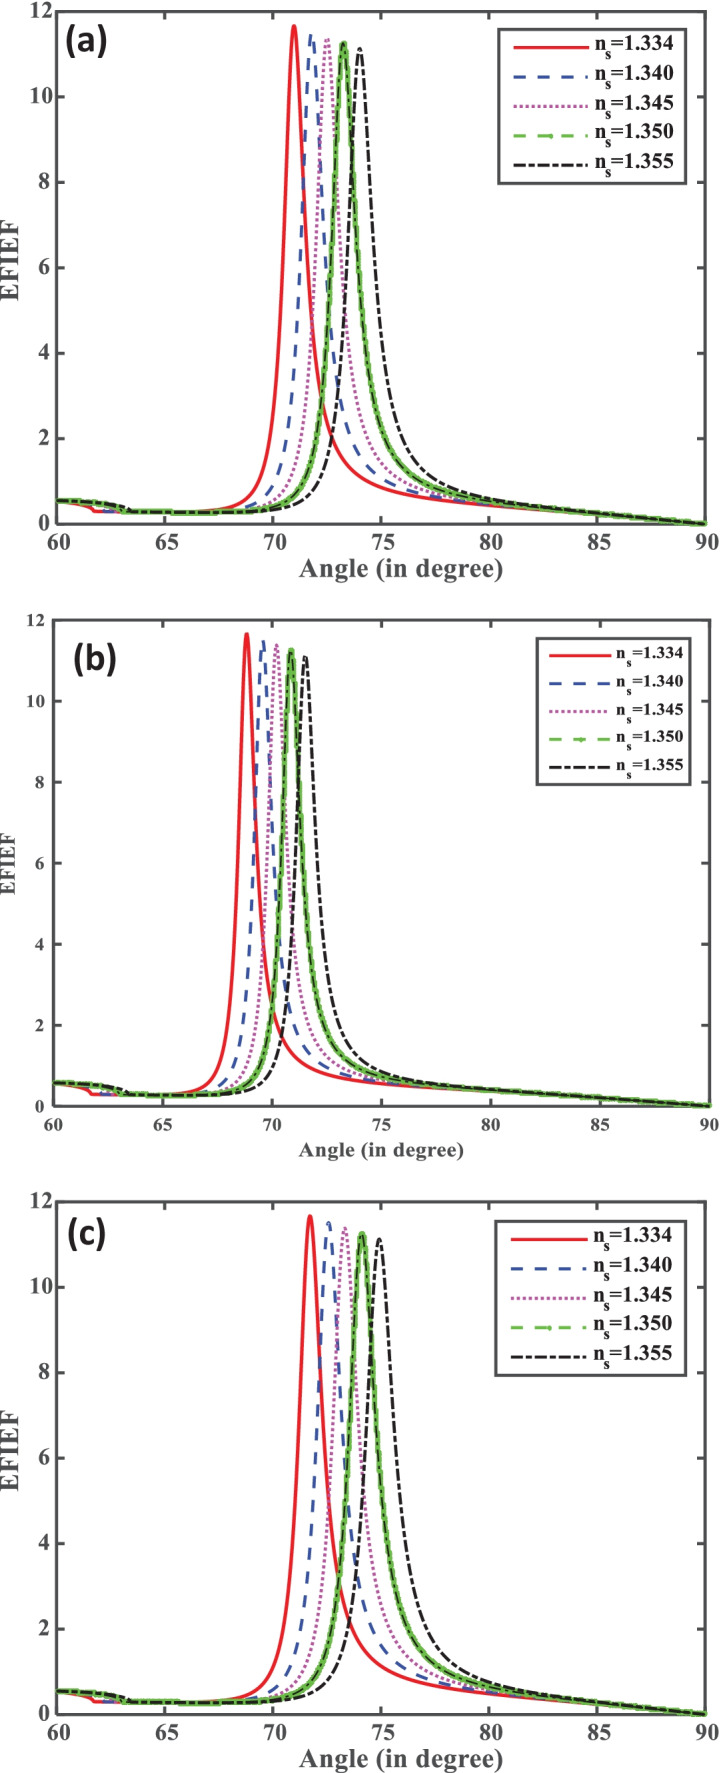
(a–c) Resonance angle (°) versus EFIEF for structures I, II, and III.
Furthermore, sensitivity is plotted with respect to the variation of thickness of ssDNA layer, i.e., surrounding materials of biosensor structures in Fig. 6a. It can be observed that the sensitivity for all the structures I, II, and III increases with increasing the thickness of ssDNA layer in Fig. 6a. It can also be observed that the sensitivity for Structure-III is higher than Structure-I and Structure-II. Figure 6b displays the detection accuracy plot with the thickness of the ssDNA layer for all the structures. We have also analyzed that the detection accuracy decreases with increasing the thickness of the ssDNA layer. Detection accuracy with thicknesses are 0, 10, 30, 40, and 50 nm of ssDNA layer. The quality parameter that is plotted with the thicknesses of ssDNA layer (3.2, 10, 20, 30, 40, and 50 nm) is illustrated in Fig. 6c, where the value of the DA and Q decreases for all the structures with an increase in the thickness of the ssDNA layer.
Fig. 6.
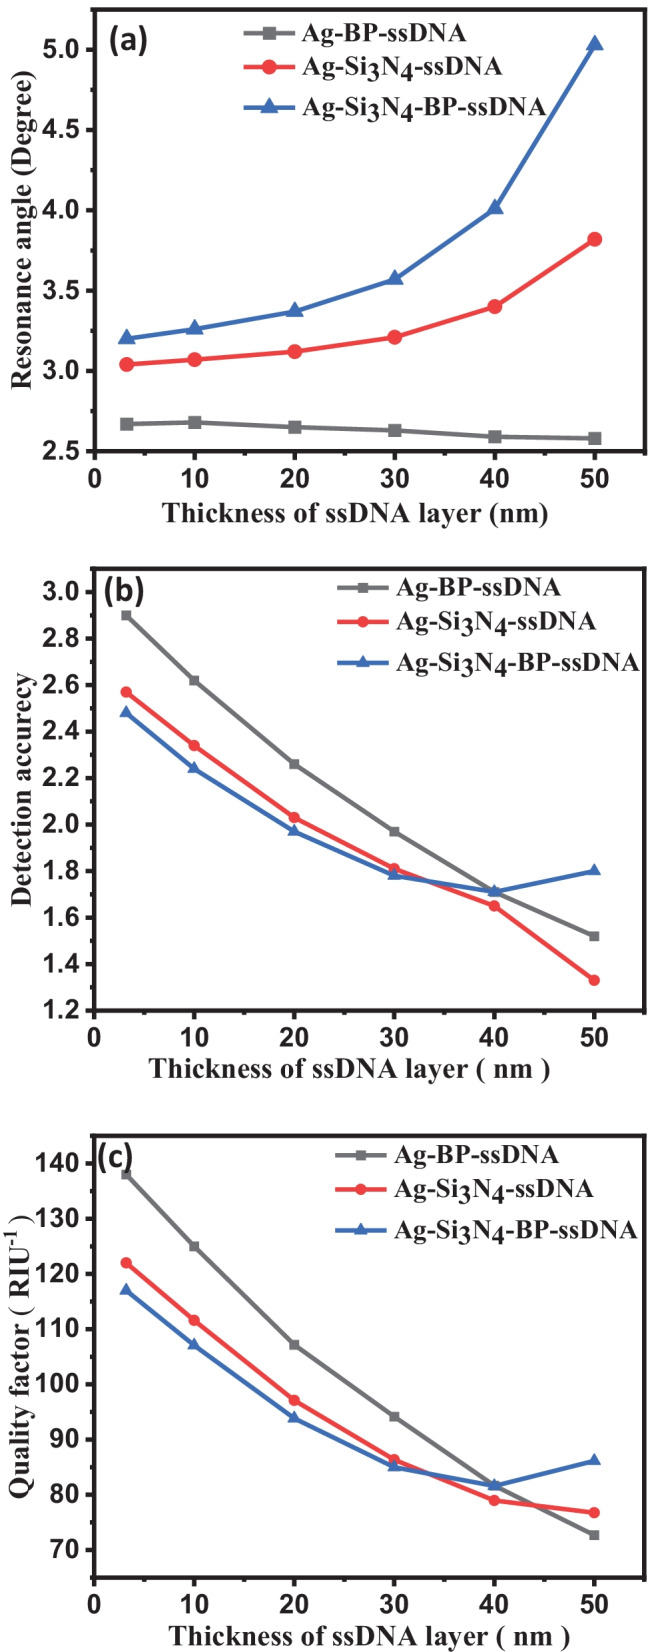
(a) Sensitivity vs. change thickness of ssDNA layer. (b) Detection accuracy vs. change thickness of ssDNA layer. (c) QF vs. change the thickness of ssDNA layer for structures I, II, and III
Figure 7 shows variation of sensitivity and detection accuracy with the BP layer for Structure-III. Figure 7 clearly depicts that as we move monolayer BP layer to seven layers, the sensitivity changes from 145.25 to 315.20°/RIU, respectively; after that, it start to decrease. Also, detection accuracy continuously decreases with BP layer from 2.48 to 1.89 as we move monolayer to eight layers of BP.
Fig. 7.
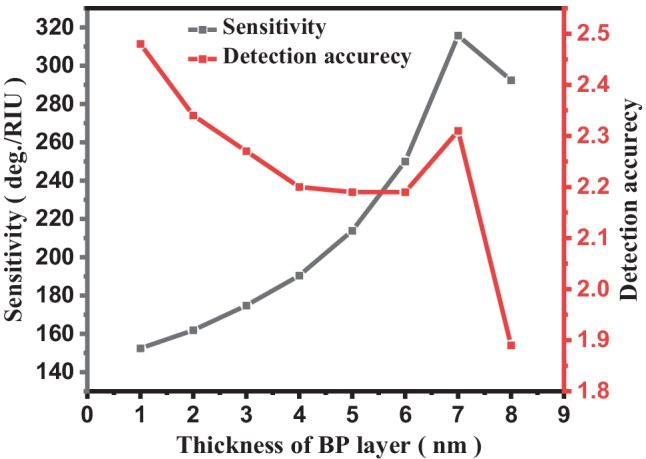
Plot number of BP layer versus sensitivity and detection accuracy
Next, in sequence, the LOD is calculated from Eq. (12) for all SPR structures proposed in Table 1. The LOD of biosensor structures I, II, and III are 3.93 × 10⁻⁵, 3.45 × 10⁻⁵, and 3.28 × 10⁻⁵, respectively, with respect to variation in RI of the sensing medium from 1.334 to 1.355. The lowest LOD is obtained for the proposed structure III due to the highest variation in resonance angle. SPR with biosensors developed in the literature to detect SARS-CoV-2 virus in terms of sensitivity, detection accuracy, quality factor, and limit of detection. The proposed biosensor shows the smallest LOD and highest sensitivity compared to other developed biosensors.
Conclusion
In this paper a detailed investigation of SPR biosensor in Kretschmann configuration using Si3N4-BP layer based for the detection of the SARS-CoV-2 virus. The BK-7 prism-Ag-Si3N4-BP-thiol ssDNA layer-coated SPR biosensor is found to have a superior sensitivity of 152°/RIU, compared to other conventional structure. The performance of the proposed biosensor is confirmed by the TMM technique. Numerically, the proposed biosensor ensures early-stage detection, reducing processing time and accurate results. Hence, the proposed sensor is expected to be implemented commercially or clinically to identify COVID-19 patients. This paper may be definitely motivation to researchers to develop highly sensitive SPR-based biosensors for detection of SARS-CoV-2.
Acknowledgements
Awadhesh Kumar conveys his thanks to CSIR New Delhi, Government of India for availing CSIR-JRF (09/013(0904)/2019-EMR-I).
Author Contribution
All authors contributed to the study conception and design. Data collection and analysis were performed by Awadhesh Kumar and Anil Kumar. The first draft of the manuscript was written by Awadhesh Kumar and all authors commented on previous versions of the manuscript. All authors read and approved the final manuscript.
Funding
Financial support was provided to S. K. Srivastava by Institute of Eminence (IoE), India.
Data Availability
The data is confidential.
Declarations
Ethics Approval
No human subject involved in this study. It is the original work and the manuscript is not currently submitted for review to any other journal, and will not be submitted elsewhere before a decision is made by this journal. So, kindly do the needful for the same.
Consent to Participate
Informed consent was obtained from all individual participants included in the study.
Consent for Publication
Not applicable.
Conflict of Interest
The authors declare no competing interests.
Footnotes
Publisher's Note
Springer Nature remains neutral with regard to jurisdictional claims in published maps and institutional affiliations.
References
- 1.Bhalla N, Pan Y, Yang Z, Payam AF. Opportunities and challenges for biosensors and nanoscale analytical tools for pandemics: COVID-19. ACS Nano. 2020;14(7):7783–7807. doi: 10.1021/acsnano.0c04421. [DOI] [PMC free article] [PubMed] [Google Scholar]
- 2.Zhou P, Yang X-L, Wang X-G, Hu B, Zhang L, Zhang W, Si H-R, Zhu Y, Li B, Huang C-L (2020) A pneumonia outbreak associated with a new coronavirus of probable bat origin. Nature 579 (7798):270–273 [DOI] [PMC free article] [PubMed]
- 3.Emami A, Javanmardi F, Akbari A, Kojuri J, Bakhtiari H, Rezaei T, Keshavarzi A, Falahati F. Survival rate in hypertensive patients with COVID-19. Clin Exp Hypertens. 2021;43(1):77–80. doi: 10.1080/10641963.2020.1812624. [DOI] [PubMed] [Google Scholar]
- 4.Guglielmi G (2020) Fast coronavirus tests: what they can and can't do. Nature 496–498 [DOI] [PubMed]
- 5.Milloy M, Wood E. Withdrawal from methadone in US prisons: cruel and unusual? The Lancet. 2015;386(9991):316–318. doi: 10.1016/S0140-6736(15)60073-3. [DOI] [PubMed] [Google Scholar]
- 6.Shanmugaraj B, Malla A, Phoolcharoen W. Emergence of novel coronavirus 2019-nCoV: need for rapid vaccine and biologics development. Pathogens. 2020;9(2):148. doi: 10.3390/pathogens9020148. [DOI] [PMC free article] [PubMed] [Google Scholar]
- 7.Astuti I. Severe Acute Respiratory Syndrome Coronavirus 2 (SARS-CoV-2): an overview of viral structure and host response. Diabetes Metab Syndr. 2020;14(4):407–412. doi: 10.1016/j.dsx.2020.04.020. [DOI] [PMC free article] [PubMed] [Google Scholar]
- 8.Lu R, Zhao X, Li J, Niu P, Yang B, Wu H, Wang W, Song H, Huang B, Zhu N. Genomic characterisation and epidemiology of 2019 novel coronavirus: implications for virus origins and receptor binding. The lancet. 2020;395(10224):565–574. doi: 10.1016/S0140-6736(20)30251-8. [DOI] [PMC free article] [PubMed] [Google Scholar]
- 9.Song Z, Xu Y, Bao L, Zhang L, Yu P, Qu Y, Zhu H, Zhao W, Han Y, Qin C (2019) From SARS to MERS, thrusting coronaviruses into the spotlight. Viruses 11 (1):59 [DOI] [PMC free article] [PubMed]
- 10.Guglielmi G. The explosion of new coronavirus tests that could help to end the pandemic. Nature. 2020;583(7817):506–510. doi: 10.1038/d41586-020-02140-8. [DOI] [PubMed] [Google Scholar]
- 11.Yuan X, Yang C, He Q, Chen J, Yu D, Li J, Zhai S, Qin Z, Du K, Chu Z. Current and perspective diagnostic techniques for COVID-19. ACS infectious diseases. 2020;6(8):1998–2016. doi: 10.1021/acsinfecdis.0c00365. [DOI] [PubMed] [Google Scholar]
- 12.Shirato K, Semba S, El-Kafrawy SA, Hassan AM, Tolah AM, Takayama I, Kageyama T, Notomi T, Kamitani W, Matsuyama S. Development of fluorescent reverse transcription loop-mediated isothermal amplification (RT-LAMP) using quenching probes for the detection of the Middle East respiratory syndrome coronavirus. J Virol Methods. 2018;258:41–48. doi: 10.1016/j.jviromet.2018.05.006. [DOI] [PMC free article] [PubMed] [Google Scholar]
- 13.Wrapp D, Wang N, Corbett KS, Goldsmith JA, Hsieh C-L, Abiona O, Graham BS, McLellan JS. Cryo-EM structure of the 2019-nCoV spike in the prefusion conformation. Science. 2020;367(6483):1260–1263. doi: 10.1126/science.abb2507. [DOI] [PMC free article] [PubMed] [Google Scholar]
- 14.Walls AC, Park Y-J, Tortorici MA, Wall A, McGuire AT, Veesler D (2020) Structure, function, and antigenicity of the SARS-CoV-2 spike glycoprotein. Cell 181(2):281–292. e286 [DOI] [PMC free article] [PubMed]
- 15.Foong SY, Liew RK, Yang Y, Cheng YW, Yek PNY, Mahari WAW, Lee XY, Han CS, Vo D-VN, Van Le Q (2020) Valorization of biomass waste to engineered activated biochar by microwave pyrolysis: progress, challenges, and future directions. Chem Eng J 389:124401
- 16.Li J, Wu D, Yu Y, Li T, Li K, Xiao M-M, Li Y, Zhang Z-Y, Zhang G-J (2021) Rapid and unamplified identification of COVID-19 with morpholino-modified graphene field-effect transistor nanosensor. Biosens Bioelectron 183:113206 [DOI] [PMC free article] [PubMed]
- 17.Iravani S. Nano-and biosensors for the detection of SARS-CoV-2: challenges and opportunities. Materials Advances. 2020;1(9):3092–3103. doi: 10.1039/D0MA00702A. [DOI] [Google Scholar]
- 18.Orooji Y, Sohrabi H, Hemmat N, Oroojalian F, Baradaran B, Mokhtarzadeh A, Mohaghegh M, Karimi-Maleh H. An overview on SARS-CoV-2 (COVID-19) and other human coronaviruses and their detection capability via amplification assay, chemical sensing, biosensing, immunosensing, and clinical assays. Nano-micro letters. 2021;13(1):1–30. doi: 10.1007/s40820-020-00533-y. [DOI] [PMC free article] [PubMed] [Google Scholar]
- 19.Prabowo BA, Wang RY, Secario MK, Ou P-T, Alom A, Liu J-J, Liu K-C. Rapid detection and quantification of Enterovirus 71 by a portable surface plasmon resonance biosensor. Biosens Bioelectron. 2017;92:186–191. doi: 10.1016/j.bios.2017.01.043. [DOI] [PubMed] [Google Scholar]
- 20.Lukose J, Chidangil S, George SD (2021) Optical technologies for the detection of viruses like COVID-19: progress and prospects. Biosens Bioelectron 113004 [DOI] [PMC free article] [PubMed]
- 21.Ahmed AM, Shaban M. Highly sensitive Au–Fe2O3–Au and Fe2O3–Au–Fe2O3 biosensors utilizing strong surface plasmon resonance. Appl Phys B. 2020;126(4):1–10. doi: 10.1007/s00340-020-7405-7. [DOI] [Google Scholar]
- 22.Bijalwan A, Rastogi V. Gold–aluminum-based surface plasmon resonance sensor with a high quality factor and figure of merit for the detection of hemoglobin. Appl Opt. 2018;57(31):9230–9237. doi: 10.1364/AO.57.009230. [DOI] [PubMed] [Google Scholar]
- 23.Peng X, Zhou Y, Nie K, Zhou F, Yuan Y, Song J, Qu J (2020) Promising near-infrared plasmonic biosensor employed for specific detection of SARS-CoV-2 and its spike glycoprotein. New J Phys 22(10):103046
- 24.Moznuzzaman M, Khan I, Islam MR (2021) Nano-layered surface plasmon resonance-based highly sensitive biosensor for virus detection: a theoretical approach to detect SARS-CoV-2. AIP Adv 11(6):065023 [DOI] [PMC free article] [PubMed]
- 25.Guo X, Cheng S, Cai W, Zhang Y, Zhang X-A (2021) A review of carbon-based thermal interface materials: mechanism, thermal measurements and thermal properties. Mater Des 109936
- 26.Shankaran DR, Gobi KV, Miura N. Recent advancements in surface plasmon resonance immunosensors for detection of small molecules of biomedical, food and environmental interest. Sens Actuators, B Chem. 2007;121(1):158–177. doi: 10.1016/j.snb.2006.09.014. [DOI] [Google Scholar]
- 27.Mo J, Xu Y, Wang X, Wei W, Zhao J. Exploiting the protein corona: coating of black phosphorus nanosheets enables macrophage polarization via calcium influx. Nanoscale. 2020;12(3):1742–1748. doi: 10.1039/C9NR08570J. [DOI] [PubMed] [Google Scholar]
- 28.Kushwaha AS, Kumar A, Kumar R, Srivastava S (2018) A study of surface plasmon resonance (SPR) based biosensor with improved sensitivity. Photon Nanostruct Fund Appl 31:99–106
- 29.Kumar D, Dwivedi A, Srivastava M, Srivastava A, Srivastava A, Srivastava S (2021) Gold nanorods modified Eu: Y2O3 dispersed PVA film as a highly sensitive plasmon-enhanced luminescence probe for excellent and fast non-enzymatic detection of H2O2 and glucose. Optik 228:166130
- 30.Zhu J, Li J-j, Zhao J-w. The study of surface plasmon resonance in Au-Ag-Au three-layered bimetallic nanoshell: the effect of separate Ag layer. Plasmonics. 2014;9(2):435–441. doi: 10.1007/s11468-013-9640-9. [DOI] [Google Scholar]
- 31.Kumar A, Yadav AK, Kushwaha AS, Srivastava S (2020) A comparative study among WS2, MoS2 and graphene based surface plasmon resonance (SPR) sensor. Sensors and Actuators Reports 2(1):100015
- 32.Blázquez O, López-Vidrier J, Hernández S, Montserrat J, Garrido B. Electro-optical properties of non-stoichiometric silicon nitride films for photovoltaic applications. Energy Procedia. 2014;44:145–150. doi: 10.1016/j.egypro.2013.12.021. [DOI] [Google Scholar]
- 33.Mudgal N, Saharia A, Choure KK, Agarwal A, Singh G. Sensitivity enhancement with anti-reflection coating of silicon nitride (Si 3 N 4) layer in silver-based Surface Plasmon Resonance (SPR) sensor for sensing of DNA hybridization. Appl Phys A. 2020;126(12):1–8. doi: 10.1007/s00339-020-04126-9. [DOI] [Google Scholar]
- 34.Shang J, Ye G, Shi K, Wan Y, Luo C, Aihara H, Geng Q, Auerbach A, Li F. Structural basis of receptor recognition by SARS-CoV-2. Nature. 2020;581(7807):221–224. doi: 10.1038/s41586-020-2179-y. [DOI] [PMC free article] [PubMed] [Google Scholar]
- 35.Qiu G, Gai Z, Tao Y, Schmitt J, Kullak-Ublick GA, Wang J. Dual-functional plasmonic photothermal biosensors for highly accurate severe acute respiratory syndrome coronavirus 2 detection. ACS Nano. 2020;14(5):5268–5277. doi: 10.1021/acsnano.0c02439. [DOI] [PubMed] [Google Scholar]
- 36.Alafeef M, Dighe K, Moitra P, Pan D. Rapid, ultrasensitive, and quantitative detection of SARS-CoV-2 using antisense oligonucleotides directed electrochemical biosensor chip. ACS Nano. 2020;14(12):17028–17045. doi: 10.1021/acsnano.0c06392. [DOI] [PMC free article] [PubMed] [Google Scholar]
- 37.Gray D, Case-Green S, Fell T, Dobson P, Southern E. Ellipsometric and interferometric characterization of DNA probes immobilized on a combinatorial array. Langmuir. 1997;13(10):2833–2842. doi: 10.1021/la962139m. [DOI] [Google Scholar]
- 38.Lu Z, Li CM, Zhou Q, Bao Q-L, Cui X. Covalently linked DNA/protein multilayered film for controlled DNA release. J Colloid Interface Sci. 2007;314(1):80–88. doi: 10.1016/j.jcis.2007.05.018. [DOI] [PubMed] [Google Scholar]
- 39.Kowalczyk SW, Tuijtel MW, Donkers SP, Dekker C. Unraveling single-stranded DNA in a solid-state nanopore. Nano Lett. 2010;10(4):1414–1420. doi: 10.1021/nl100271c. [DOI] [PubMed] [Google Scholar]
- 40.Chong X, Liu L, Liu Z, Ma S, Guo J, Ji Y, He Y. Detect the hybridization of single-stranded DNA by parallel scan spectral surface plasmon resonance imaging. Plasmonics. 2013;8(2):1185–1191. doi: 10.1007/s11468-013-9530-1. [DOI] [Google Scholar]
- 41.Qu G, Xia T, Zhou W, Zhang X, Zhang H, Hu L, Shi J, Yu X-F, Jiang G. Property–activity relationship of black phosphorus at the nano–bio interface: from molecules to organisms. Chem Rev. 2020;120(4):2288–2346. doi: 10.1021/acs.chemrev.9b00445. [DOI] [PubMed] [Google Scholar]
- 42.Schreiber B, Wacinski C, Chiarello R (2013) Index of refraction as a quality control metric for liquids in pharmaceutical manufacturing. Pharm Eng
- 43.Zeng S, Hu S, Xia J, Anderson T, Dinh X-Q, Meng X-M, Coquet P, Yong K-T. Graphene–MoS2 hybrid nanostructures enhanced surface plasmon resonance biosensors. Sens Actuators, B Chem. 2015;207:801–810. doi: 10.1016/j.snb.2014.10.124. [DOI] [Google Scholar]
- 44.Luke K, Okawachi Y, Lamont MR, Gaeta AL, Lipson M. Broadband mid-infrared frequency comb generation in a Si 3 N 4 microresonator. Opt Lett. 2015;40(21):4823–4826. doi: 10.1364/OL.40.004823. [DOI] [PubMed] [Google Scholar]
- 45.Pal S, Prajapati YK, Saini J. Influence of graphene’s chemical potential on SPR biosensor using ZnO for DNA hybridization. Opt Rev. 2020;27(1):57–64. doi: 10.1007/s10043-019-00564-w. [DOI] [Google Scholar]
- 46.Balaji V (2021) Theoretical analysis of tuning and sensitivity improvement of surface plasmon resonance biosensor employing heterostructures of titanium disilicide and graphene
- 47.Wu L, Chu H, Koh W, Li E (2010) Highly sensitive graphene biosensors based on surface plasmon resonance. Opt Exp 18(14):14,395–14,400 [DOI] [PubMed]
Associated Data
This section collects any data citations, data availability statements, or supplementary materials included in this article.
Data Availability Statement
The data is confidential.


