

Abstract
PURPOSE:
To estimate the value of cancer care and to compare value among episodes of care, a transparent, reproducible, and standardized cost computation methodology is needed. Charges, claims, and reimbursements are related to cost but are nontransparent and proprietary. We developed a method to measure the cost of the following phases of care: (1) initial treatment with curative intent, (2) surveillance and survivorship care, and (3) relapse and end-of-life care.
METHODS:
We combined clinical data from our electronic health record, the state cancer registry, and the Social Security Death Index. We analyzed the care of patients with breast cancer and mapped Common Procedural Terminology (CPT) codes to the corresponding cost conversion factor and date in the CMS Medicare fee schedule. To account for varying duration of episodes of care, we computed a cost of care per day (CCPD) for each patient.
RESULTS:
Median CCPD for initial treatment was $29.45 in US dollars (USD), the CCPD for surveillance and survivorship care was $2.45 USD, and the CCPD for relapse care was $13.80 USD. Among the three breast cancer types (hormone receptor-positive or human epidermal growth factor receptor 2 [HER2]-negative, HER2-positive, and triple-negative), there was no difference in CCPD. Relapsed patients in the most expensive surveillance CCPD group had significantly shorter survival.
CONCLUSION:
We developed a method to identify high-value oncology care—cost of care per patient per day (CCPD)—in episodes of initial, survivorship, and relapse care. The methodology can help identify positive deviants (who have developed best practices) delivering high-value care. Merging our data with claims data from third-party payers can increase the accuracy and validity of the CCPD.
INTRODUCTION
Determining the value of cancer care requires cost computation.1 Cost data are often considered proprietary, a trade secret, are not readily available to researchers, and are inpatient focused.2 Furthermore, there is variation in cancer care provided to patients—variation that is unnecessary and does not translate into better patient outcomes.3,4 To identify low-value and high-value care and to reduce unnecessary variation, accurate data on cost are necessary. We propose a method to compare costs across health care systems, physician practices, and institutions.
Cost, charges, price, claims submitted, and claims paid are all related concepts but are very different in their meaning. Cost, charges, and prices are closely held and not available to health service researchers, are not calculated using standard or transparent methods, and use poorly described methods and inputs. Third-party and insurance claims and claims-paid are governed by payer-specific insurance contracts, are considered trade secrets, and vary depending on the payer. This opaque web of discounts and rebates is not uniform and is difficult to reliably use for cost and value comparison.
In chronic disease states such as cancer, the varying periods of time patients spend in intense treatment, in surveillance and survivorship, and in the relapse and in the end-of-life phase of care, all contribute to the difficulty in measuring cost and value. Patients may change insurers during a course of treatment, which further complicates cost estimates based on insurance claims and charges.
The physician fee schedule determined by the Medicare program has several advantages compared with the use of hospital charges or cost estimates. The fee schedule is publicly available and has geographic and yearly adjustments. Although it may have little relationship to the actual costs of providing care, the rate setting and modification process are well understood and governed by statutes and regulations. The Medicare claims database has been linked to a longitudinally maintained population sample maintained by the Surveillance, Epidemiology, and End Results program of the National Cancer Institute.5 The Medicare-SEER linkage has been widely used for cost-of-care studies. Thus, there is precedent for use of Medicare-determined costs to explore unnecessary variation in care patterns.3,6,7
In our work to identify positive deviants that deliver high-value oncology care, we used charges reimbursed by third-party health insurance carriers.8 It is useful when claims and charge data are available, but obtaining accurate, reliable, and consistent data across systems and providers is difficult. We developed a broadly applicable, transparent methodology anchored by the Medicare physician fee schedule as a reproducible, publicly available surrogate for costs which can avoid the disclosure of proprietary information and help identify unnecessary variation in care provided to patients. By holding cost constant, our methodology can help explore the variation in treatment approaches across systems and pick the winner—in terms of value—among the different treatment approaches. We choose breast cancer as a common and important problem as an example.6
METHODS
To develop a methodology useful in calculating and comparing the cost of care, we used the Oncoshare breast cancer database.9 Oncoshare aggregates data from Stanford HealthCare's (SHC) electronic health record (EHR) for inpatient and outpatient care (including imaging, infused drugs, inpatient and outpatient facility, and professional charges), patient-level data from the California Cancer Registry (CCR), and Social Security Death Index data. We analyzed female patients with breast cancer diagnosed between 2000 2014, who underwent surgery, chemotherapy, or radiation treatment at SHC through November 1, 2016, and who had more than two follow-up visits at SHC within 3 years of their diagnosis. To capture the most data on relapse-free survivorship, we included only stage 0-III breast cancer. We defined three phases of cancer care: initial (which includes the procedures surrounding diagnosis), survivorship, and relapse and end-of-life care.
To associate dates with the beginning and ending of an episode of care, we first used the date of initial diagnosis as defined by the cancer registry. The initial treatment phase started 30 days before the date of initial cancer diagnosis and extended to 29 days after the completion of the initial surgery, intravenous chemotherapy, or radiation therapy, whichever occurred last. For surgery, we assumed the date associated with the code for the primary breast operation (usually either lumpectomy or mastectomy; if an axillary lymph node dissection was performed as a separate procedure, we used that code and associated date). For radiation therapy and chemotherapy, we used the last date for each procedure. Survivorship started the day after the conclusion of initial therapy and ended at the date of relapse, the date of last follow-up without relapse, or at death (whichever occurred first). In the rare event that a patient relapsed during initial treatment, that patient moved into the relapse cohort. Relapse date was computed using a natural language processing method that enables identification of the occurrence and timing of metastatic breast cancer recurrence from unstructured EHR notes, which predicts timing of distant metastatic recurrence with a sensitivity of 0.83 and a specificity of 0.73.10 The relapse and end-of-life episode started with the relapse date and concluded at date of death or the date of last follow-up, whichever was later.
To explore the procedures contributing to cost during each episode, we grouped the Common Procedural Terminology (CPT) (AMA, Chicago, IL) codes into thirteen bins. The bins included services related to chemotherapy, surgery (including anesthesia evaluation and treatment), radiation therapy, imaging, and laboratory services (including cardiology, tumor markers, laboratory, and anatomic pathology). Other bins included fertility-related services and physical therapy. We included inpatient technical services, inpatient evaluation and management services, and outpatient evaluation and management services as three separate bins. A miscellaneous bin-incorporated CPT codes not included elsewhere.
We used cost data from the Medicare physician fee schedule to normalize the cost of care during episodes of varying duration. Using this widely available cost anchor obviates the need for definition of cost across varying health care systems, sites of service, and other nonuniform methodologies. We computed the cost associated with each patient’s visit or service from each CPT code’s conversion factor (in US dollars [USD]) and year of service from the physician fee schedule.11 Finally, we computed the cost of care per patient per day (CCPD, in USD) by summing each patient’s total cost and dividing this sum by the number of days of each interval’s duration. The CCPD day was summed from each patient and divided by the number of patients included in each episode of care. We chose to express time in days (rather than months or years) to account for the variation in follow-up time experienced by individual patients at the most granular level possible.
We used the clinical data available in Oncoshare to divide patients into groups based on the phenotype of their breast cancer: hormone receptor-positive or human epidermal growth factor receptor 2 (HER2)-negative (defined as estrogen receptor [ER]-positive or progesterone receptor [PR]-positive and HER2-negative), HER2-positive (regardless of ER or PR), and triple-negative (not expressing either ER or PR and also not overexpressing HER2). Estimates of survival for each group were computed using the Kaplan-Meier method.
To test the hypothesis that intensive surveillance could improve survival, we divided the analytic cohort into high-cost and low-cost groups. In the first analysis, we divided the analytic cohort using a median threshold. High-cost patients were defined as those with that median cost per day above the median, and low-cost patients as cost per day at or below the median. We also used an 80-20 threshold. With the 80-20 definition, the high-cost group was patients above the 80th percentile of cost, and the low-cost group was patients at or below the 80th percentile in the cost of surveillance care. We computed Kaplan-Meier curves for each breast cancer subtype. All research was approved by University Institutional Review Boards and the State of California Institutional Review Board (for the use of CCR data).
RESULTS
A total of 11,764 patients with breast cancer were treated at SHC from 2000 to 2014. After exclusions of those who did not meet study eligibility criteria, 6,415 patients were assigned to the initial treatment cohort (Appendix Fig A1, online only). Seven hundred sixty-six patients were assigned to the relapse and end-of-life cohort, and 5,649 patients remained in the survivorship cohort.
For initial treatment, the median cost was $29.45 USD per patient per day (Fig 1A). The highest cost services were radiation therapy, followed by surgery, diagnostic imaging, and chemotherapy. For survivorship, the median cost was $2.48 USD per day (Fig 1B). The highest median cost services were imaging, outpatient evaluation and management services, and surgery. For care during breast cancer relapse, the median cost was $13.80 USD per day (Fig 1C). The highest cost services were imaging, outpatient evaluation and management, and radiation therapy. The average total cost per patient in the initial treatment phase is $10,902 USD (median $5,865 USD), and the average duration of initial treatment is 316 days (median 240). For surveillance and survivorship, the average total cost is $5,542 USD (median $3,118 USD), and the average duration is 1,801 (median 1,452) days. For the relapse and end-of-life care, the average cost is $17,162 USD (median $10,088 USD), and the average duration is 1,208 (median 786) days.
FIG 1.

Cost per patient per day during (A) initial treatment, (B) surveillance survivorship, (C) relapse and end of life. Median CCPD in US dollars for each service bin is shown on the vertical axis. Patients receiving each service are shown on the horizontal axis, and the percentages of all patients who received the service are shown. Interquartile and maximum range are shown. Medians do not sum to total as not all patients received every service. CCPD, cost of care per patient per day; CHEMO, chemotherapy; INPAT_EM, physician evaluation and management services delivered during an inpatient stay; OUTPAT_EM, physician evaluation and management services delivered to outpatients; INPT, inpatient bed cost; LAB, clinical laboratory; MISC, services not otherwise assigned; PT, physical therapy; XRT, radiation therapy technical cost.
We addressed the relationship between surveillance intensity and survival by examining high-cost surveillance cohorts. When dividing the cohort at the median cost, we found no survival difference between the two groups (Fig 2A). When we examined the cost of the top 20% of patients, there was a significant difference in survival, with the high-cost patients having poorer survival, in each breast cancer subtype, compared with the low-cost patients (Fig 2B). Among the three clinically defined breast cancer subtypes (hormone receptor-positive or HER2-negative, HER2-positive, and triple-negative), there was no difference in surveillance cost. The high surveillance-cost patients had more comorbidity (cerebrovascular disease [4% for low-cost v 7% for high-cost], chronic pulmonary disease [5% v 10%], congestive heart failure [2% v 7%], diabetes [4% v 7%], and liver disease [4% v 9%]). The distributions of the surveillance survivorship costs of patients currently in follow-up, who died, who were lost to follow-up, and who relapsed and are currently in treatment are shown in Figure 3.
FIG 2.

(A) Survival of patients during surveillance, dividing the cohort into patients with costs at the 50th percentile. Kaplan-Meier survival of patients on the basis of phenotype: triple-negative, luminal (ER-positive or PR-positive and HER2-negative), and HER2-positive. The vertical axis is percent surviving, and the horizontal axis is the time in years since diagnosis. The number at risk at the beginning of each year is shown in the bottom box. Blue curves represent patients below the 50th percentile in CCPD, and red curves represent patients in the top 50th percentile of CCPD. (B) Survival of patients during surveillance, dividing the cohort into patients with the 20% highest cost and the remaining patients who had costs below the 80th percentile. Kaplan-Meier survival of patients on the basis of phenotype: triple-negative, luminal (ER-positive or PR-positive and HER2-negative), and HER2-positive. The vertical axis is percent surviving, and the horizontal axis is the time in years since diagnosis. The number at risk at the beginning of each year is shown in the bottom box. Blue curves represent patients at or below the 80th percentile in cost of care per patient per day, and red curves represent patients in the top 20 percentile of CCPS. High-cost patients (ie, top 20 percentile) had more comorbidities. CCPD, cost of care per patient per day; ER, estrogen receptor; HER2, human epidermal growth factor receptor 2; PR, progesterone receptor.
FIG 3.
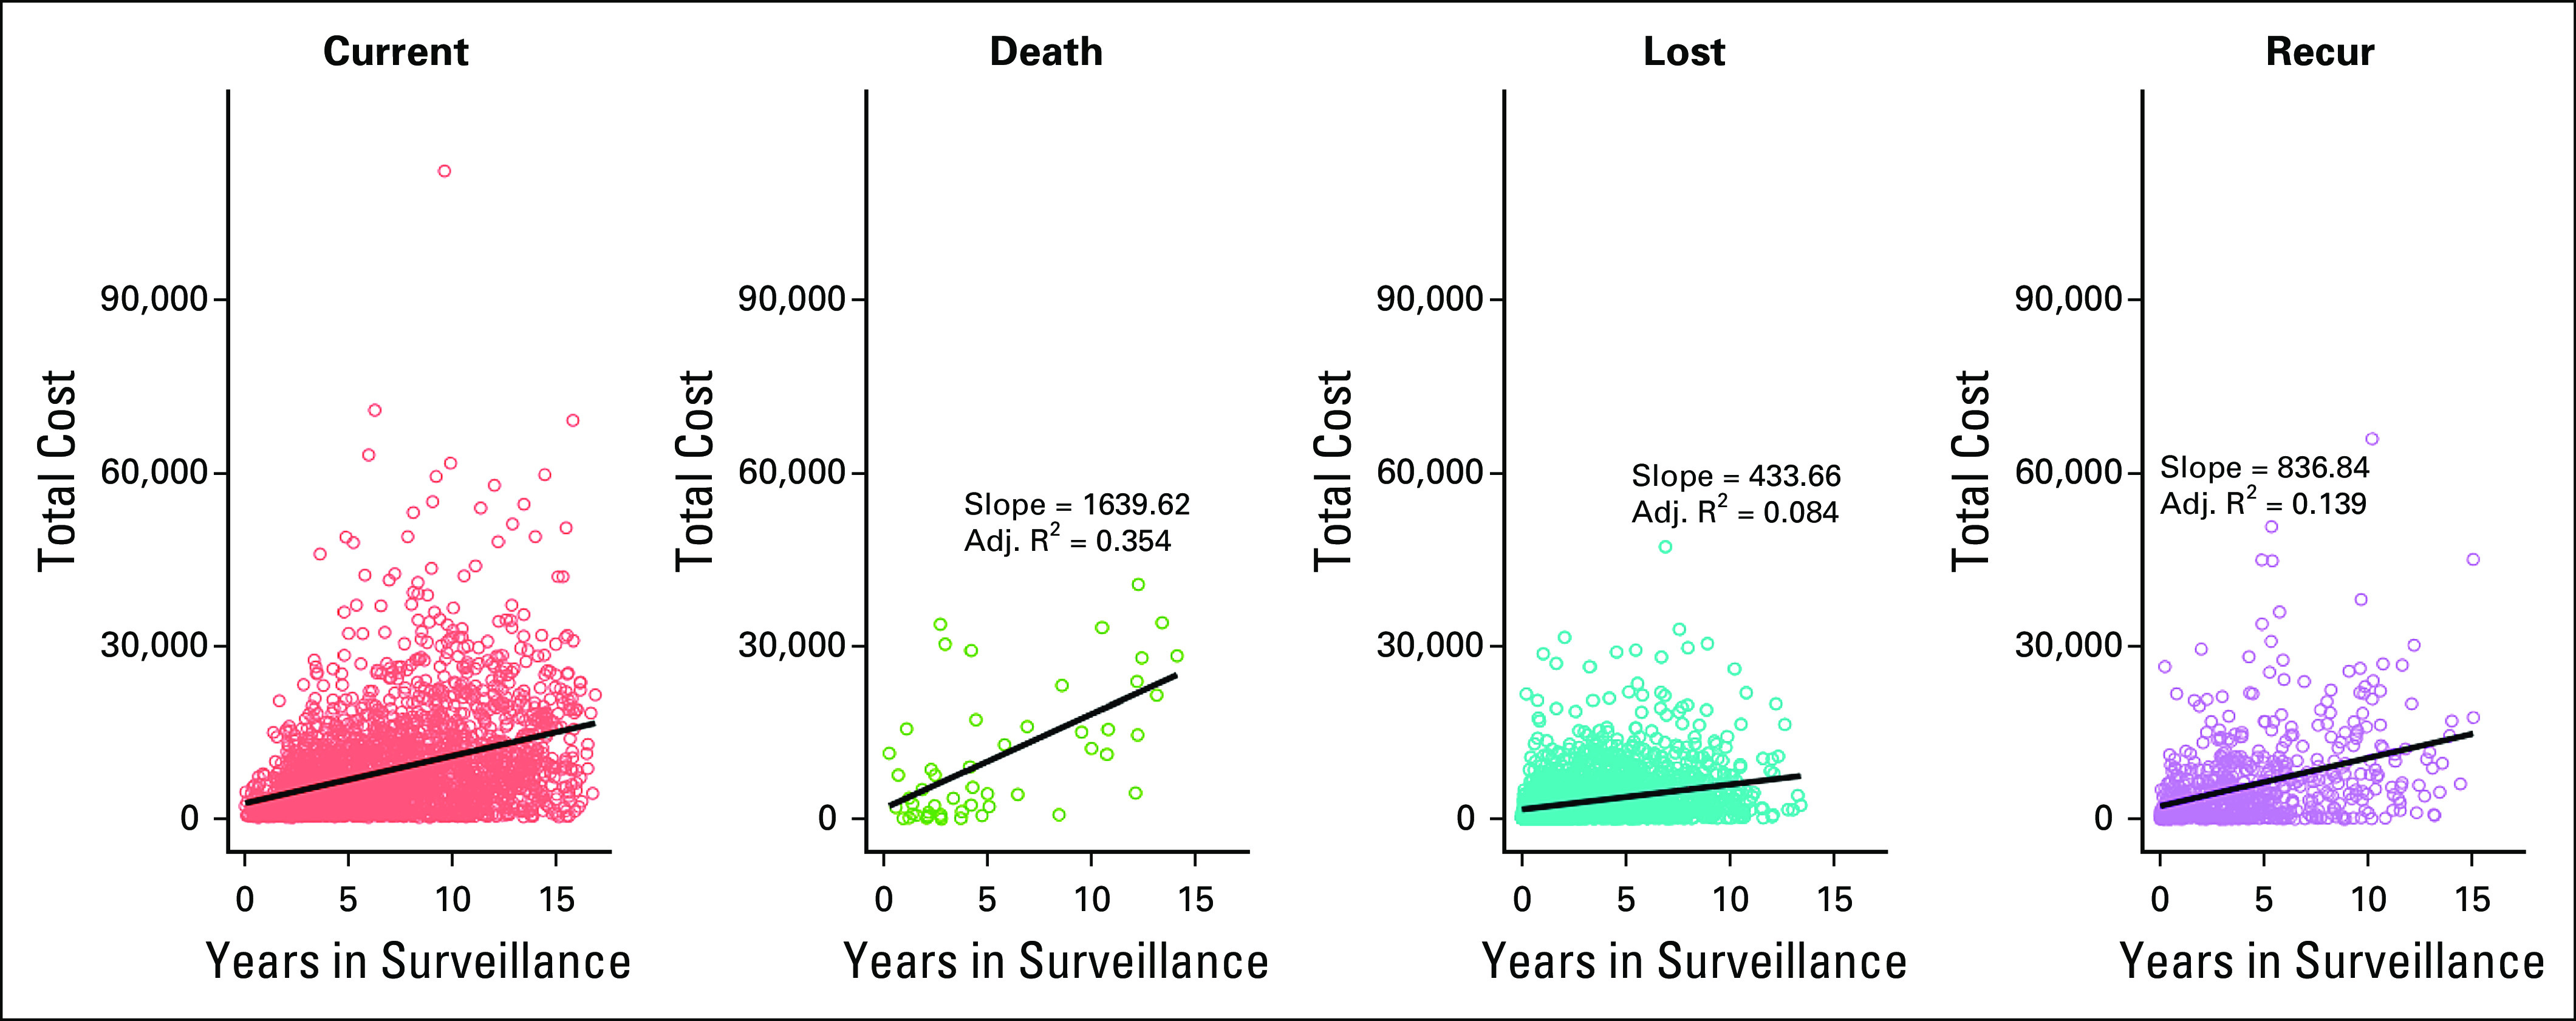
Cost of survivorship care for four cohorts. The total cost of care in dollars is plotted on the ordinate (y axis) and the duration of follow-up on the abscissa (x axis) where each dot represents one patient. Orange panel represents patients currently in follow-up, green panel represents patients who died, teal panel represents patients lost to follow-up, and purple panel represents patients who experienced disease recurrence. The slope of the line represents costs per year, which can be converted into CCPD with division by 365. CCPD, cost of care per patient per day.
In conclusion, we developed the CCPD methodology as a result of our positive deviants research. Our positive deviants deliver high-value care in comparison with comparable organizations. In addition to our positive deviant work in cancer,8 our group also studied primary care12 and nephrology.13 In each study, cost data from collaborating third-party insurance carriers were used. We developed the normalized CCPD methodology as a generalizable method to facilitate cross-system cost and value comparisons, which is transparent, reproducible, and anchored to publicly available cost data. Our method also groups costs into service bins, such as imaging, surgery, chemotherapy, which provide insight into the most costly services and allow service-specific value measurement.
We present the results of the three stages of breast cancer care—initial, surveillance and survivorship, and relapse and end of life—as illustrations of the method’s use. Our method could also be used by health system leaders to estimate the costs and price of an episode of oncology care. The current fragmented approach, centering on departments or cost centers, does not facilitate a holistic, longitudinal, patient-centered approach. The CCPD method can help practice, and health system leaders develop evidence-based programs to influence system behavior.
The CCPD methodology accounts for the varying durations of an episode of care and allows for analysis of the intensity of services and their relation to outcome. In our breast cancer example, each episode of care had a different cost, and each episode had service bins—radiation, imaging, surgery, etc—which were high cost during each type of episode. Each patient had different episode duration (Fig 3). The duration was determined by the clinical treatment team on the basis of the patient’s condition, rather than an arbitrary length of time. When we investigated the intensity of services and outcome relationship, we found results supporting one of ASCO's Choosing Wisely recommendations: “Don't perform surveillance testing (biomarkers) or imaging (PET, CT and radionuclide bone scans) for asymptomatic individuals who have been treated for breast cancer with curative intent.”14 We did not detect a survival benefit in breast cancer survivors who had more expensive survivorship and surveillance care.
The CCPD measure is a useful tool for cross-system cost comparison as it accommodates varying sites of service and clinical organizations, including combinations of community physicians, hospitals, clinical laboratory, and home care providers. We showed that it is possible to take data from multiple sources and health care systems and estimate a normalized cost across systems. The CCPD methodology can be applied to aggregated health insurance claims, analyzed, and compared without revelation of proprietary contractual terms or payment allowances. Producing an actionable, total cost of an episode of care was our goal. Attribution of the claim to breast cancer, its treatment, a complication of the treatment, or to some unrelated condition is not part of our methodology.
LIMITATIONS
Our method has several limitations, including underestimation of the total costs. In this development stage, we captured care delivered only within the Stanford Health Care (SHC) system. We estimate that approximately one third of unplanned cancer care is not captured in our EHR and the remainder at other local, regional, or national sites of service.15 The potential underestimate is also likely to be greater during the surveillance and survivorship episode of care, when the treatment is not as intense, and for patients who live far from an SHC facility, as these patients may seek care closer to their homes. We also note the number of surgeries during survivorship (Fig 1B), most of which were related to initiation or completion of breast reconstruction.
Our methodology for computing the episode of care cost overcomes the limitations of many prior approaches: our method is transparent, as it is anchored in the publicly available Medicare fee schedule; does not rely on charges or amounts paid, which are often arbitrary, difficult to calculate, or proprietary; and is reproducible across different geographic or health system settings. Most health care systems and provider entities have a general or precise understanding of how their costs of providing services relate to Medicare reimbursement. In many systems, the cost is 1.5-4 times the Medicare reimbursement. System leadership may not wish to share these precise figures. Our method can help keep these figures confidential but still allow cost reduction or value improvement efforts. Furthermore, our method is more transparent than the commercially available data sets (such as Vizient,16 OptumLabs,17 TruVen MarketScan,18 and others), which must be purchased and in which the cost allocations are also opaque and arbitrary.
The CCPD for relapsed patients with breast cancer may be an underestimate and is likely different for relapse care for other solid tumors. Many analyzed patients were ER-positive and received oral endocrine therapies (the costs of which we could not capture). Furthermore, our observation period was before the introduction and widespread adoption of many expensive oral therapies (eg, CDK4/6 inhibitors and PI3Kinase inhibitors) and the widespread adoption of expensive anti-HER2 dual antibody treatment.
We acknowledge that Medicare fee schedule costs may not reliably reflect actual costs or charges, including patient out-of-pocket costs, contractual allowances, or payer-specific contracted reimbursement, but our method will prove useful in cross-system comparisons. The components of an episode of care change over time as new technology is deployed, obsolete technology and service are abandoned, and competition lowers costs. Although the Medicare fee schedule is updated yearly, it may not accurately reflect inflationary effects. An approach to this problem is to complete the CCPD per year and then adjust each year for inflation relative to a base year. This accounts for price inflation and also for inflation because of additional services included in the episode of care. Finally, we note that our method can be used to study changing costs and care patterns over time and is not a method to determine appropriate reimbursement for physician or other services.
Next Steps
The CCPD builds upon techniques developed in the Medicare-SEER database and extends the methodology to non-Medicare age patients and to non-Medicare payers. We are employing our methodology to study cancer care value in neuroendocrine tumors, in prostate cancer, and across systems in breast cancer.19,20 We acknowledge that the fee schedule may not accurately reflect actual costs and charges and often bundles payments together with one charge, but the fee schedule has the advantage of being publicly available, updated yearly, and includes a cost adjustment for both geographic regions.
Using the CCPD methodology to combine third-party claims data, disseminating the results to clinicians, health systems and quality improvement organizations can drive interventions to lower total spending for high-quality oncology care as has been done in Michigan and western Washington state.21,22
In pandemic times, when a goal is to minimize patient touches to the health care system for patient and clinician safety, our method can provide guidance. The mean or median number of individual CPT codes per patient, the number of days on which a CPT code is generated (as a measure of the intensity of services), or touches to the health care system are adaptations of the CCPD method, which we could use to allocate resources, counsel patients, and identify best practices.
We developed and tested a methodology that can facilitate the comparison of costs across health systems without disclosure of proprietary information and facilitates discussion of the value of care provided. Large clinical data sets are available for analysis after the recent wave of clinician EHR adoption and health system provider consolidation.23 These consolidated systems are likely to view the intellectual property their physicians and other clinicians have created by their data entry during clinical encounters as proprietary and will continue to hold the clinical and cost data closely. Our CCPD method can partially shield proprietary data from competitors while assisting physicians and other clinicians examining the data. With appropriate privacy provisions, our method can be applied to local or regional patient-identifiable data. Combining our clinical and cancer registry data with third-party claims data should increase the accuracy and validity of the CCPD and can measure interventions to lower total spending for high-quality oncology care.
Appendix
FIG A1.

Description of the patient cohort, extracted from Stanford HealthCare Electronic Health Record, and who were assigned to the initial treatment, relapse/end-of-life, and survivor surveillance cohorts.
Douglas W. Blayney
Leadership: Artelo Biosciences
Stock and Other Ownership Interests: Artelo Biosciences, Madorra
Consulting or Advisory Role: Daiichi Sankyo, Embold Health, Lilly, Google, Ipsen
Research Funding: Amgen, Creare, BeyondSpring Pharmaceuticals
Open Payments Link: https://openpaymentsdata.cms.gov/physician/728442
Nhat Hoang
Stock and Other Ownership Interests: Johnson & Johnson/Janssen
Craig Lindquist
Stock and Other Ownership Interests: Merck
Allison W. Kurian
Research Funding: Myriad Genetics
Other Relationship: Ambry Genetics, Color Genomics, GeneDx/BioReference, InVitae, Genentech
No other potential conflicts of interest were reported.
DISCLAIMER
The ideas and opinions expressed herein are those of the author(s) and do not necessarily reflect the opinions of the State of California, Department of Public Health, the National Cancer Institute, and the Centers for Disease Control and Prevention or their Contractors and Subcontractors.
PRIOR PRESENTATION
Presented at the ASCO Cancer Survivorship Symposium, Orlando, FL, February 16-17, 2018.
SUPPORT
Supported by the Clinical Improvement Fund of the Stanford Cancer Institute; the Breast Cancer Research Foundation; the Susan and Richard Levy Gift Fund; the Suzanne Pride Bryan Fund for Breast Cancer Research; the Jan Weimer Junior Faculty Chair in Breast Oncology; the Regents of the University of California’s California Breast Cancer Research Program (16OB-0149 and 19IB-0124); and the BRCA Foundation.
The collection of cancer incidence data used in this study was supported by the California Department of Public Health pursuant to California Health and Safety Code Section 103885; Centers for Disease Control and Prevention’s (CDC) National Program of Cancer Registries, under cooperative agreement 5NU58DP006344; the National Cancer Institute’s Surveillance, Epidemiology and End Results Program under contract HHSN261201800032I awarded to the University of California, San Francisco, contract HHSN261201800015I awarded to the University of Southern California, and contract HHSN261201800009I awarded to the Public Health Institute, Cancer Registry of Greater California.
AUTHOR CONTRIBUTIONS
Conception and design: Douglas W. Blayney, Nhat Hoang, Craig Lindquist
Financial support: Douglas W. Blayney, Allison W. Kurian
Provision of study materials or patients: Allison W. Kurian
Collection and assembly of data: All authors
Data analysis and interpretation: Douglas W. Blayney, Nhat Hoang, Craig Lindquist, Allison W. Kurian
Manuscript writing: All authors
Final approval of manuscript: All authors
Accountable for all aspects of the work: All authors
AUTHORS' DISCLOSURES OF POTENTIAL CONFLICTS OF INTEREST
Benchmark Method for Cost Computations Across Health Care Systems: Cost of Care per Patient per Day in Breast Cancer Care
The following represents disclosure information provided by authors of this manuscript. All relationships are considered compensated unless otherwise noted. Relationships are self-held unless noted. I = Immediate Family Member, Inst = My Institution. Relationships may not relate to the subject matter of this manuscript. For more information about ASCO's conflict of interest policy, please refer to www.asco.org/rwc or ascopubs.org/op/authors/author-center.
Open Payments is a public database containing information reported by companies about payments made to US-licensed physicians (Open Payments).
Douglas W. Blayney
Leadership: Artelo Biosciences
Stock and Other Ownership Interests: Artelo Biosciences, Madorra
Consulting or Advisory Role: Daiichi Sankyo, Embold Health, Lilly, Google, Ipsen
Research Funding: Amgen, Creare, BeyondSpring Pharmaceuticals
Open Payments Link: https://openpaymentsdata.cms.gov/physician/728442
Nhat Hoang
Stock and Other Ownership Interests: Johnson & Johnson/Janssen
Craig Lindquist
Stock and Other Ownership Interests: Merck
Allison W. Kurian
Research Funding: Myriad Genetics
Other Relationship: Ambry Genetics, Color Genomics, GeneDx/BioReference, InVitae, Genentech
No other potential conflicts of interest were reported.
REFERENCES
- 1.Porter ME.What is value in health care? N Engl J Med 3632477–24812010 [DOI] [PubMed] [Google Scholar]
- 2. Morse D, Pendleton D, C4QI Understanding the landscape and challenges of end-of-life measurement among comprehensive cancer centers. J Clin Oncol. 2017;35 suppl; abstr 207. [Google Scholar]
- 3.Brooks GA, Li L, Sharma DB, et al. Regional variation in spending and survival for older adults with advanced cancer J Natl Cancer Inst 105634–6422013 [DOI] [PMC free article] [PubMed] [Google Scholar]
- 4.Levit L, Balogh E, Nass S, et al., editors. Delivering High-Quality Cancer Care: Charting a New Course for a System in Crisis. Washington, DC: National Academies Press; 2013. [PubMed] [Google Scholar]
- 5.Enewold L, Parsons H, Zhao L, et al. Updated overview of the SEER-Medicare data: Enhanced content and applications JNCI Monogr 20203–132020 [DOI] [PMC free article] [PubMed] [Google Scholar]
- 6.Hassett MJ, Banegas M, Uno H, et al. Spending for advanced cancer diagnoses: Comparing recurrent versus de novo stage IV disease J Oncol Pract 15e616–e6272019 [DOI] [PMC free article] [PubMed] [Google Scholar]
- 7.Yip AY, Chow LW.Clinical experience with docetaxel for Chinese breast cancer patients: Hematological toxicity profiles Breast Cancer 13192–1962006 [DOI] [PubMed] [Google Scholar]
- 8.Blayney DW, Simon MK, Podtschaske B, et al. Critical lessons from high-value oncology practices JAMA Oncol 4164–1712018 [DOI] [PMC free article] [PubMed] [Google Scholar]
- 9.Kurian AW, Mitani A, Desai M, et al. Breast cancer treatment across health care systems: Linking electronic medical records and state registry data to enable outcomes research Cancer 120103–1112014 [DOI] [PMC free article] [PubMed] [Google Scholar]
- 10.Banerjee I, Bozkurt S, Caswell-Jin JL, et al. Natural language processing approaches to detect the timeline of metastatic recurrence of breast cancer JCO Clin Cancer Inform 31–122019 [DOI] [PubMed] [Google Scholar]
- 11.PFS National Payment Amount File. 2016. https://www.cms.gov/Medicare/Medicare-Fee-for-Service-Payment/PhysicianFeeSched/PFS-National-Payment-Amount-File [Google Scholar]
- 12.Simon M, Choudhry NK, Frankfort J, et al. Exploring attributes of high-value primary care Ann Fam Med 15529–5342017 [DOI] [PMC free article] [PubMed] [Google Scholar]
- 13.Brady BA-O, Ragavan MV, Simon M, et al. Exploring care attributes of nephrologists ranking favorably on measures of value J Am Soc Nephrol 302464–24722019 [DOI] [PMC free article] [PubMed] [Google Scholar]
- 14.Schnipper LE, Smith TJ, Raghavan D, et al. American Society of Clinical Oncology identifies five key opportunities to improve care and reduce costs: The top five list for oncology J Clin Oncol 301715–17242012 [DOI] [PubMed] [Google Scholar]
- 15.Tamang S, Patel MI, Blayney DW, et al. Detecting unplanned care from clinician notes in electronic health records J Oncol Pract 11e313–e3192015 [DOI] [PMC free article] [PubMed] [Google Scholar]
- 16.White C.The future awakens: A report on the 2016 Vizient Clinical Connections Summit Am J Med Qual 323S–30S2017 [DOI] [PubMed] [Google Scholar]
- 17.Wallace PJ, Shah ND, Dennen T, et al. Optum Labs: Building a novel node in the learning health care system Health Aff (Millwood) 331187–11942014 [DOI] [PubMed] [Google Scholar]
- 18.Quint J. Health Research Data for the Real World: The MarketScan Databases. Ann Arbor, MI: Truven Health Analytics; 2015. [Google Scholar]
- 19.Barnes JI, Lin JK, Gupta D, et al. Cost-effectiveness of initial versus delayed lanreotide for treatment of metastatic enteropancreatic neuroendocrine tumors J Natl Compr Canc Netw 181200–12092020 [DOI] [PubMed] [Google Scholar]
- 20.Magnani C, Bieve N, Baker JC, et al. Real-world evidence to estimate prostate cancer costs for first-line treatment or active surveillance. [DOI] [PMC free article] [PubMed]
- 21.Blayney DW, Stella PJ, Ruane T, et al. Partnering with payers for success: Quality Oncology Practice Initiative, Blue Cross Blue Shield of Michigan, and the Michigan Oncology Quality Consortium J Oncol Pract 5281–2842009 [DOI] [PMC free article] [PubMed] [Google Scholar]
- 22.Value in Cancer Care Initiative. Seattle, WA: Hutchison Institute for Cancer Outcomes Research; https://www.fredhutch.org/en/research/institutes-networks-ircs/hutchinson-institute-for-cancer-outcomes-research/value-in-cancer-care-initiative.html [Google Scholar]
- 23.Pencina MJ, Goldstein BA, D'Agostino RB.Prediction models: Development, evaluation, and clinical application N Engl J Med 3821583–15862020 [DOI] [PubMed] [Google Scholar]