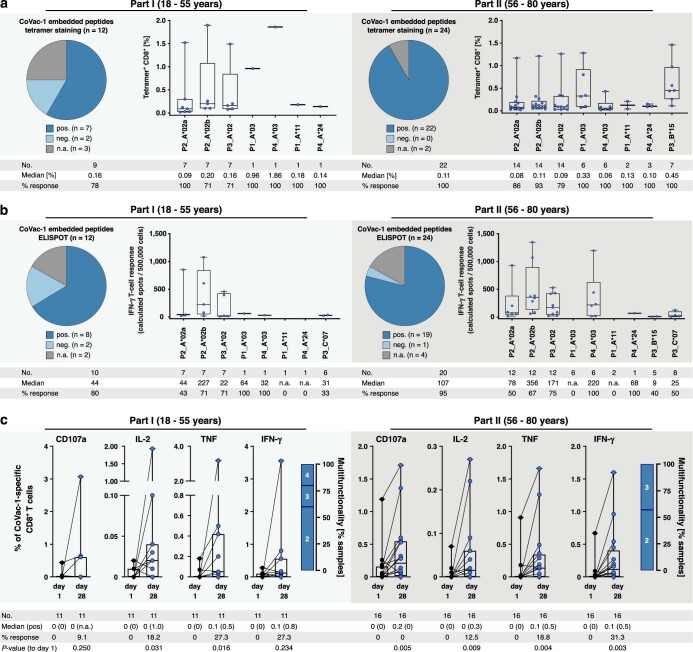
Extended Data Fig. 6. CoVac-1-induced CD8+ T cell responses to HLA class I-restricted CoVac-1-embedded peptides and CoVac-1 peptides.
T cell responses to HLA class I-restricted SARS-CoV-2 peptides embedded within the CoVac-1 vaccine peptides (matching the HLA allotype of the respective participant) were assessed by (a) tetramer staining and (b) IFNγ ELISPOT assays after in vitro expansion of PBMCs from study participants (part I and II) obtained on day 28 after vaccination. Pie charts display number of samples with (a) specific T cells or (b) IFNγ T cell responses to CoVac-1-embedded peptides (pos, positive; neg, negative; n.a., not assessed). Dots represent frequencies of peptide-specific T cells shown for individual donors with detected T cell responses only. (c) Frequencies of functional CoVac-1‐induced CD4+ T cells in study participants prior to vaccination (day 1) and at day 28 following vaccination using intracellular cytokine (IFNγ, TNF, and IL-2) and surface marker staining (CD107a). The right graph displays the proportion of samples revealing difunctional (2), trifunctional (3), or tetrafunctional (4) T cell responses. (a–c) Box plots or combined box-line plots show median with 25th or 75th percentiles, and min/max whiskers, two-sided Wilcoxon signed-rank test. no, number; pos, positive.

