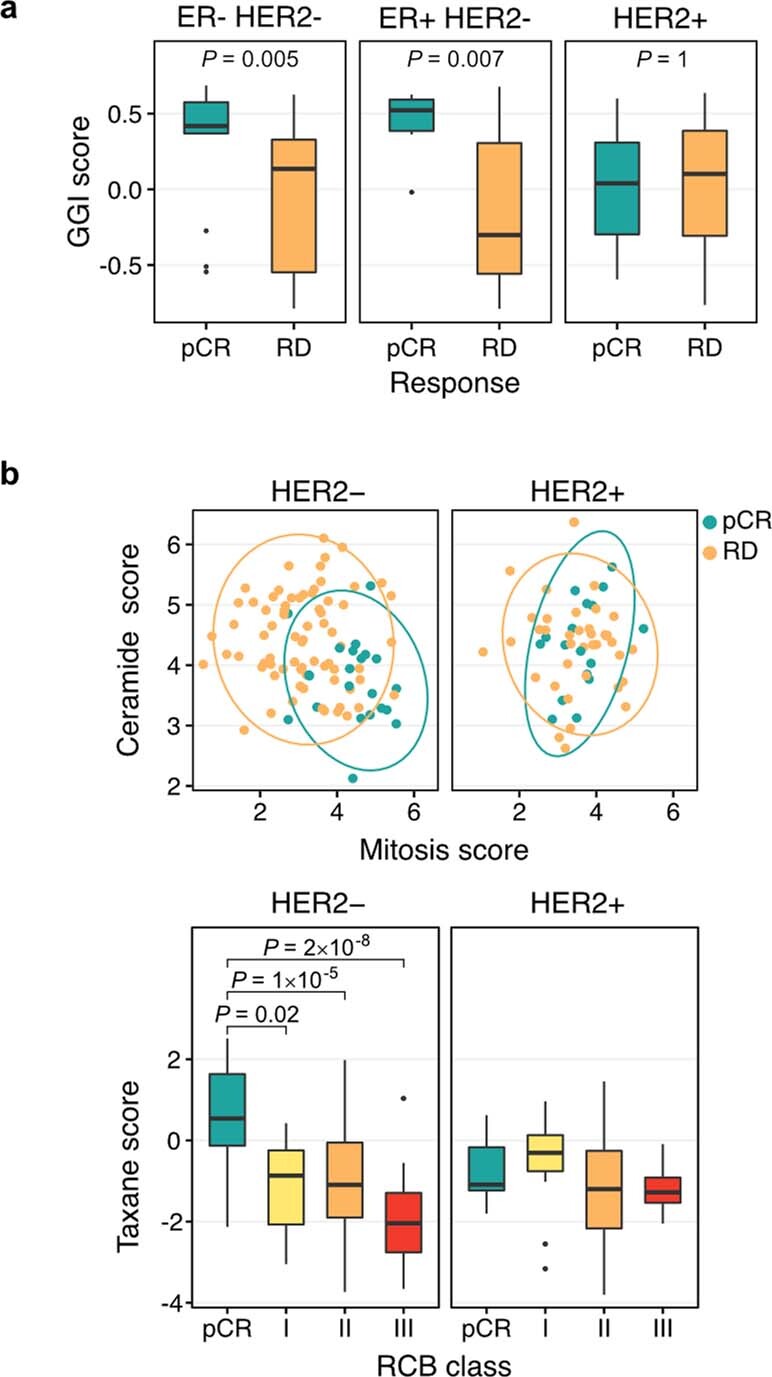
Extended Data Fig. 6. Associations between tumour proliferation and response.

a, Box plots showing associations between proliferation (GGI) GSVA scores across ER/HER subtypes. b, Top: Scatter plots showing the distribution of the mitotic and ceramide score components of a taxane response metagene within the HER2- and HER2+ cohorts. Bottom: Box plots showing association of the combined taxane response metagene score within the HER2- and HER2+ cohorts. In a, b, the box bounds the interquartile range divided by the median, with the whiskers extending to a maximum of 1.5 times the interquartile range beyond the box. Outliers are shown as dots. Two-tailed Wilcoxon rank sum tests. Number of cases (n): ER-HER2-: 37, ER+HER2-: 57, HER2+: 55.
